OVERVIEW
Markets slipped last week, with losses across most major equity benchmarks. The S&P 500 fell 0.31%, while the Dow declined a more modest 0.15%. The NASDAQ lagged with a 0.65% drop. Broad measures were weaker too, as the Russell 3000 slid 0.40%. Growth stocks (-0.94%) underperformed value (+0.10%), trimming their year-to-date lead.
By size, small caps were the weakest link. The S&P 600 shed 0.64%, mid-caps (S&P 400) dropped 0.50%, and large caps (S&P 100) held up better with a 0.45% decline. International markets were mixed, as developed markets (EAFE) slipped 0.43% while emerging markets sold off more sharply at -1.14%.
Bond markets offered only limited support. Short-term Treasuries inched up 0.07%, but intermediate and long-term Treasuries fell 0.21% and 0.14%, respectively. Investment-grade corporates lost 0.40%, and high yield bonds declined 0.23%. Municipals eased 0.20%.
Commodities staged a rebound. Oil surged 4.76%, and gold gained 2.78%, extending its standout year-to-date performance above 44%. Broad commodities rose 2.07%, though corn slipped 0.47%. Real estate (-0.69%) softened, while MLPs bucked the trend, gaining 1.58%.
The U.S. dollar strengthened 0.62%, while volatility retreated, with the VIX dropping 1.04%.
KEY CONSIDERATIONS
A Tired Stock Market – I came across an idea this week that the stock market is “tired.” I thought that was a pretty interesting way to describe the market.
It’s interesting because, on the one hand, some stock market valuation measures are indeed at nosebleed levels. And that’s always worrisome because it makes us feel like maybe stocks have reached a pinnacle. Maybe we’re at the top?
For example, the following chart shows the S&P 500 Index versus its price-to-sales ratio. In other words, it divides the market’s price by what companies are producing in sales (revenue). Many investors like this measure because sales—unlike earnings—can’t really be manipulated by accounting tricks and gimmicks. So the higher the market’s price relative to its underlying sales, the more overvalued the market really is.
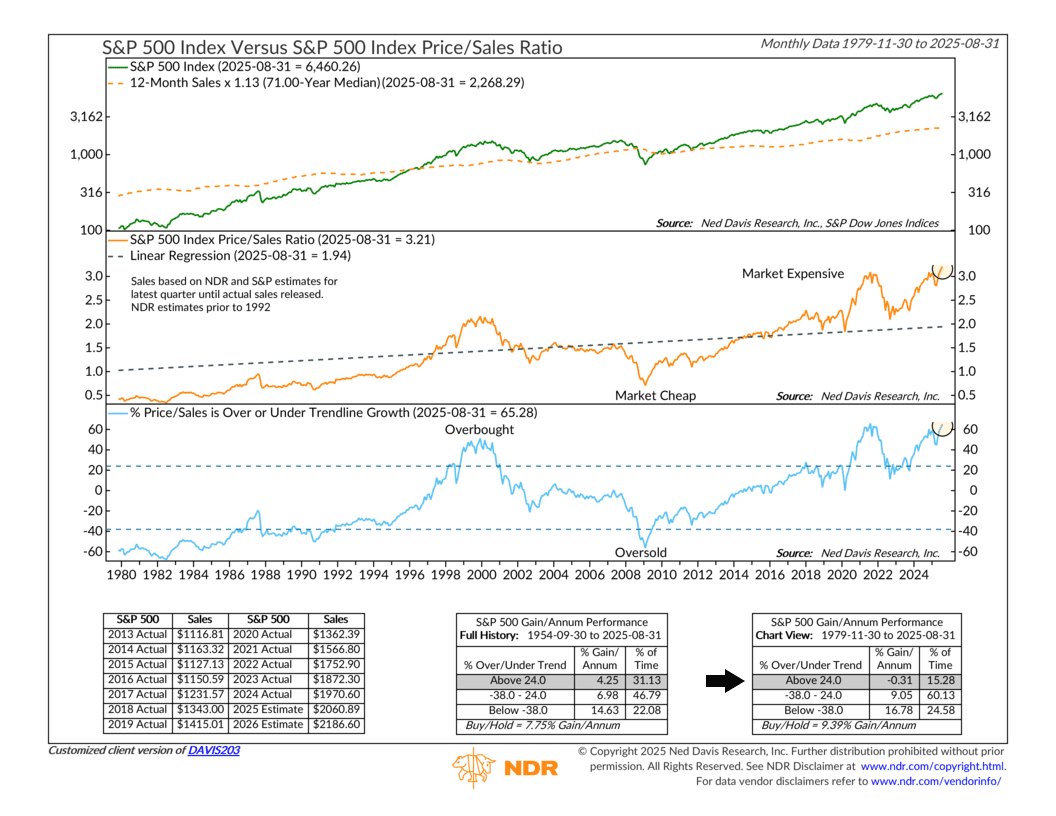
As you can see, it’s near its highest level ever—meaning the market is very much overvalued relative to sales. And that’s worrisome because, as the performance box shows, historically, when this measure of market valuation is above 24 (it’s at 65 right now), the stock market has had negative returns on average going back to 1979.
On the other hand, though, it’s still hard to see any material breakdown in the market’s actual price action right now. Sure, we had three straight down days last week, and the S&P 500 came close to crossing below its 20-day average price. But still, that’s the 20-day average we’re talking about here. As this next chart shows, the S&P 500 would need to drop another 2.5% to reach its 50-day average price, and more than 9% to reach its 200-day average price.
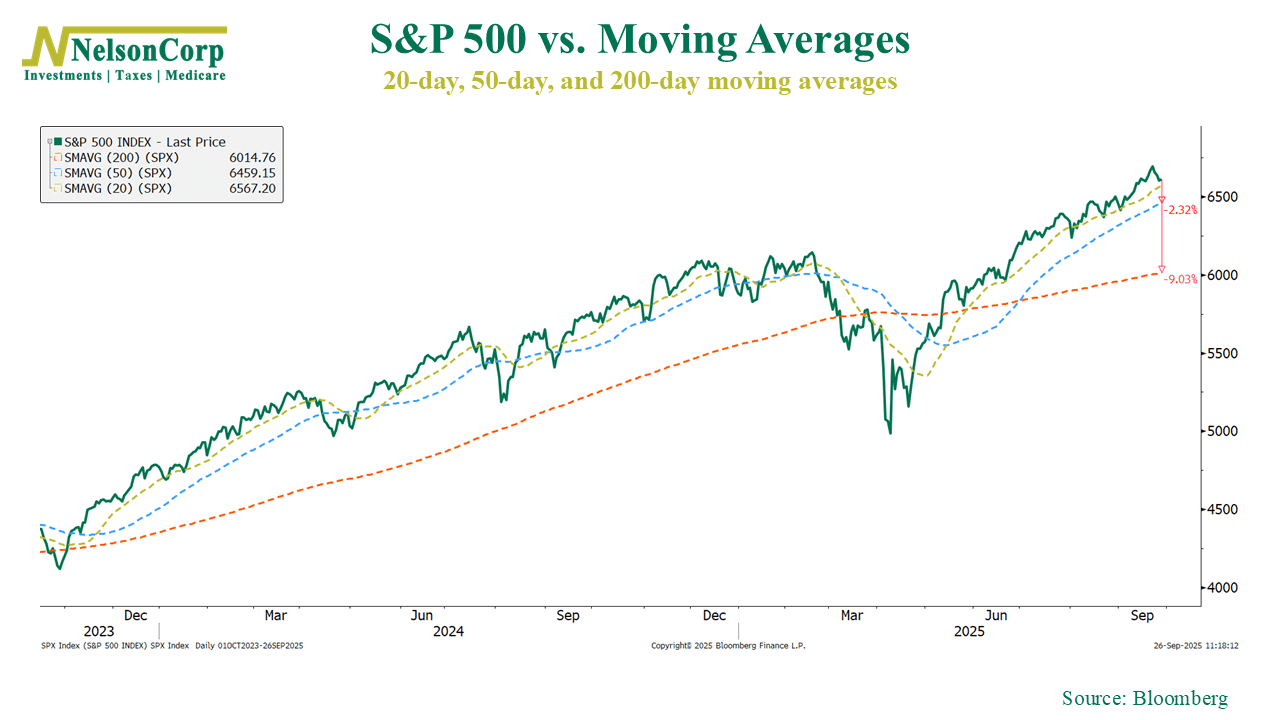
Don’t get me wrong, that can absolutely happen—and it can happen in a heartbeat. But until we see some actual breakdown in momentum, it’s hard to get too worried about sky-high valuations.
With all that said, though, I don’t want to completely throw valuations out with the bathwater. They still matter to a degree—in the long run. So I’ll end with one example of why, one that’s not fancy at all, that shows why the market is probably getting a bit tired.
This final chart shows the S&P 500’s return over the past three years. Pretty simple. As you can see, it’s up about 87% in total, which equates to about a 23% annualized gain.
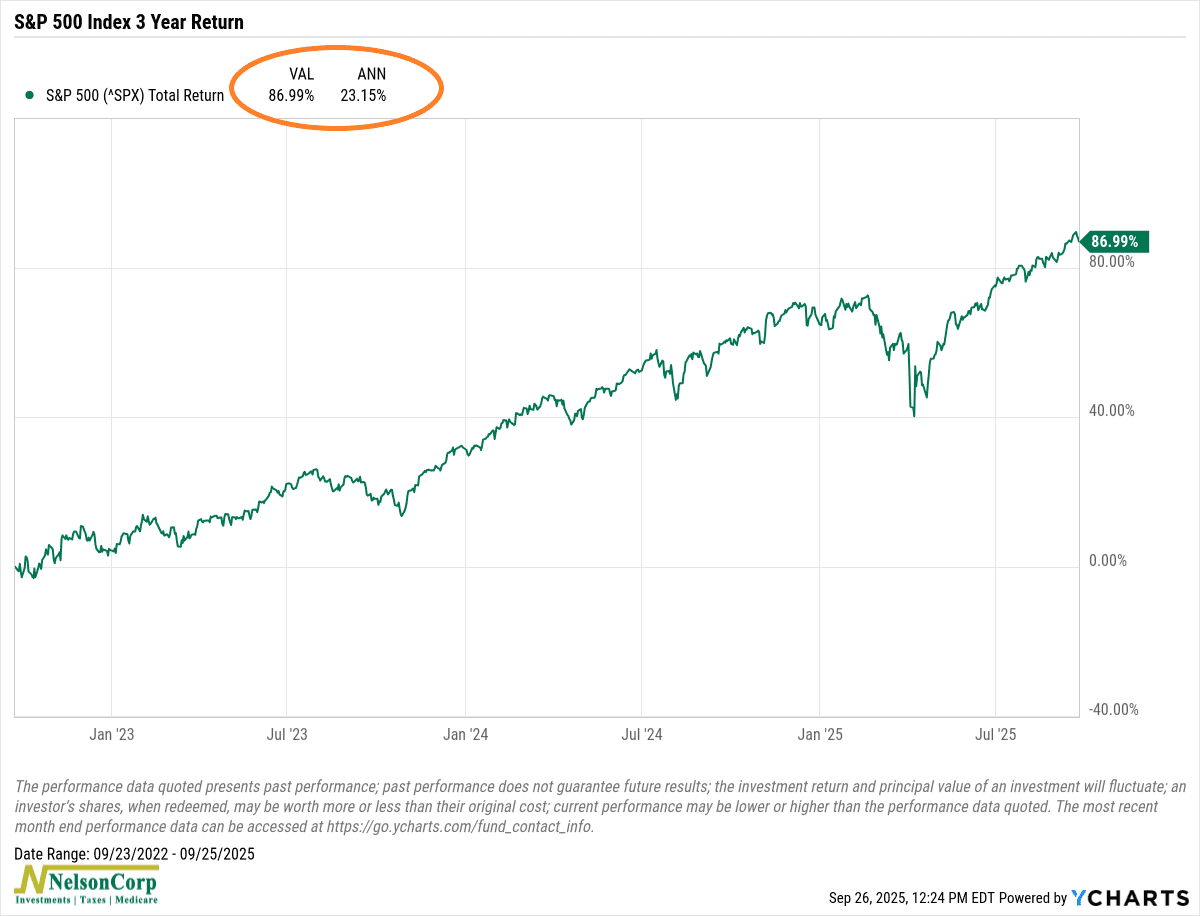
Twenty-three percent annualized. Over three years. That’s a lot! I could be wrong, but I think it’s highly unlikely that the stock market will go on producing a 23% average gain per year going forward. The more realistic reading is that the stock market has had a pretty nice run the past few years and now returns are likely to be lower as it comes back to its more normal historical average.
Bottom Line: Nothing to panic about here. The market isn’t breaking down yet, but lofty valuations and big recent gains suggest it’s running low on fuel. After such a strong three-year stretch, investors should probably just expect more modest returns ahead, unless this really is a bubble.
This is intended for informational purposes only and should not be used as the primary basis for an investment decision. Consult an advisor for your personal situation.
Indices mentioned are unmanaged, do not incur fees, and cannot be invested into directly.
Past performance does not guarantee future results.
The S&P 500 Index, or Standard & Poor’s 500 Index, is a market-capitalization-weighted index of 500 leading publicly traded companies in the U.S.
The Dow Jones Industrial Average (DJIA) is a price-weighted index composed of 30 widely traded blue-chip U.S. common stocks. The Nasdaq 100 Index is a basket of the 100 largest, most actively traded U.S. companies listed on the Nasdaq stock exchange. The index includes companies from various industries except for the financial industry, like commercial and investment banks. The Russell 3000 Index is a capitalization-weighted stock market index that seeks to be a benchmark of the entire U.S. stock market. The S&P MidCap 400 is designed to measure the performance of 400 mid-sized companies, reflecting the distinctive risk and return characteristics of this market segment. S&P 600 Index measures the small-cap segment of the U.S. equity market. The index is designed to track companies that meet specific inclusion criteria to ensure that they are liquid and financially viable. The S&P 100 index is a capitalization-weighted index based on 100 highly capitalized stocks for which options are listed on the CBOE (Chicago Board of Exchange). The MSCI EAFE Index is an equity index which captures large and mid cap representation across 21 Developed Markets countries* around the world, excluding the US and Canada.
The Bloomberg U.S. Corporate Bond Index measures the investment grade, fixed-rate, taxable corporate bond market. The Bloomberg U.S. Corporate High Yield Index is comprised of domestic and corporate bonds rated Ba and below with a minimum outstanding amount of $150 million. The Bloomberg U.S. Municipal Index covers the USD-denominated long-term tax exempt bond market. The index has four main sectors: state and local general obligation bonds, revenue bonds, insured bonds and prerefunded bonds.