OVERVIEW
Markets turned in mixed results last week. The S&P 500 gained 0.33%, while the Dow Jones Industrial Average slipped 0.32%. The NASDAQ led among major U.S. indexes with a 1.14% advance. Broad measures like the Russell 3000 added 0.46%, with growth stocks (+0.83%) outpacing value (+0.06%).
By size, mid-caps performed the best, with the S&P 400 up 1.31%. Small caps (S&P 600) gained 0.83%, while large caps (S&P 100) rose 0.54%. International markets were positive but more subdued, with developed markets (EAFE) up 0.20% and emerging markets climbing 1.40%.
Bond markets had a strong showing, particularly on the longer end of the curve. Long-term Treasuries surged 2.64%, while intermediate Treasuries added 0.83% and short-term Treasuries edged up 0.11%. Investment-grade corporates gained 1.17%, and high-yield bonds rose 0.32%. Municipals added 0.76%.
Commodities were weaker overall. Oil dropped nearly 3%, and broad commodities fell 0.35%. Corn slid 0.54%. Gold was the clear standout, rallying 3.90% and extending its year-to-date lead to over 38%. Real estate added a modest 0.25%, while MLPs fell 2.01%.
The U.S. dollar was little changed, up 0.11%. Volatility eased further, with the VIX closing the week at 15.18.
KEY CONSIDERATIONS
Adding Punch to the Punchbowl – Back in 1955, Federal Reserve Chair William McChesney Martin made a speech to the Investment Bankers Association in New York. In the speech, he characterized the Fed’s job as a chaperone whose job it is to remove the punch bowl just as the party gets going.
In other words, it’s the Fed’s job to be a party pooper. It should tighten monetary policy when the economy gets overheated, even if everyone is having a good time with easy money and growth.
Today, however, it appears we are in the opposite situation—the Fed might need to be more like a party starter. Maybe it needs to jump on the table and add more punch to the punchbowl?
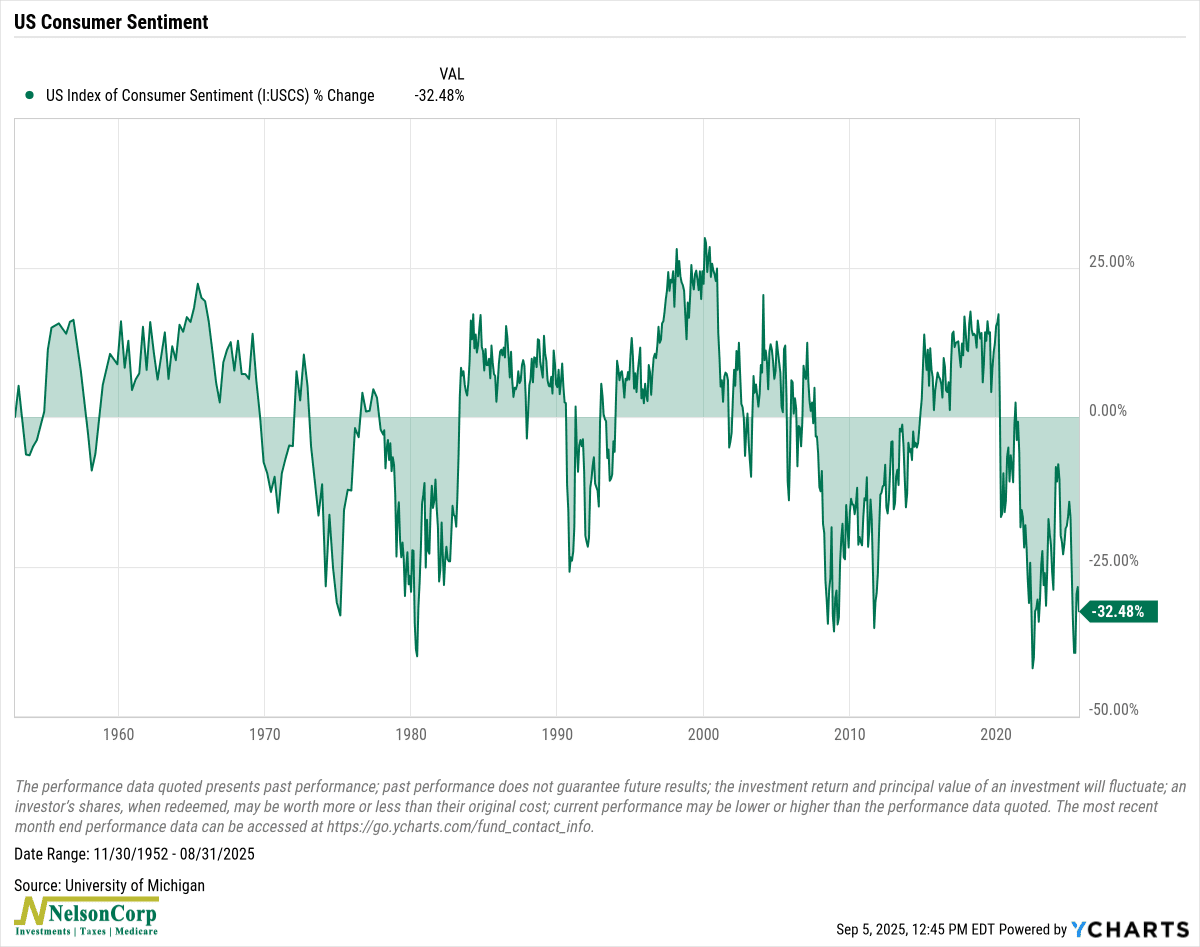
Why? Because there are more and more signs that the economy is getting lethargic. The Fed’s Beige Book—which compiles anecdotal reports from its 12 regional banks—showed “little or no change” in activity across the majority of districts. And consumer sentiment, shown below, is in the pits.
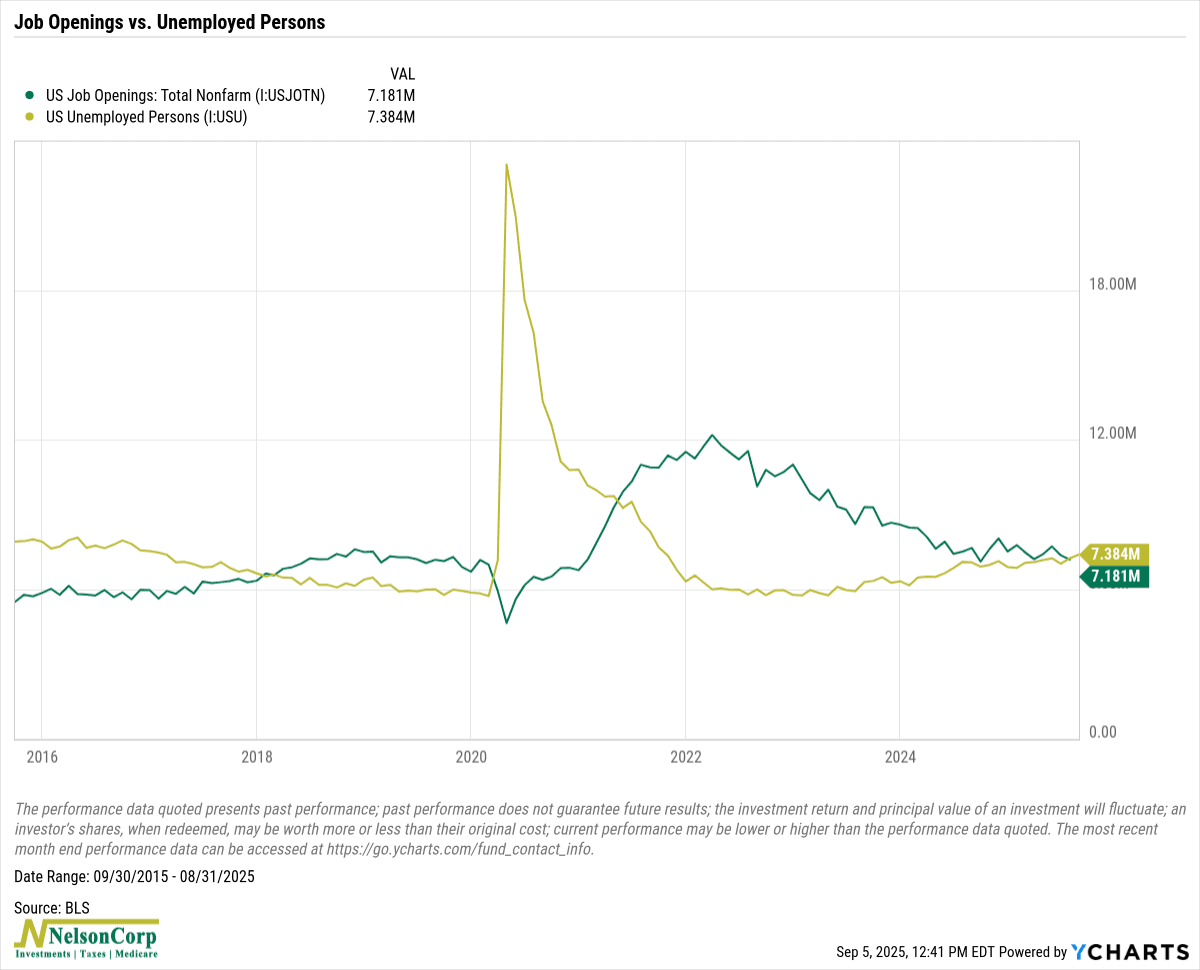
And then there’s the jobs situation. On Friday, the nonfarm payrolls reports showed that the U.S. only added about 22,000 jobs in August. Oh, and the number of job openings was just 7.18 million last month, below the number of unemployed workers, which is still over 7.2 million. In other words, for the first time in four years, there are more unemployed folks than there are job openings.
Put this all together and you get a pretty strong case that the Fed needs to lower rates soon. In fact, investors are pretty darn sure that that is going to happen later this month. According to the CME FedWatch tool, shown below, the market is pricing in an 88% chance of a 25 basis point rate cut at the September 17th meeting.

This is why stocks have been fairly resilient in recent weeks. We’re back into the “bad news is good news” environment again, where bad economic news is treated by traders as good news because it increases the chance the Fed will cut rates to stimulate the economy.
That may seem a little weird, but the objectively good news from our perspective is that our main stock market risk model is still sitting in solidly positive territory, as you can see in the chart below.
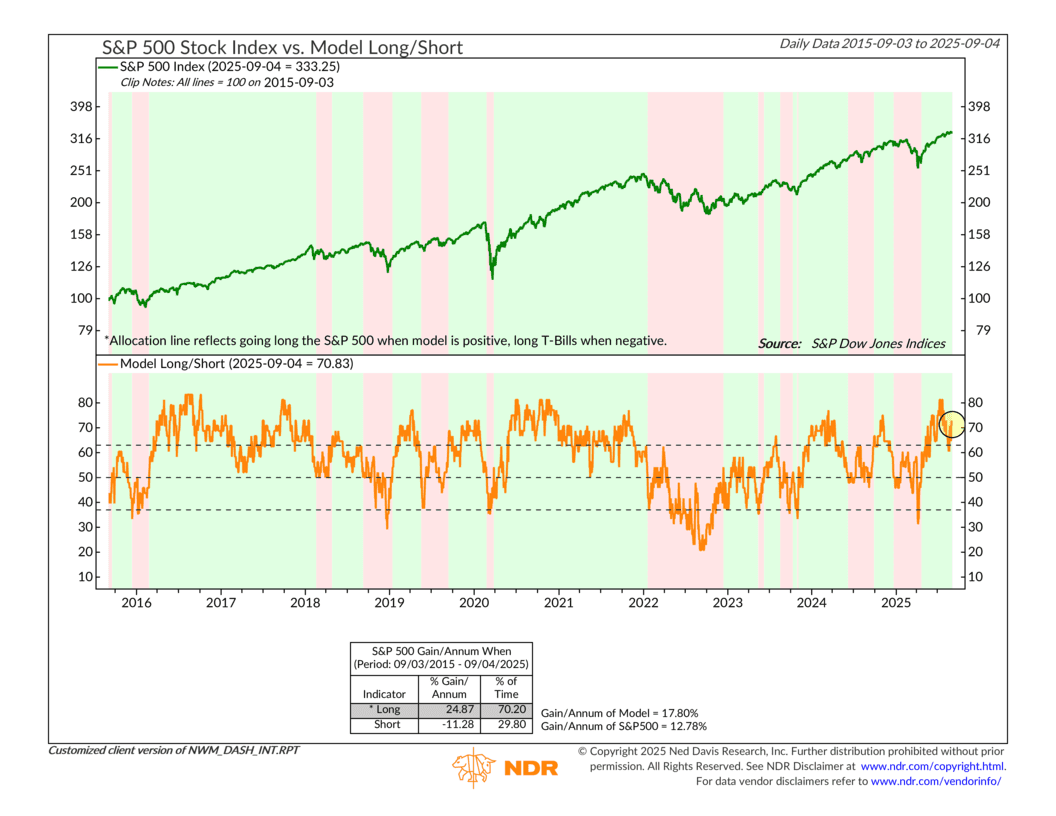
In plain English, that means the party isn’t over just yet. Things may be slowing down a bit, but the music’s still playing at the moment.
This is intended for informational purposes only and should not be used as the primary basis for an investment decision. Consult an advisor for your personal situation.
Indices mentioned are unmanaged, do not incur fees, and cannot be invested into directly.
Past performance does not guarantee future results.
The S&P 500 Index, or Standard & Poor’s 500 Index, is a market-capitalization-weighted index of 500 leading publicly traded companies in the U.S.
The Dow Jones Industrial Average (DJIA) is a price-weighted index composed of 30 widely traded blue-chip U.S. common stocks. The Nasdaq 100 Index is a basket of the 100 largest, most actively traded U.S. companies listed on the Nasdaq stock exchange. The index includes companies from various industries except for the financial industry, like commercial and investment banks. The Russell 3000 Index is a capitalization-weighted stock market index that seeks to be a benchmark of the entire U.S. stock market. The S&P MidCap 400 is designed to measure the performance of 400 mid-sized companies, reflecting the distinctive risk and return characteristics of this market segment. S&P 600 Index measures the small-cap segment of the U.S. equity market. The index is designed to track companies that meet specific inclusion criteria to ensure that they are liquid and financially viable. The S&P 100 index is a capitalization-weighted index based on 100 highly capitalized stocks for which options are listed on the CBOE (Chicago Board of Exchange). The MSCI EAFE Index is an equity index which captures large and mid cap representation across 21 Developed Markets countries* around the world, excluding the US and Canada.
The Bloomberg U.S. Corporate Bond Index measures the investment grade, fixed-rate, taxable corporate bond market. The Bloomberg U.S. Corporate High Yield Index is comprised of domestic and corporate bonds rated Ba and below with a minimum outstanding amount of $150 million. The Bloomberg U.S. Municipal Index covers the USD-denominated long-term tax exempt bond market. The index has four main sectors: state and local general obligation bonds, revenue bonds, insured bonds and prerefunded bonds.