OVERVIEW
U.S. stocks hit new records and posted weekly gains once again last week. The Nasdaq surged by 3.5%, the S&P 500 increased by 1.95%, and the Dow rose by 0.66%.
Growth shares led the charge, gaining 2.64%, compared to a modest 0.2% rise for value stocks. In contrast, small-cap stocks struggled, posting a 0.16% decline for the week.
Foreign stocks performed well, with developed markets rising by 1.92% and emerging markets gaining 1.61%. The U.S. dollar weakened, dropping by around 0.86%.
Bonds had a decent week as the yield on the benchmark 10-year Treasury fell from 4.4% to 4.28%. Overall, the Bloomberg US Aggregate Index rose by about 0.7%.
The Bloomberg Commodity Index also gained ground, advancing by nearly 1.7%, while oil prices rose by over 2%. Conversely, real estate declined by about 0.3% for the week.
KEY CONSIDERATIONS
Big Mo Says No – The stock market reached another all-time high last week.
But there’s a small problem. By one important indicator that we track, momentum is weakening.
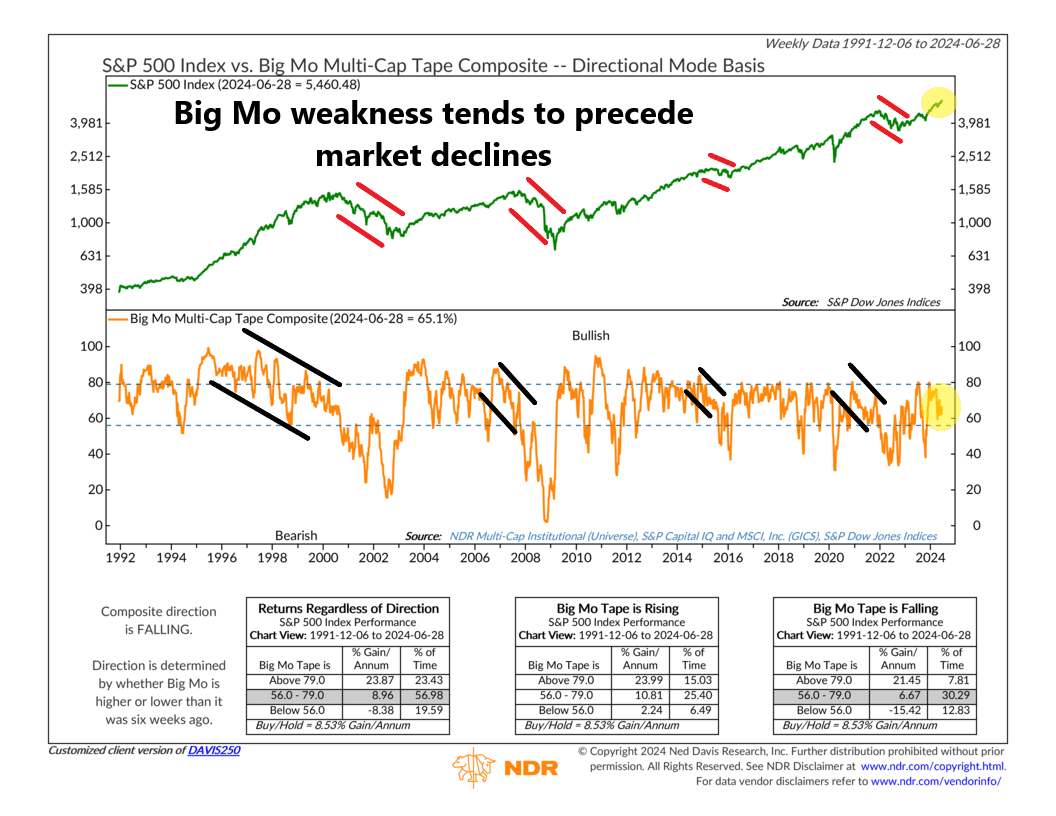
The indicator in question is called Big Mo (short for Big Momentum). It’s a metric that measures the percentage of stock market industries in uptrends.
As you can see on the chart below, historically, Big Mo has tended to decline prior to major market declines.

Stated differently, whenever we see the stock market reach a new high but Big Mo is weakening, it’s what the kids nowadays call a “red flag.”
Unfortunately, we are seeing exactly that right now. While the S&P 500 is trading near all-time highs, Big Mo has failed to confirm the message. It’s in its middle zone, which is OK, but it’s falling relative to where it was six weeks ago.
That means the indicator is neutral. That’s good, but not great. Historically, the market has risen at about a 6.7% pace when this is the case. However, if Big Mo continues to deteriorate and drops below the lower dashed line, that’s when things get interesting (in a bad way).
The bottom line? This doesn’t mean the market is going to tank tomorrow. This is just one indicator among many that we track. But it does suggest that momentum might not be as strong as it seems from looking only at the headline market indices.
This is intended for informational purposes only and should not be used as the primary basis for an investment decision. Consult an advisor for your personal situation.
Indices mentioned are unmanaged, do not incur fees, and cannot be invested into directly.
Past performance does not guarantee future results.
The S&P 500 Index, or Standard & Poor’s 500 Index, is a market-capitalization-weighted index of 500 leading publicly traded companies in the U.S.
