OVERVIEW
KEY CONSIDERATIONS
Bullish Leads to Bullish – It was a bit of a bumpy week for the U.S. stock market last week. But, I mean, after such a strong run that is to be expected.
Just how strong has this run been? Well, the S&P 500 stock index gained 10.7% through the first five months of 2026. That puts it on pace for a 15%+ gain for a fourth year in a row.
Gains have been so persistent and bullish lately because, well, returns have been so persistent and bullish lately. I know that sounds like a truism—but let me explain what I mean.
The following indicator is what we call the Three-Week Price Thrust indicator. It was invented by the analyst Wayne Whaley. It shows what happened after the eight previous times the market was up three weeks in a row by 3% or more each week. As you can see, since 1950, 100% of these (hypothetical) buy signals were profitable three—and even six—months later.
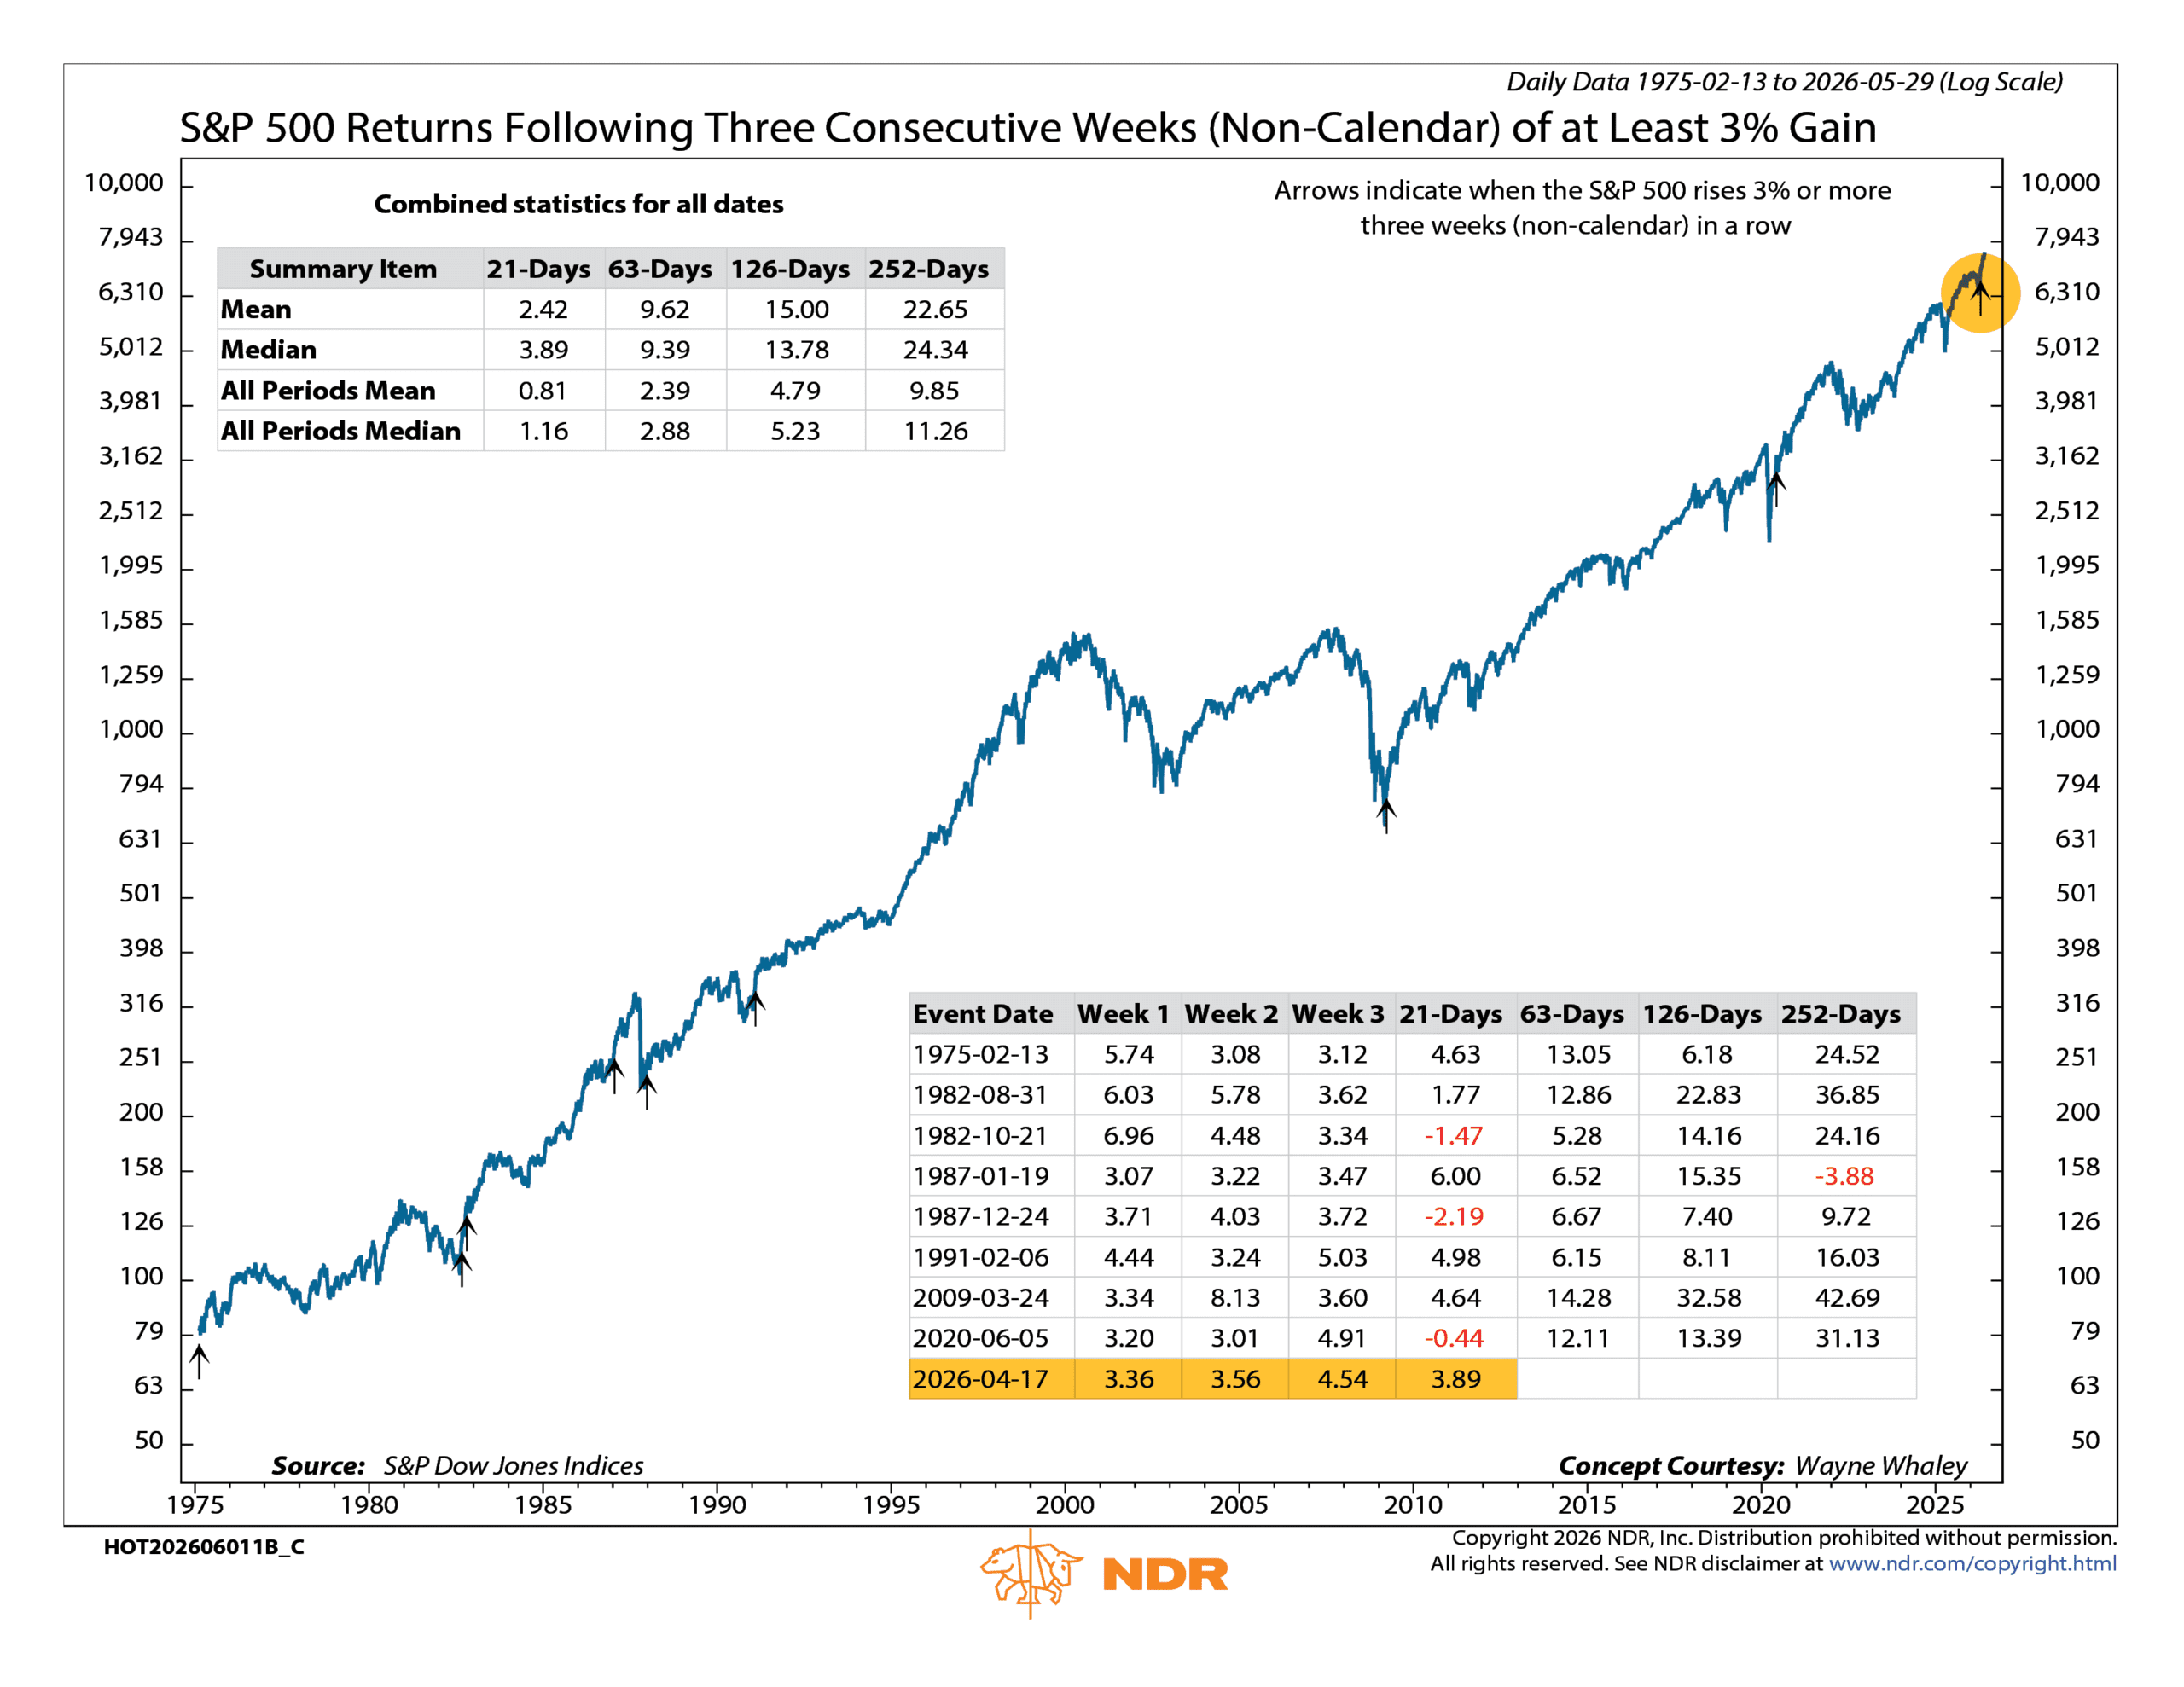
So why am I showing you this? Because from the week ending April 2nd to the week ending April 17th, the S&P 500 was up 3.36%, 3.56%, and 4.54%, respectively. That was three weeks in a row of at least 3%+ plus gains. So, according to this indicator, the market should have been poised to gain even more over the ensuing weeks—and it has.
In other words, market strength begets market strength. A few persistent and bullish weeks tend to lead to more bullish weeks, and so on. It’s momentum investing in a nutshell. Love it or hate it, it works more often than not.
But, with that said, there are some bearish indicators attempting to put a lid on all this momentum.
Interest rates are probably the biggest culprit right now. The bond market has been struggling with rising rates, and rising rates are—usually—not something the stock market loves either.
For example, the following indicator shows how the 125-day point change in the 2-year Treasury yield has historically affected the S&P 500 stock index. As you can see, when rates get too high above their normal range, it tends to produce negative returns for the stock market.
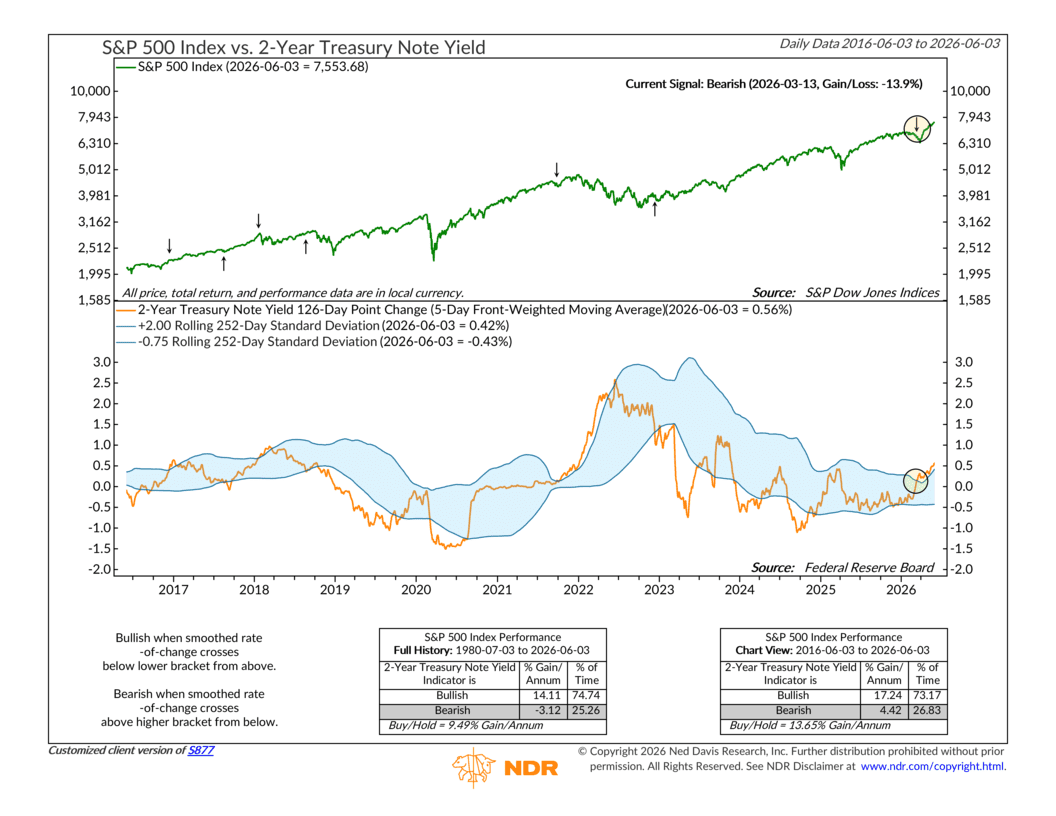
We got one of these bearish (negative) signals back on March 13th. But, of course, the stock market ignored it. The S&P 500 is up nearly 14% since that signal. Like I said, there are some bearish indicators attempting to put a lid on the market—but so far, this one, at least, has failed. At some point, however, this could start to affect the market in a negative way, so it’s an important indicator to keep an eye on.
There are some other bearish indicators, too. Like the notorious A/D Line (Advance/Decline Line). Back in the late 1990s, the A/D Line showed a divergence with the S&P 500 that lasted nearly two years before the dotcom bubble burst. Currently, we are just six weeks from the most recent A/D peak.
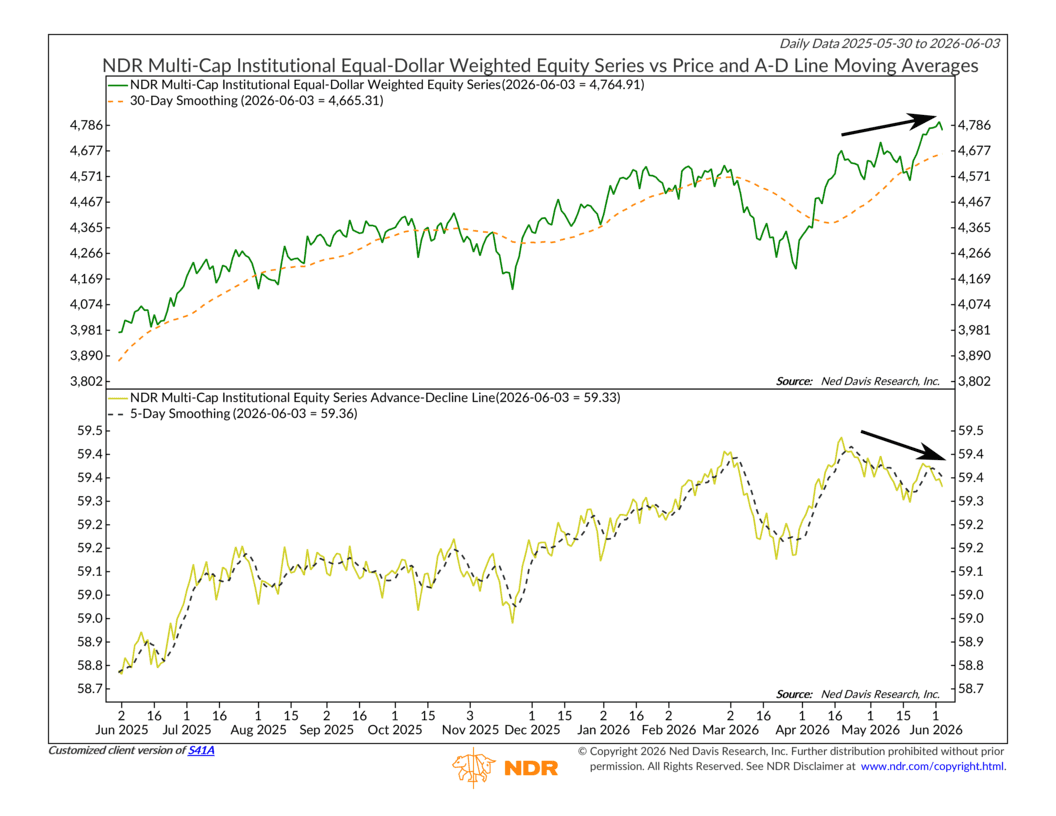
More often than not, divergences like this resolve to the upside, meaning the market just moves higher and eventually the A/D line catches up. But sometimes they don’t. The current risk to the market in the second half of the year is that the AI theme becomes too popular, and the rally narrows out and falters when the inevitable AI slowdown occurs.
One good case scenario would be that we see a correction in stock prices in the third quarter, consistent with historical tendencies. This would hopefully prevent divergences from becoming too wide, and potentially set the market up for a year-end rally.
This is intended for informational purposes only and should not be used as the primary basis for an investment decision. Consult an advisor for your personal situation.
Indices mentioned are unmanaged, do not incur fees, and cannot be invested into directly.
Past performance does not guarantee future results.
The S&P 500 Index, or Standard & Poor’s 500 Index, is a market-capitalization-weighted index of 500 leading publicly traded companies in the U.S.
The Dow Jones Industrial Average (DJIA) is a price-weighted index composed of 30 widely traded blue-chip U.S. common stocks. The Nasdaq 100 Index is a basket of the 100 largest, most actively traded U.S. companies listed on the Nasdaq stock exchange. The index includes companies from various industries except for the financial industry, like commercial and investment banks. The Russell 3000 Index is a capitalization-weighted stock market index that seeks to be a benchmark of the entire U.S. stock market. The S&P MidCap 400 is designed to measure the performance of 400 mid-sized companies, reflecting the distinctive risk and return characteristics of this market segment. S&P 600 Index measures the small-cap segment of the U.S. equity market. The index is designed to track companies that meet specific inclusion criteria to ensure that they are liquid and financially viable. The S&P 100 index is a capitalization-weighted index based on 100 highly capitalized stocks for which options are listed on the CBOE (Chicago Board of Exchange). The MSCI EAFE Index is an equity index which captures large and mid cap representation across 21 Developed Markets countries* around the world, excluding the US and Canada.
The Bloomberg U.S. Corporate Bond Index measures the investment grade, fixed-rate, taxable corporate bond market. The Bloomberg U.S. Corporate High Yield Index is comprised of domestic and corporate bonds rated Ba and below with a minimum outstanding amount of $150 million. The Bloomberg U.S. Municipal Index covers the USD-denominated long-term tax exempt bond market. The index has four main sectors: state and local general obligation bonds, revenue bonds, insured bonds and prerefunded bonds.