OVERVIEW
Markets posted broad gains last week, with strength across equities both in the U.S. and overseas. The S&P 500 rose 0.94%, while the Dow added 1.74%. The NASDAQ gained 0.81%. Small caps led the way, with the S&P 600 surging 3.15% after lagging in prior weeks. Mid-caps also advanced, with the S&P 400 up 1.55%. Value outpaced growth, as the Russell 3000 Value Index climbed 1.47% compared to a 0.77% gain for Growth.
International markets remained strong. Developed markets (EAFE) rallied 2.28%, while emerging markets gained 1.49%. The U.S. dollar slipped 0.33% for the week.
Bonds delivered mixed results. Short-term Treasuries were slightly positive, while intermediate-term Treasuries slipped 0.16% and long-term Treasuries fell 1.00%. Investment-grade bonds added 0.19%, and high-yield bonds rose 0.27%. Municipal bonds were essentially flat, up just 0.04%.
Commodities were volatile. Gold pulled back sharply, dropping 3.11%, while oil fell 0.68%. Corn rebounded with a 3.42% gain. Real estate edged higher, up 0.68%. Meanwhile, volatility eased further, with the VIX down slightly for the week.
KEY CONSIDERATIONS
Can I Get a “Breadth” Mint? – All things considered, the stock market has done pretty well this year. If you had pulled a Rip Van Winkle on December 31, 2024—fallen asleep and woken up this week—you might think it’s been a pretty uneventful year in financial markets.
Of course, we know that’s not true. Before summer, the market went through a sharp sell-off, dropping nearly 20% from its highs. Then it clawed back those losses over the summer and now sits at new highs once again.
But there’s a dirty little secret behind this rally: it’s been built on fairly weak breadth.
The chart below shows the spread between the percentage of S&P 500 stocks making new 52-week highs and those making new lows. Up until late December of last year, this “breadth” metric was consistently in bullish territory. Then something shifted. As the new year began, breadth slipped into a much lower range.
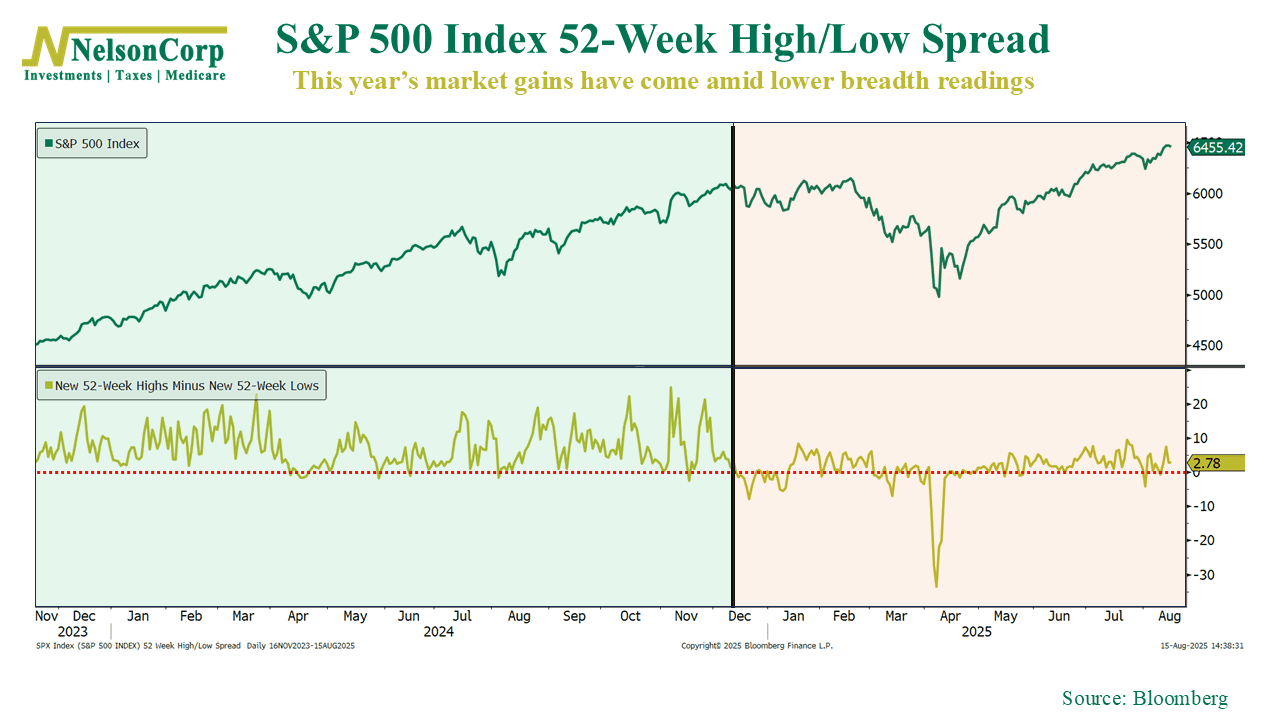
That was important because weak breadth meant fewer stocks were participating in the market’s gains, leaving the market more vulnerable to a pullback—which is exactly what happened in March and April. Luckily, our models picked up on this weaker breadth way back in December as well, so we were able to make the appropriate adjustments. But even though the broader market has since recovered from all that, breadth hasn’t really recovered—at least not to the levels we were seeing prior to the start of the year.
What’s especially notable in the chart is how flat the breadth readings have been during the latest rally. In stronger markets, you’ll often see spikes in new highs as more companies join the advance. Lately, though, those spikes have been missing, suggesting the gains are being driven by a relatively small group of stocks. That kind of narrow leadership can work for a while, but history shows it’s rarely sustainable without broader participation.
So yeah, the bottom line is that we’re glad the market has been cooperative lately, but that doesn’t guarantee smooth sailing from here on out. Weak breadth remains a risk. Until participation improves and we return to a more bullish breadth regime, the market will likely stay more vulnerable to bad news.
This is intended for informational purposes only and should not be used as the primary basis for an investment decision. Consult an advisor for your personal situation.
Indices mentioned are unmanaged, do not incur fees, and cannot be invested into directly.
Past performance does not guarantee future results.
The S&P 500 Index, or Standard & Poor’s 500 Index, is a market-capitalization-weighted index of 500 leading publicly traded companies in the U.S.