OVERVIEW
Markets pulled back modestly during the first week of the new year, with U.S. equities generally lower across the board. Large-cap stocks led the decline, as the S&P 500 fell 1.03% and the NASDAQ dropped 1.52%. The Dow Jones Industrial Average declined 0.67%, while the S&P 100 slipped 1.23%, reflecting continued pressure in larger growth-oriented names.
Breadth was mixed beneath the surface. Small- and mid-cap stocks underperformed on the week, with the S&P 600 down 1.43% and the S&P 400 falling 0.71%. Within the Russell 3000, growth stocks lagged noticeably, declining 1.72%, while value stocks were relatively resilient, down just 0.15%.
International markets provided a bright spot. Developed international stocks advanced 0.51%, while emerging markets posted strong gains, rising 2.30% on the week. Early in the year, non-U.S. equities continue to show relative strength compared to U.S. stocks.
Fixed income returns were mixed. Short-term Treasuries posted small gains, while intermediate- and long-term Treasuries declined. Investment-grade bonds were modestly lower, though high-yield bonds and municipal bonds finished the week higher, helping cushion broader portfolio volatility.
Commodities were a weak area. Broad commodity prices fell 2.64%, led by a sharp decline in gold, which dropped 4.90%. Oil prices edged higher, while the U.S. dollar strengthened modestly, rising 0.52%.
Volatility moved higher during the week, with the VIX up 6.69%, reflecting some early-year uncertainty, though overall levels remain consistent with a relatively orderly market environment.
KEY CONSIDERATIONS
Constructive, with Conditions – The stock market ended the year on pretty solid footing. And overall, the weight of the evidence continues to lean more towards the constructive side of things, even if conditions are starting to look a bit stretched.
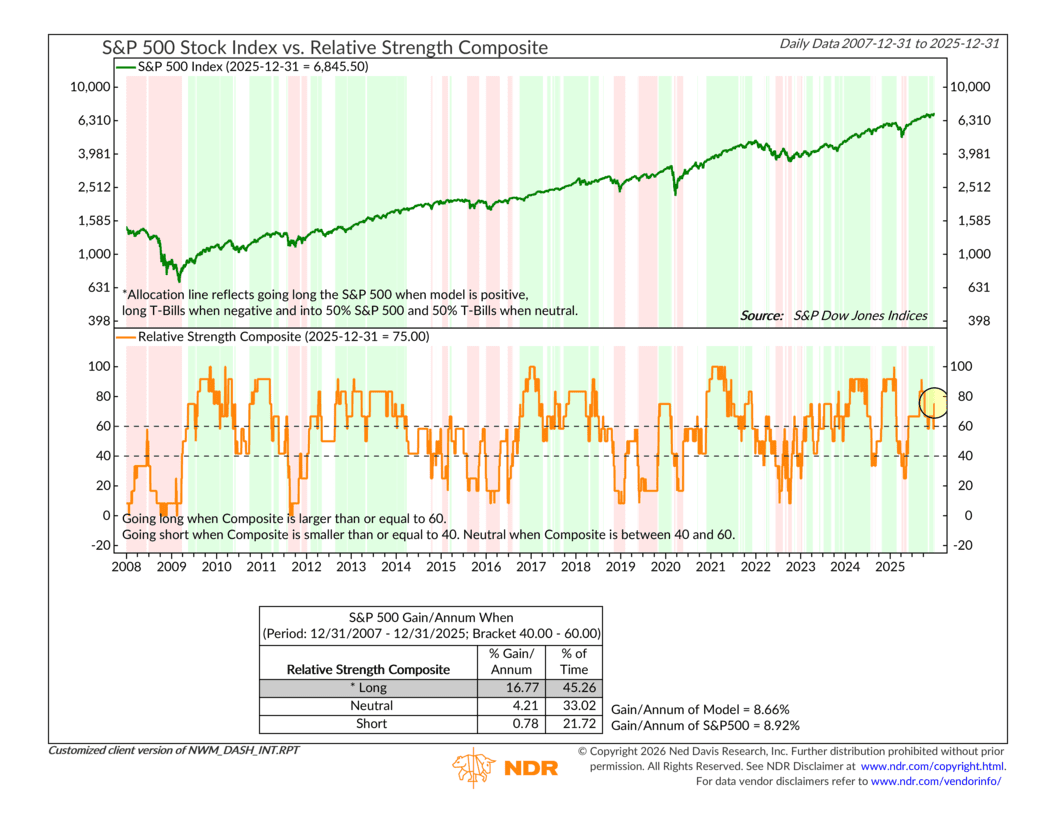
To begin with, relative strength has improved in favor of stocks. Our Stock/Bond Trend Model, which combines several trend and momentum indicators based on the stock-to-bond ratio, has climbed to a 75% bullish reading for equities. That improvement has helped push our broader Relative Strength Composite, shown below, back into bullish territory.
That covers the technical, or price-based, side of the picture. But at the same time, there are signs that the market is becoming a bit stretched in the short term. As the next chart shows, the S&P 500 is pressing against the upper end of its 25-day moving average range, an area that has historically been associated with more modest near-term returns.
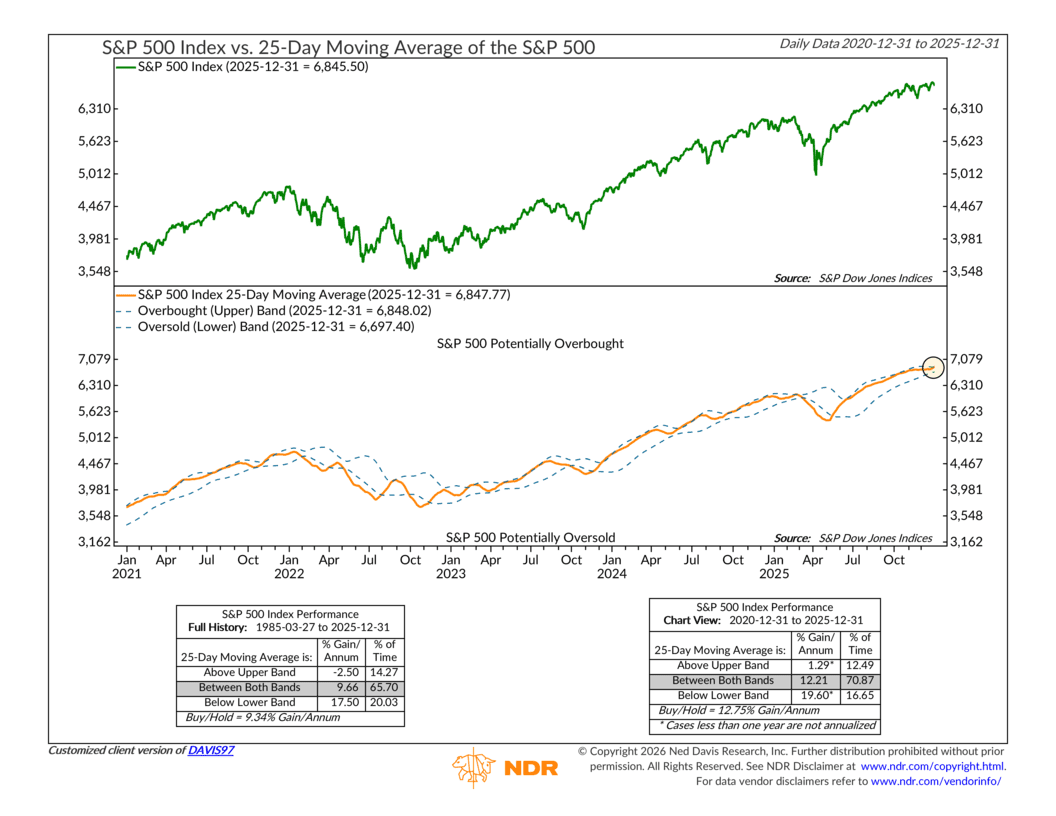
In plain English, the market is somewhat overbought. That does not mean a major top is in place, but it does suggest that some digestion would be normal after a strong advance. Environments like this often lead to sideways movement or shallow pullbacks rather than outright trend breaks.
Putting it all together, the message is fairly balanced. Intermediate- and longer-term trends remain supportive of equities, while shorter-term conditions call for a bit of patience.
This tension between time frames is creating some friction in our overall stock market risk model. But for now, we are letting the market do the talking and waiting for confirmation before making any meaningful adjustments.
This is intended for informational purposes only and should not be used as the primary basis for an investment decision. Consult an advisor for your personal situation.
Indices mentioned are unmanaged, do not incur fees, and cannot be invested into directly.
Past performance does not guarantee future results.
The S&P 500 Index, or Standard & Poor’s 500 Index, is a market-capitalization-weighted index of 500 leading publicly traded companies in the U.S.
The Dow Jones Industrial Average (DJIA) is a price-weighted index composed of 30 widely traded blue-chip U.S. common stocks. The Nasdaq 100 Index is a basket of the 100 largest, most actively traded U.S. companies listed on the Nasdaq stock exchange. The index includes companies from various industries except for the financial industry, like commercial and investment banks. The Russell 3000 Index is a capitalization-weighted stock market index that seeks to be a benchmark of the entire U.S. stock market. The S&P MidCap 400 is designed to measure the performance of 400 mid-sized companies, reflecting the distinctive risk and return characteristics of this market segment. S&P 600 Index measures the small-cap segment of the U.S. equity market. The index is designed to track companies that meet specific inclusion criteria to ensure that they are liquid and financially viable. The S&P 100 index is a capitalization-weighted index based on 100 highly capitalized stocks for which options are listed on the CBOE (Chicago Board of Exchange). The MSCI EAFE Index is an equity index which captures large and mid cap representation across 21 Developed Markets countries* around the world, excluding the US and Canada.
The Bloomberg U.S. Corporate Bond Index measures the investment grade, fixed-rate, taxable corporate bond market. The Bloomberg U.S. Corporate High Yield Index is comprised of domestic and corporate bonds rated Ba and below with a minimum outstanding amount of $150 million. The Bloomberg U.S. Municipal Index covers the USD-denominated long-term tax exempt bond market. The index has four main sectors: state and local general obligation bonds, revenue bonds, insured bonds and prerefunded bonds.