OVERVIEW
Markets finished the week on softer footing, with broad declines across most equity benchmarks. The S&P 500 fell 1.60%, the Dow Jones Industrials dropped 1.99%, and the NASDAQ declined 1.26%. Large-cap stocks overall were under pressure, with the S&P 100 down 1.65% for the week. Year to date, returns remain mixed. The S&P 500 is now down 3.12% in 2026, while the NASDAQ has slipped further into negative territory at -4.89%.
KEY CONSIDERATIONS
Cushioning the Ride – The market continued to digest the war in the Middle East and the spike in oil prices last week, and for the most part it didn’t really like what it saw.
Now, to be fair, the sell-off in the broader market indexes has been relatively mild so far. As of this writing, the S&P 500 is just about 5% off its all-time high.
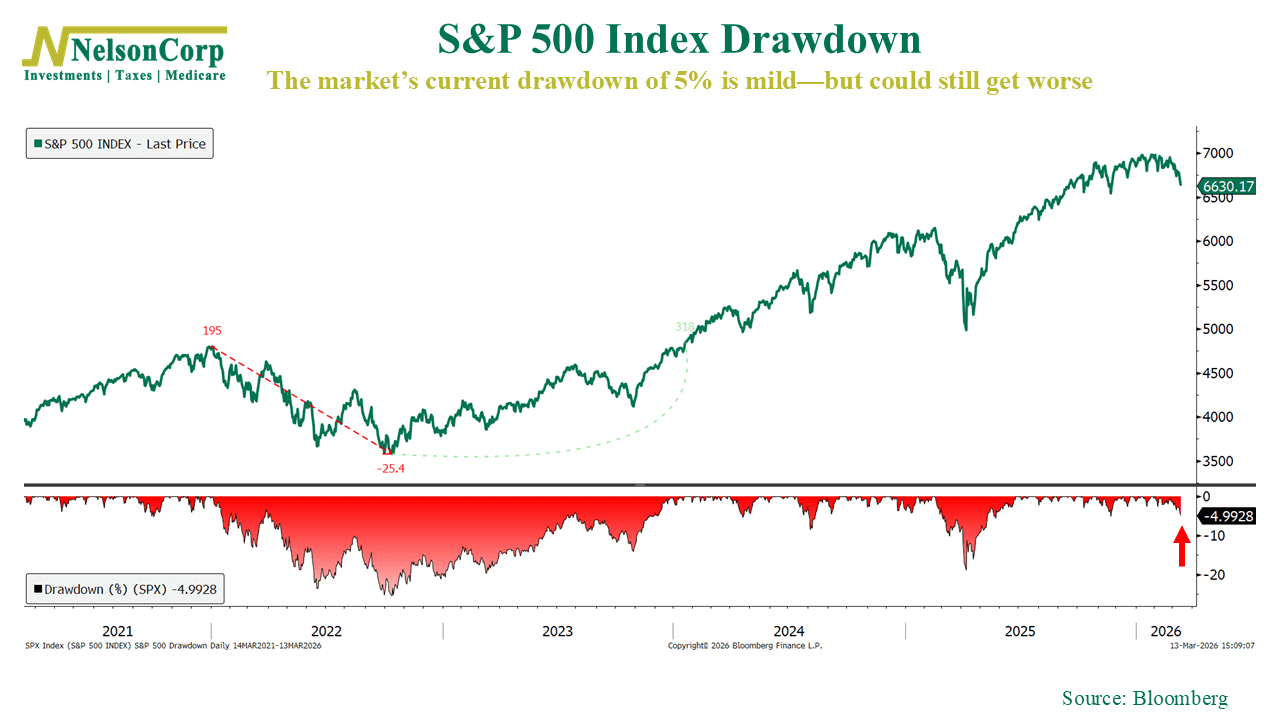
But we also haven’t seen a correction, defined as a decline of 10% or more from highs, in nearly a year now. I’m not saying we’re “due,” because the market doesn’t really work like that, but it is something to keep in mind.
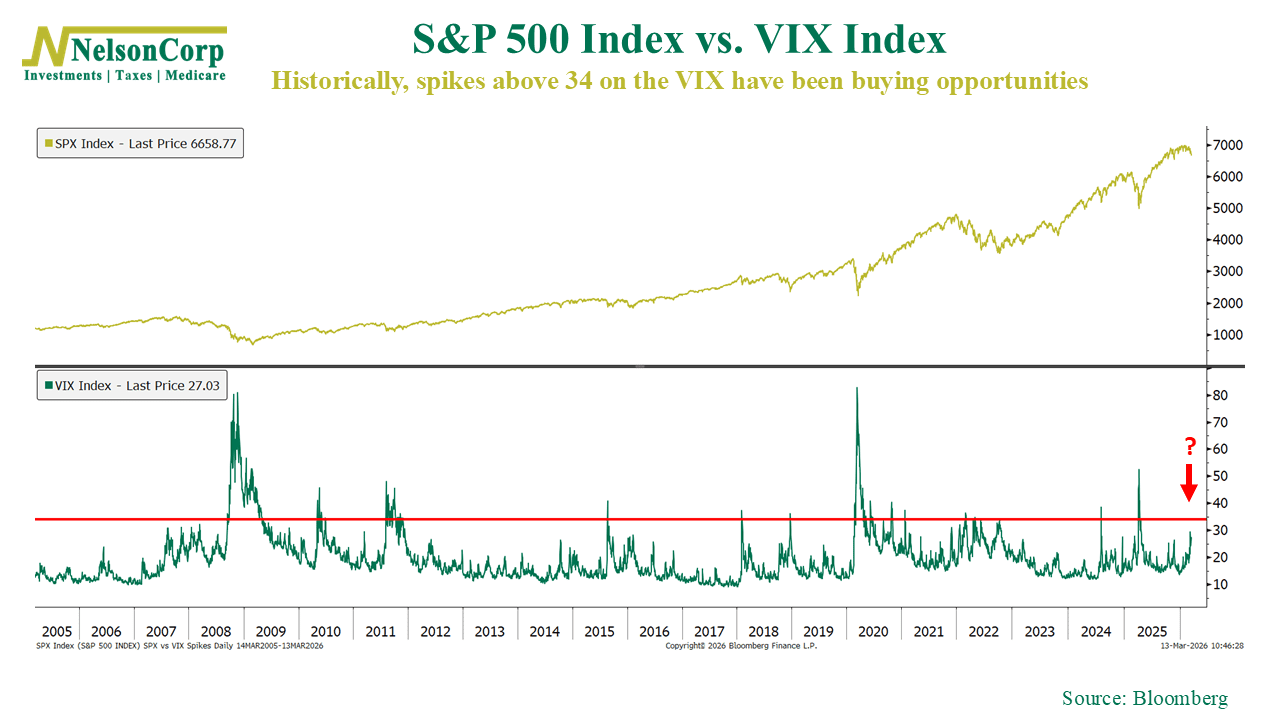
One thing’s for certain, though. Expected volatility has definitely picked up recently. The VIX Index, often called Wall Street’s “Fear Gauge,” is fairly elevated right now, sitting around 27 as of last Friday’s close. But as we discussed in this week’s Chart of the Week, VIX spikes above 34 are typically where the real selling capitulation and “peak fear” tends to happen. So it’s possible we could still see some additional market weakness before things settle down.
As for our risk models, they’ve been sniffing out market weakness for several weeks now. I’ve discussed this in past commentaries, but last week we finally got the sell signal we were waiting for from one of our key momentum indicators, the 85-day stochastic, shown below.
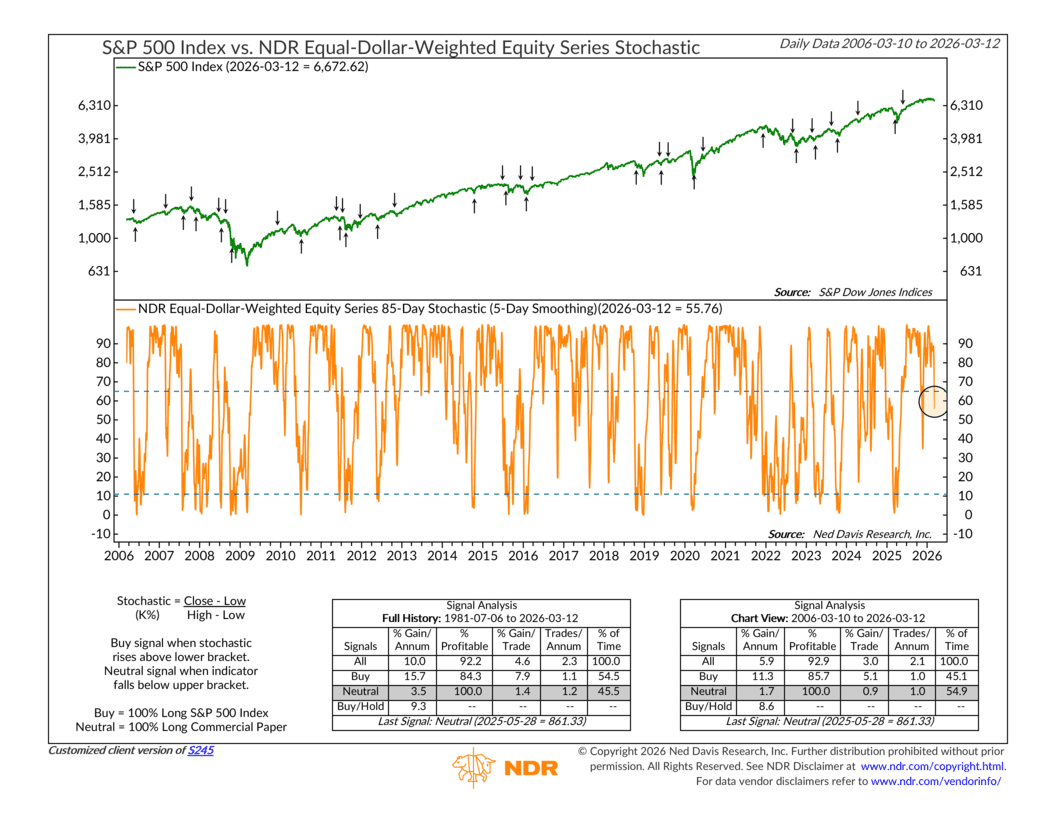
When this indicator falls below its upper bracket, like it did last week, it’s usually a sign that the market may experience some downside momentum until one of two things happens. Either the market reverses course fairly quickly and effectively neutralizes the signal, or prices continue to drift lower until they reach oversold levels near the lower bracket before finally stabilizing.
Right now, though, it’s still too early in this pullback to know exactly what kind of downturn we might be in for. Our risk models have led us to adjust exposure accordingly, but we’ll continue to watch the indicators closely for signs that something more serious could be developing.
One area we’re paying particularly close attention to is credit spreads. This refers to the difference between yields on high-yield bonds, which carry more risk, and safer U.S. Treasury bonds. At the moment, that spread sits around 286 basis points and has been moving higher.
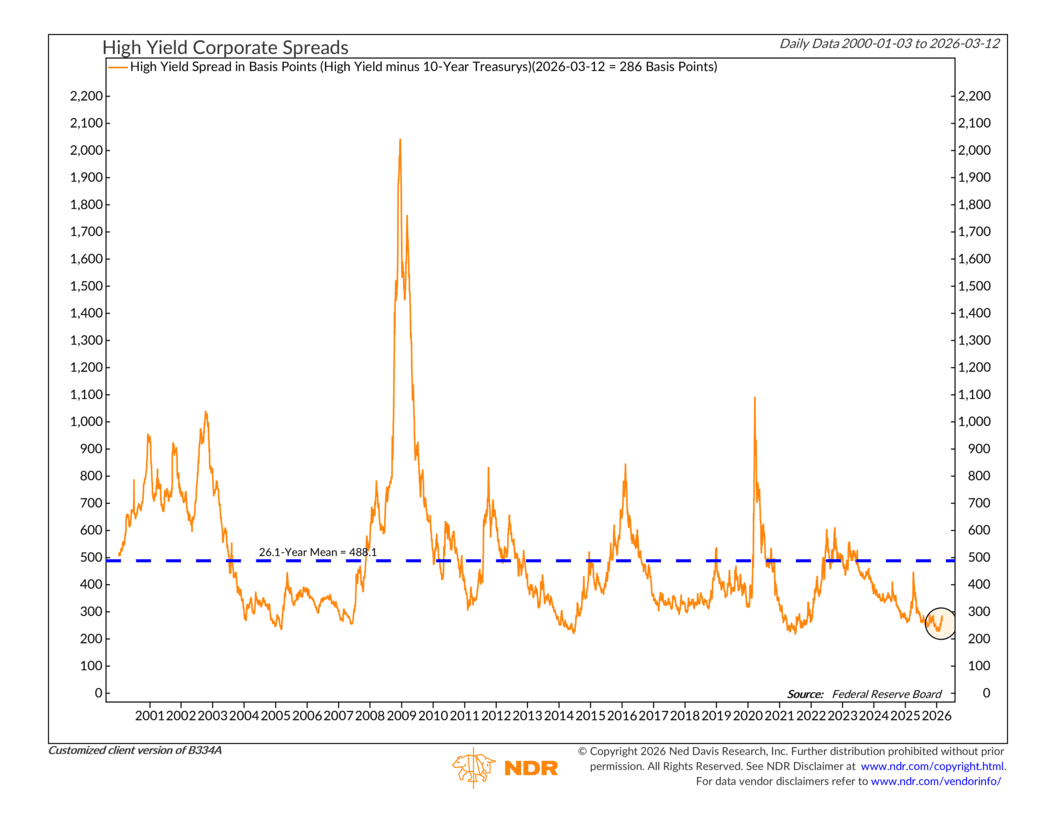
Fortunately, those widening spreads are coming off historically low levels. But if they continue to widen from here, and especially if they push above the long-term average of about 488 basis points, that would suggest financial conditions are tightening in a way that could eventually create bigger problems for both the economy and the stock market.
So what’s the bottom line?
The evidence has weakened enough that our modeling suggests a more defensive stance. Momentum has rolled over, volatility has picked up, and several of our indicators have shifted in a less favorable direction.
At the same time, the market has not yet reached the kind of extremes that typically mark major turning points. That means the current environment could still evolve in a few different directions.
For now, the key is staying disciplined and letting the indicators guide the next move. If conditions stabilize, we’ll be ready to lean back into risk. But if the pressure continues to build, the more defensive positioning should help cushion the ride in the meantime.
This is intended for informational purposes only and should not be used as the primary basis for an investment decision. Consult an advisor for your personal situation.
Indices mentioned are unmanaged, do not incur fees, and cannot be invested into directly.
Past performance does not guarantee future results.
The S&P 500 Index, or Standard & Poor’s 500 Index, is a market-capitalization-weighted index of 500 leading publicly traded companies in the U.S.
The Dow Jones Industrial Average (DJIA) is a price-weighted index composed of 30 widely traded blue-chip U.S. common stocks. The Nasdaq 100 Index is a basket of the 100 largest, most actively traded U.S. companies listed on the Nasdaq stock exchange. The index includes companies from various industries except for the financial industry, like commercial and investment banks. The Russell 3000 Index is a capitalization-weighted stock market index that seeks to be a benchmark of the entire U.S. stock market. The S&P MidCap 400 is designed to measure the performance of 400 mid-sized companies, reflecting the distinctive risk and return characteristics of this market segment. S&P 600 Index measures the small-cap segment of the U.S. equity market. The index is designed to track companies that meet specific inclusion criteria to ensure that they are liquid and financially viable. The S&P 100 index is a capitalization-weighted index based on 100 highly capitalized stocks for which options are listed on the CBOE (Chicago Board of Exchange). The MSCI EAFE Index is an equity index which captures large and mid cap representation across 21 Developed Markets countries* around the world, excluding the US and Canada.
The Bloomberg U.S. Corporate Bond Index measures the investment grade, fixed-rate, taxable corporate bond market. The Bloomberg U.S. Corporate High Yield Index is comprised of domestic and corporate bonds rated Ba and below with a minimum outstanding amount of $150 million. The Bloomberg U.S. Municipal Index covers the USD-denominated long-term tax exempt bond market. The index has four main sectors: state and local general obligation bonds, revenue bonds, insured bonds and prerefunded bonds.