OVERVIEW
Markets pulled back modestly during the week, with mixed results across major asset classes. Large-cap U.S. equities were under mild pressure, as the S&P 500 declined 0.38% and the NASDAQ fell 0.66%. The Dow Jones Industrial Average slipped 0.29%, while the S&P 100 dropped 0.91%, reflecting continued weakness in the largest growth-oriented names.
Beneath the surface, leadership looked very different. Mid- and small-cap stocks outperformed meaningfully, with the S&P 400 gaining 1.33% and the S&P 600 rising 1.69%. Within the Russell 3000, value stocks advanced 0.72% while growth stocks fell 1.05%, reinforcing the recent shift away from large-cap growth leadership and toward broader participation.
International equities were a bright spot. Developed international markets gained 1.39% on the week, while emerging markets rose 2.25%, continuing their strong start to the year and extending relative strength versus U.S. equities.
Fixed income results were mixed. Short-term Treasuries posted small gains, while intermediate- and long-term Treasuries finished modestly lower. Credit-sensitive areas were relatively stable, with high-yield bonds edging higher and investment-grade bonds essentially flat, reflecting a steady risk backdrop despite equity volatility.
Commodities provided notable support. Real assets led the way, with real estate up 3.52% and MLPs gaining 3.34%. Broad commodities advanced 1.31%, driven by strength in oil and gold, with gold rising 2.55% on the week. Corn was a notable laggard, declining sharply.
Volatility moved higher, with the VIX rising 9.45% on the week and ending at 14.49. While volatility picked up, overall levels remain consistent with a market experiencing rotation and consolidation rather than broad-based stress.
KEY CONSIDERATIONS
Deep Bench – There’s been a lot of noise in the marketplace to start the new year. A lot going on. A lot of stuff that, on the surface, seems like it could derail this bull market in stocks. And yet, U.S. markets have remained largely unaffected by the news cycle so far.
What’s contributing to this resilience? I have two charts this week that I think do a good job of explaining it, and they both have to do with market breadth.
Breadth, as a reminder, can be thought of as participation. Or, since we’re in the middle of basketball season, it’s like having a deep bench. How many reliable players do you have available to help you win the game?
There are plenty of ways to measure this, but one simple approach is to look at the sectors that make up the S&P 500 itself. How many of those sectors are actually pulling their weight and contributing to the rally?
The first chart answers that question by showing the percentage of S&P 500 sectors that are within 5% of a record high, smoothed over 10 days.
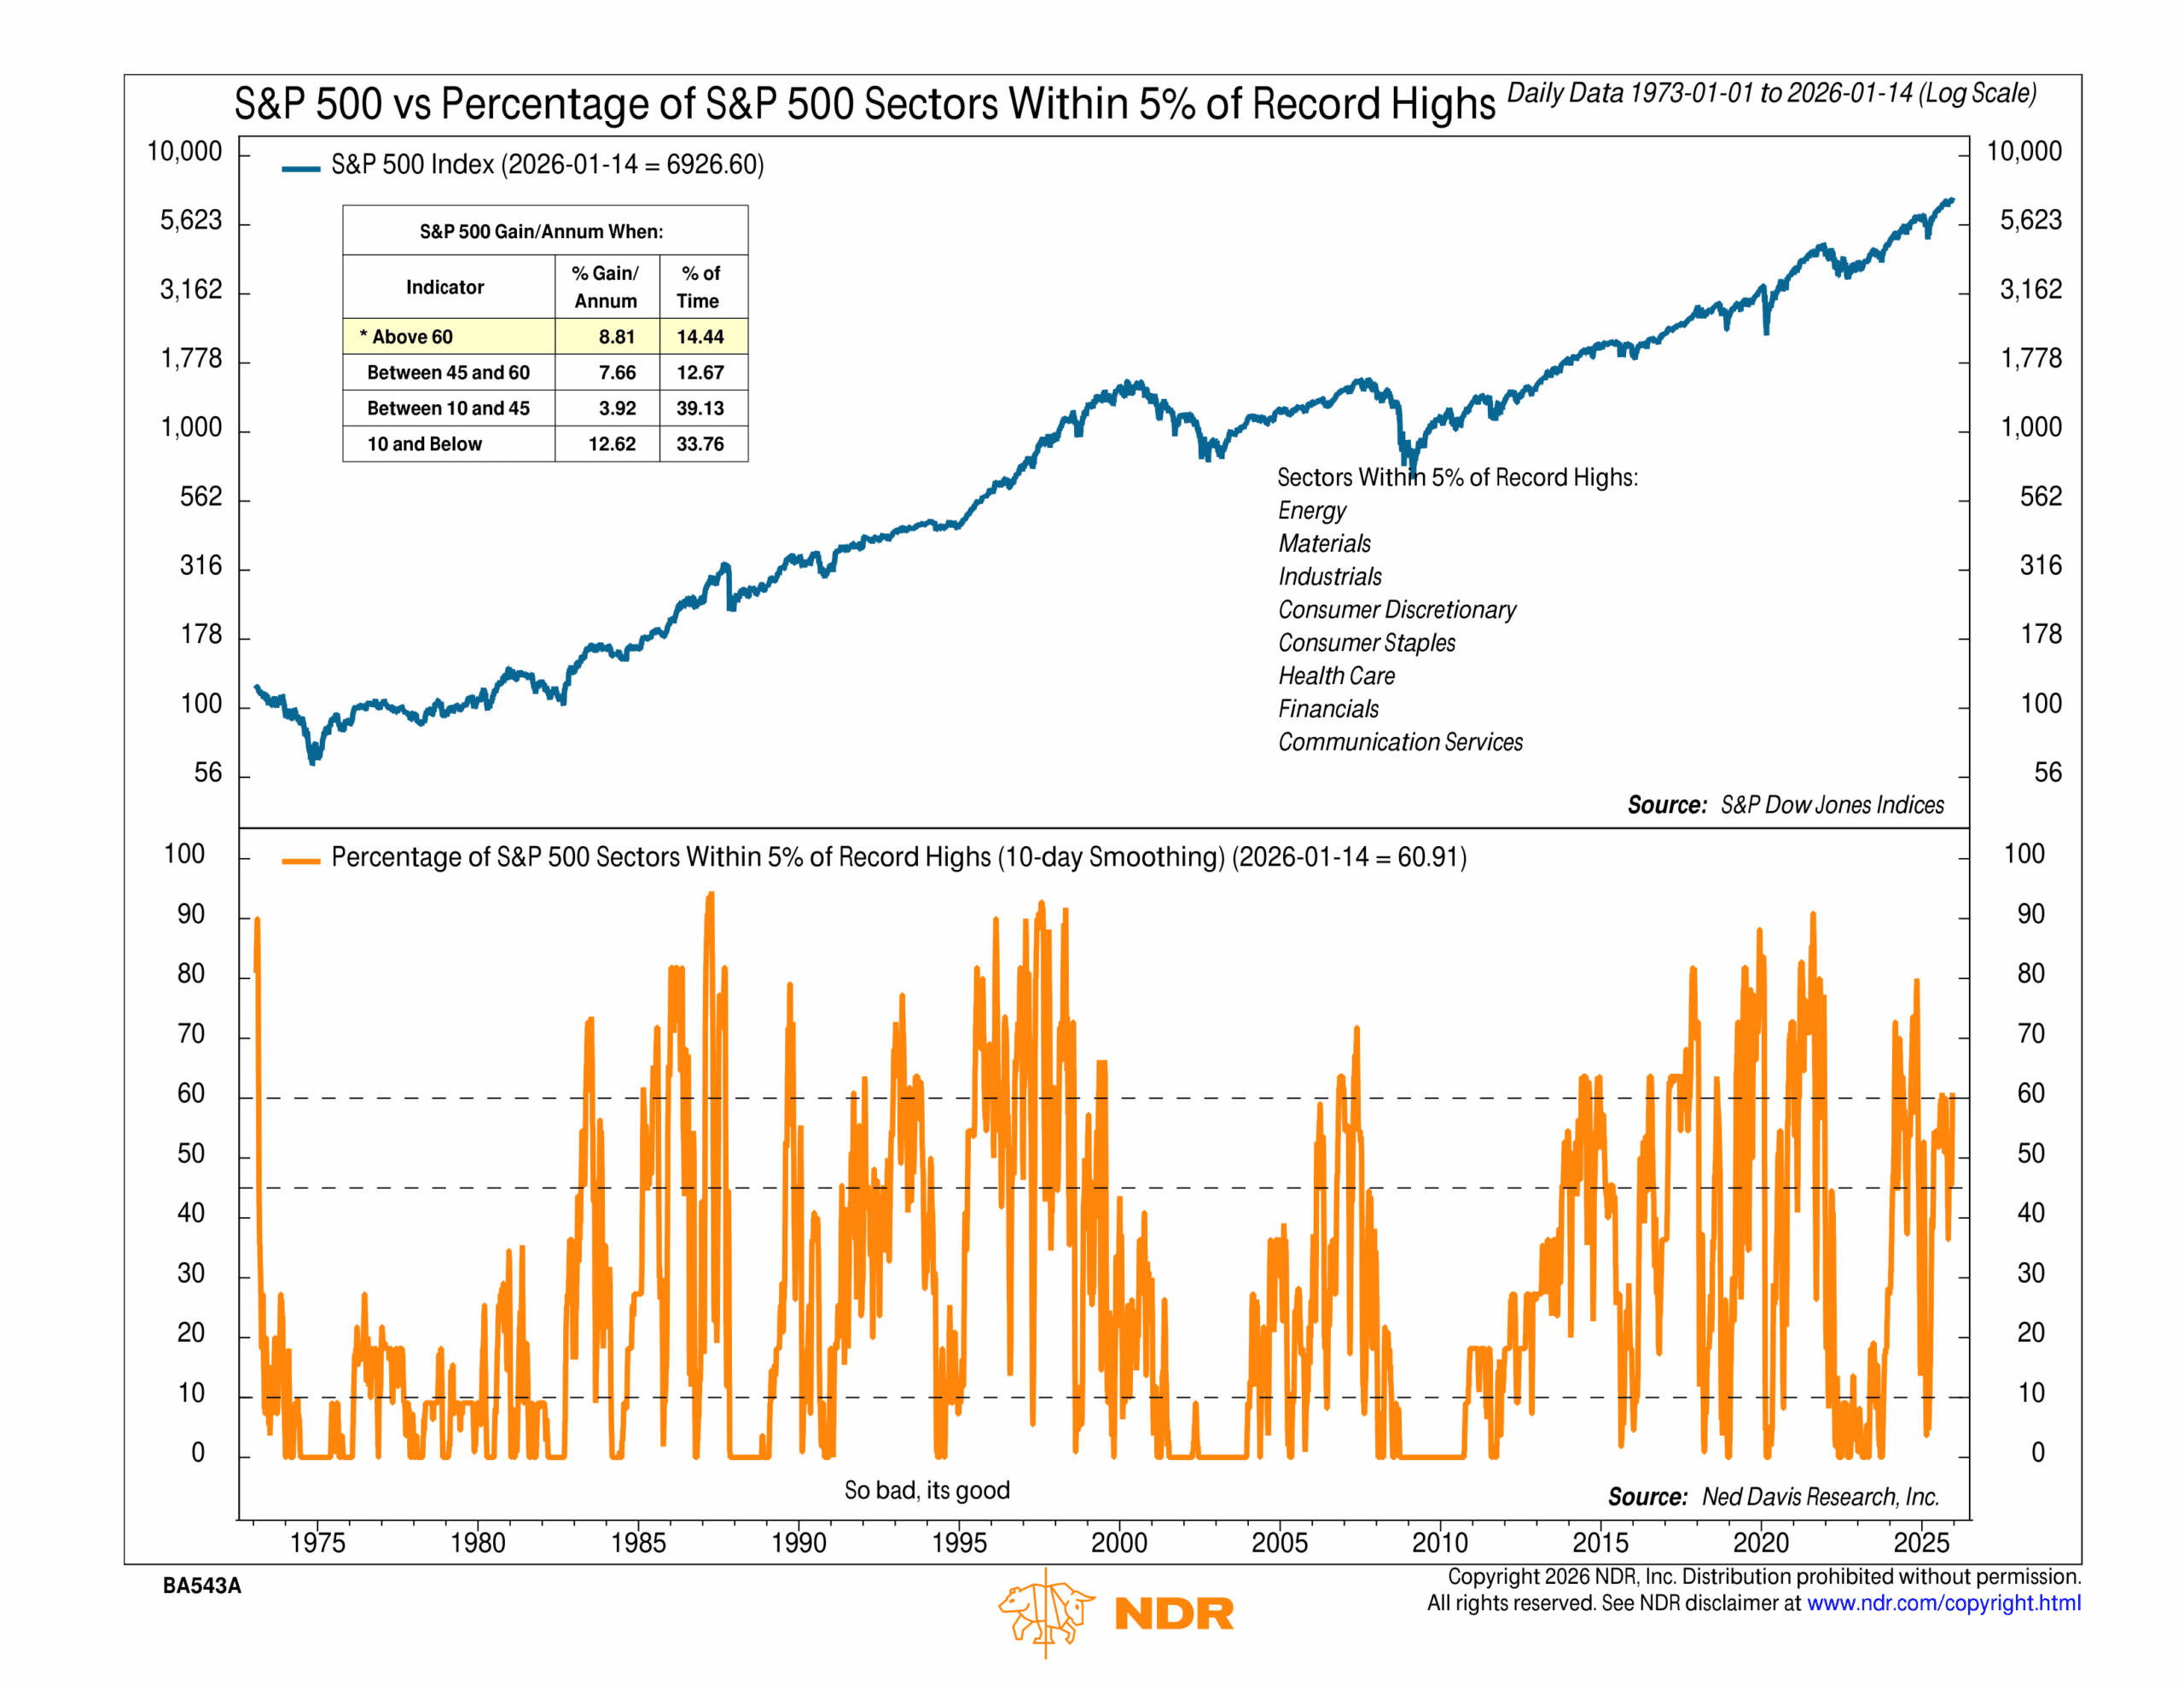
Right now, that figure sits around 61%, which works out to eight sectors. That’s a healthy number. As the performance box at the top of the chart shows, when at least that many sectors are participating, the overall index has gone on to produce an average annualized gain of nearly 9%. That’s the second-best return bucket for this indicator. The only scenario with better returns is when fewer than 10% of sectors are near highs, and that’s typically because markets are so oversold that forward returns improve from deeply depressed levels.
So that covers the sector level. But what about individual stocks inside the index? Are they keeping pace as well?
The answer is yes. And in a big way.
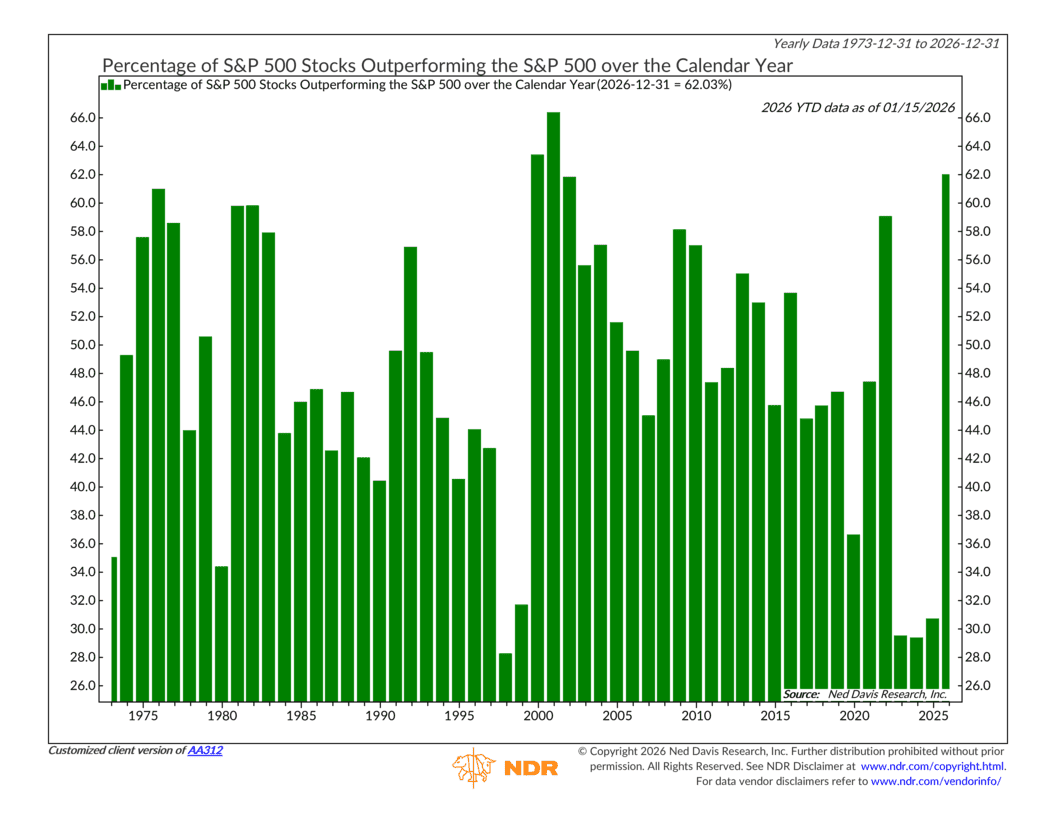
The second chart shows the percentage of stocks that have outperformed the S&P 500 over the past calendar year. That number has surged to roughly 62%. That’s a lot! We haven’t seen breadth expand by this magnitude in about 25 years.
So, the takeaway here is simple. When more stocks and more sectors are participating, the market becomes harder to knock over. Leadership broadens. Risk gets spread out. And while that doesn’t eliminate pullbacks or short-term volatility, it does help explain why this market has been able to absorb a steady stream of headlines without losing its footing.
This is intended for informational purposes only and should not be used as the primary basis for an investment decision. Consult an advisor for your personal situation.
Indices mentioned are unmanaged, do not incur fees, and cannot be invested into directly.
Past performance does not guarantee future results.
The S&P 500 Index, or Standard & Poor’s 500 Index, is a market-capitalization-weighted index of 500 leading publicly traded companies in the U.S.
The Dow Jones Industrial Average (DJIA) is a price-weighted index composed of 30 widely traded blue-chip U.S. common stocks. The Nasdaq 100 Index is a basket of the 100 largest, most actively traded U.S. companies listed on the Nasdaq stock exchange. The index includes companies from various industries except for the financial industry, like commercial and investment banks. The Russell 3000 Index is a capitalization-weighted stock market index that seeks to be a benchmark of the entire U.S. stock market. The S&P MidCap 400 is designed to measure the performance of 400 mid-sized companies, reflecting the distinctive risk and return characteristics of this market segment. S&P 600 Index measures the small-cap segment of the U.S. equity market. The index is designed to track companies that meet specific inclusion criteria to ensure that they are liquid and financially viable. The S&P 100 index is a capitalization-weighted index based on 100 highly capitalized stocks for which options are listed on the CBOE (Chicago Board of Exchange). The MSCI EAFE Index is an equity index which captures large and mid cap representation across 21 Developed Markets countries* around the world, excluding the US and Canada.
The Bloomberg U.S. Corporate Bond Index measures the investment grade, fixed-rate, taxable corporate bond market. The Bloomberg U.S. Corporate High Yield Index is comprised of domestic and corporate bonds rated Ba and below with a minimum outstanding amount of $150 million. The Bloomberg U.S. Municipal Index covers the USD-denominated long-term tax exempt bond market. The index has four main sectors: state and local general obligation bonds, revenue bonds, insured bonds and prerefunded bonds.