OVERVIEW
Markets opened the new year on a constructive note, with broad-based gains across most major asset classes. U.S. equities moved higher, led by cyclical and value-oriented areas. The Dow Jones Industrial Average rose 2.32% on the week, while the S&P 500 gained 1.57%. The NASDAQ added 1.88%, and the S&P 100 advanced 1.07%, showing steady participation among large-cap stocks.
Leadership broadened meaningfully beneath the surface. Mid- and small-cap stocks outperformed, with the S&P 400 up 3.30% and the S&P 600 climbing 4.13%. Within the Russell 3000, value stocks led the way, rising 2.63% versus a 1.03% gain for growth, a sign that market participation is extending beyond the largest growth names.
International equities also contributed positively. Developed international stocks gained 1.41%, while emerging markets rose 1.60% for the week. Early-year performance continues to favor non-U.S. equities relative to domestic markets.
Fixed income posted modest but broadly positive returns. Treasury bonds advanced across most maturities, with long-term Treasuries leading. Investment-grade bonds, high-yield bonds, and municipal bonds all finished the week higher, providing stability alongside equity gains.
Commodities were a source of strength. Broad commodity prices rose 2.39%, supported by gains in oil and a strong move higher in gold, which advanced over 4% on the week. The U.S. dollar also moved modestly higher.
Volatility remained contained, with the VIX ending the week at 14.49, consistent with a relatively calm and orderly market environment.
KEY CONSIDERATIONS
Evidence From the Bull Pen – Wall Street loves to use animal terms to describe markets. You probably know what I’m talking about. Long before computers, charts, and real-time data feeds, markets were described using these two famous terms: Bulls and bears. One charges forward, the other swipes downward. Bullish is positive, bearish is negative. Over time, those images stuck, and we still use them today.
But of course, a bull market isn’t just about prices going up. It’s a mood change. Participation improves. Trends align. Risk appetite slowly returns. It tends to happen gradually, and it often shows up in pieces, sometimes before investors even feel comfortable acting on them.
As we begin the new year, that’s exactly what we’re seeing. A growing number of indicators are starting to lean in a more positive direction. Nothing extreme. Nothing euphoric. But enough of a subtle change to get our attention.
Here’s a big one. The following chart is an indicator that we call the Global Big Mo Tape Composite. It basically takes a bunch of individual trend and momentum indicators from 43 different countries and combines them into one reading.
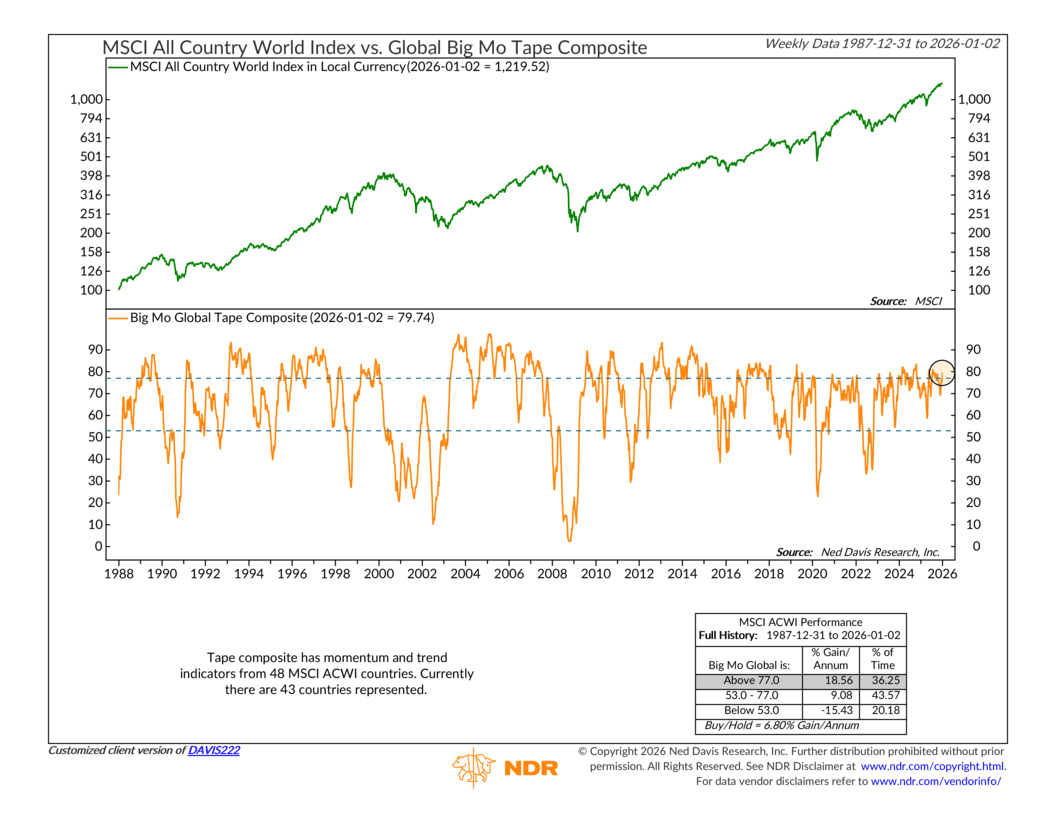
The idea is that since mega-moves tend to be global in nature, this model should be capable of calling U.S. markets (the S&P 500)—as well as the All-Country World Index.
And indeed, it does a good job of doing just that. Historically, when the indicator has been more than 77% bullish (above the upper dashed line), the MSCI ACWI has returned roughly 18.6% on a local currency basis. U.S. returns have been just a good.
And, well, as you can see from the chart, this indicator popped up to nearly 80% last week. This was a key development in our primary stock market risk model, as this was the push the model needed to finally get it over the hump and into bullish territory.
Another indicator worth highlighting adds further support to this improving backdrop. The chart below shows the NDR Supply and Demand indicator, which compares buying pressure to selling pressure in the S&P 500. Think of it as a way to gauge whether demand for stocks is outweighing supply beneath the surface.
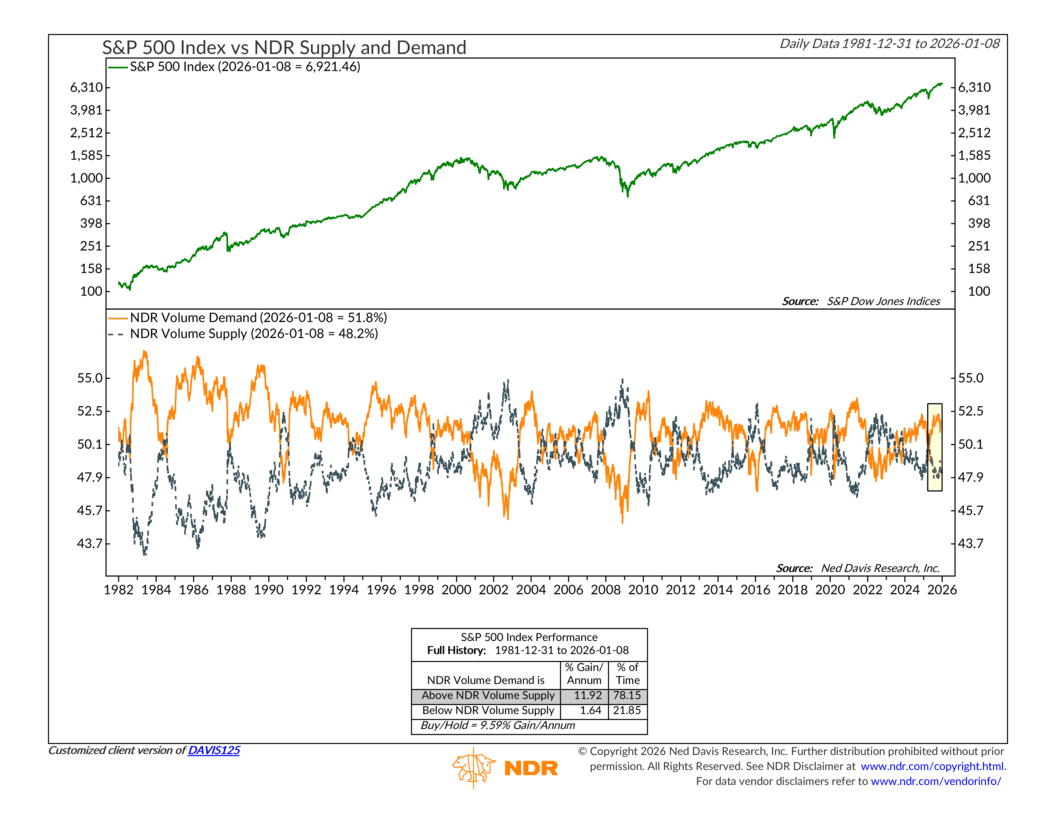
When demand is above supply, markets tend to have a healthier internal structure—and that’s exactly what we see today. Volume demand is around 52% versus about 48% for volume supply. Sure, that’s nothing dramatic, but historically, the S&P 500 has seen much stronger returns when demand is greater than supply.
Taken together, we’d say these indicators point to a market that might just be finding its footing again. The bulls aren’t charging wildly ahead, but they are standing their ground, and that might just be enough to buttress a market with a sturdier foundation than it had just a few months ago.
This is intended for informational purposes only and should not be used as the primary basis for an investment decision. Consult an advisor for your personal situation.
Indices mentioned are unmanaged, do not incur fees, and cannot be invested into directly.
Past performance does not guarantee future results.
The S&P 500 Index, or Standard & Poor’s 500 Index, is a market-capitalization-weighted index of 500 leading publicly traded companies in the U.S.
The Dow Jones Industrial Average (DJIA) is a price-weighted index composed of 30 widely traded blue-chip U.S. common stocks. The Nasdaq 100 Index is a basket of the 100 largest, most actively traded U.S. companies listed on the Nasdaq stock exchange. The index includes companies from various industries except for the financial industry, like commercial and investment banks. The Russell 3000 Index is a capitalization-weighted stock market index that seeks to be a benchmark of the entire U.S. stock market. The S&P MidCap 400 is designed to measure the performance of 400 mid-sized companies, reflecting the distinctive risk and return characteristics of this market segment. S&P 600 Index measures the small-cap segment of the U.S. equity market. The index is designed to track companies that meet specific inclusion criteria to ensure that they are liquid and financially viable. The S&P 100 index is a capitalization-weighted index based on 100 highly capitalized stocks for which options are listed on the CBOE (Chicago Board of Exchange). The MSCI EAFE Index is an equity index which captures large and mid cap representation across 21 Developed Markets countries* around the world, excluding the US and Canada.
The Bloomberg U.S. Corporate Bond Index measures the investment grade, fixed-rate, taxable corporate bond market. The Bloomberg U.S. Corporate High Yield Index is comprised of domestic and corporate bonds rated Ba and below with a minimum outstanding amount of $150 million. The Bloomberg U.S. Municipal Index covers the USD-denominated long-term tax exempt bond market. The index has four main sectors: state and local general obligation bonds, revenue bonds, insured bonds and prerefunded bonds.