OVERVIEW
Markets finished the week broadly higher, with technology once again leading the way. The S&P 500 gained 1.22%, while the Dow added 1.05%. The NASDAQ outpaced both, rising 2.21%. Broad measures were also strong, as the Russell 3000 advanced 1.30%. Growth (+1.97%) extended its lead over value (+0.56%) for the year.
By size, large caps performed best. The S&P 100 rose 1.58%, while mid-caps (S&P 400) were nearly flat at +0.06%. Small caps (S&P 600) delivered a modest 0.98% gain. Overseas, developed markets (EAFE) slipped 0.19%, while emerging markets added 1.15%.
Bonds were more mixed. Short-term Treasuries edged up 0.08%, but intermediate maturities fell 0.24%, and long-term Treasuries dropped 0.98%. Investment-grade corporates slipped 0.13%, though high yield bonds rose 0.34%. Municipals were nearly unchanged at +0.04%.
Commodities had a softer week. Oil rose 0.29%, and gold gained 0.53%, extending its 40% year-to-date surge. Corn dropped 1.40%, while broad commodities declined 0.79%. Real estate (-1.25%) and MLPs (-1.76%) struggled.
The U.S. dollar ticked up 0.15%. Volatility spiked, with the VIX jumping 4.67%.
KEY CONSIDERATIONS
Exhaustion Signal? – It was another positive week for U.S. stocks. You really can’t complain about this type of price action. Volatility is relatively subdued, and the grind higher in equities has been relentless.
Now, when the market is moving higher in this type of fashion, it’s usually because something is streaking. And by streaking I mean something, somewhere in the market is likely doing something at a record pace.
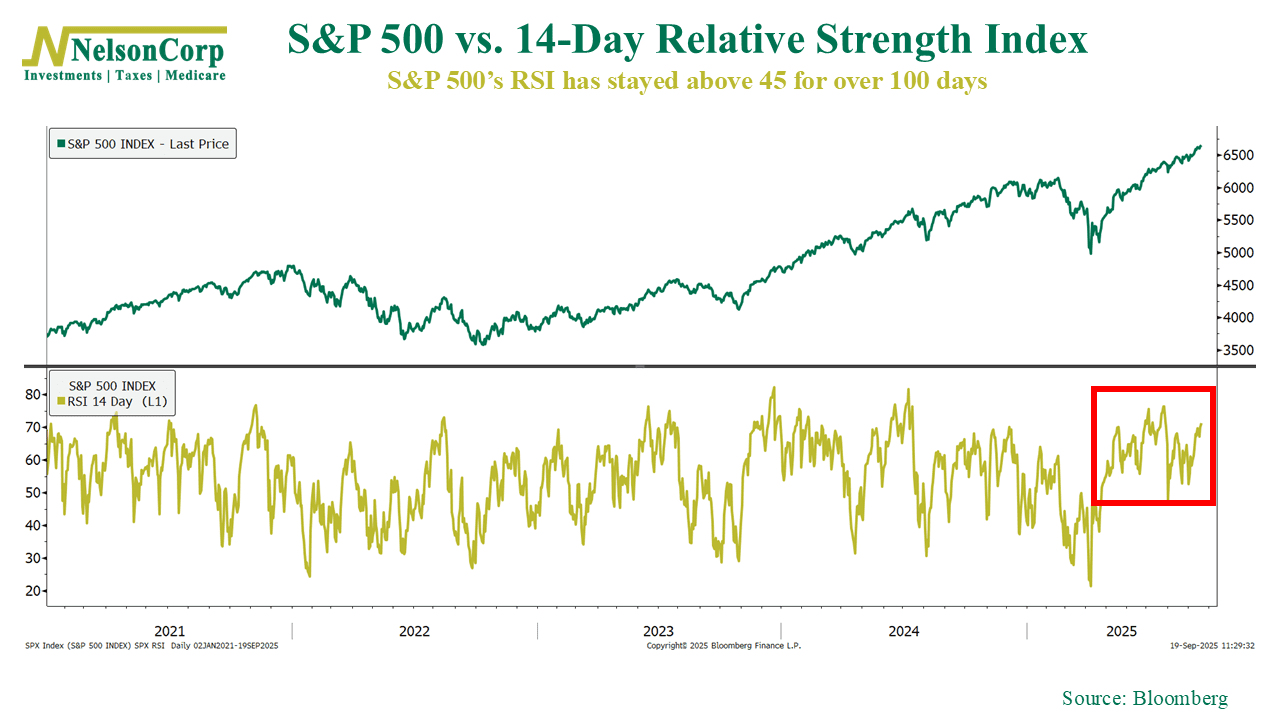
So, I dug into the numbers and found that the market is currently in the middle of one of the longest momentum streaks we’ve ever seen. The metric in this case is the Relative Strength Index (RSI)—a momentum gauge that tracks whether stocks are running hot or cold.
As you can see on the chart below, the S&P 500’s 14-day RSI has stayed above a reading of 45 (bullish territory) for more than 100 straight trading days. That might sound like just some quirky technical footnote, but when we look at the data, we find that it’s been relatively rare over the past 60 years.
As you can see from the data table below, there have been 10 other instances in history when this feat occurred, going back to the 1970s. (Interestingly, half of those have occurred in the past decade).
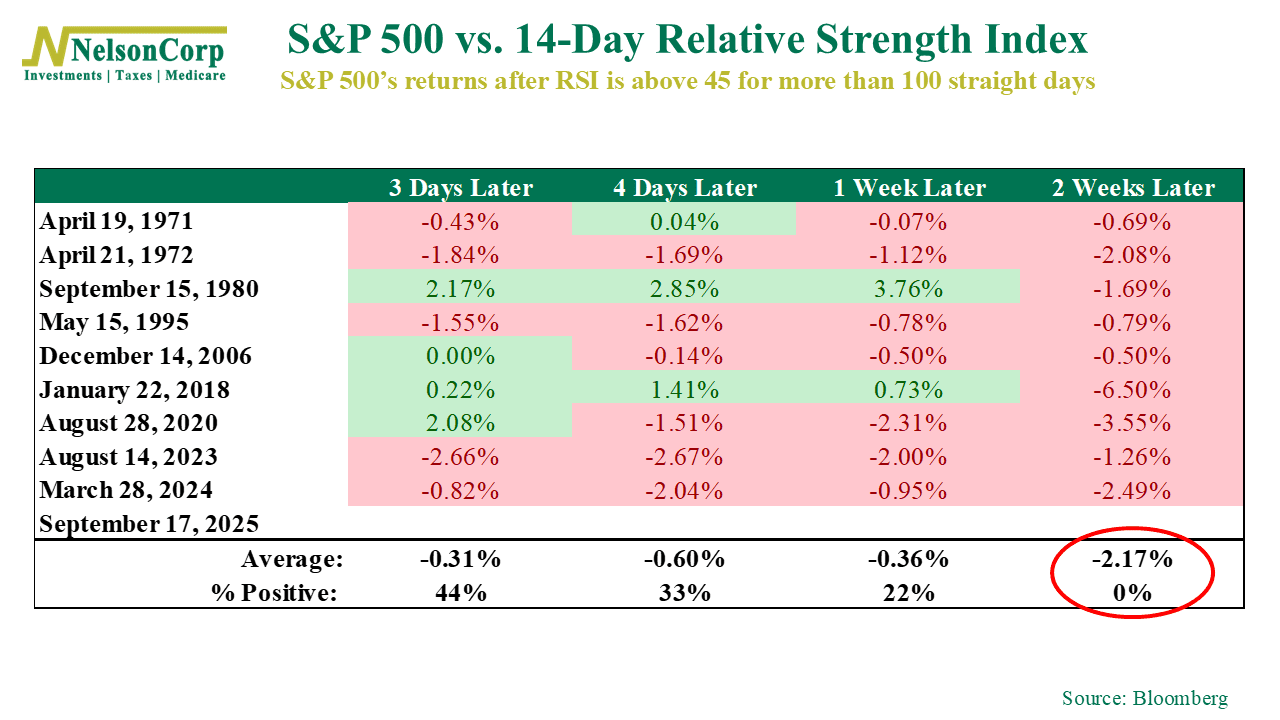
But the most interesting development—and you probably noticed this from the table—is that in every single occurrence the S&P 500 was lower two weeks later. No matter the environment—high inflation of the ‘70s, the dot-com run-up, or even more recent bull markets—the pattern has been the same: short-term pullbacks followed these extended momentum stretches.
On average, the S&P 500 was down about 0.36% after one week, and down approximately 2.17% after two weeks. Only 22% of the time (or two cases) was it actually up one week later.
Does this mean we’re selling out of stocks today? Of course not. There’s nothing really scientific about what I just told you—it’s just an interesting historical observation. But I think it does shine some light on where we are currently in the market cycle.
Stocks have had a pretty nice run in recent months, without much fanfare. But there are some signs that the rally might be getting long in the tooth. We highlighted in this week’s Indicator Insights post that global breadth is no longer bullish from a thrust perspective. And now, we’re seeing signs that momentum—based on the RSI—could ultimately be reaching the end of its runway.
I say all this to point out that while the longer-term trend remains favorable, investors should be mindful of the possibility for short-term turbulence. History suggests these streaks don’t last forever, and when they do finally break, markets often take a breather. That’s not a reason to panic—but it is a reason to stay disciplined, keep expectations in check, and remember that even in strong markets, pullbacks are part of the journey.
This is intended for informational purposes only and should not be used as the primary basis for an investment decision. Consult an advisor for your personal situation.
Indices mentioned are unmanaged, do not incur fees, and cannot be invested into directly.
Past performance does not guarantee future results.
The S&P 500 Index, or Standard & Poor’s 500 Index, is a market-capitalization-weighted index of 500 leading publicly traded companies in the U.S.
The Dow Jones Industrial Average (DJIA) is a price-weighted index composed of 30 widely traded blue-chip U.S. common stocks. The Nasdaq 100 Index is a basket of the 100 largest, most actively traded U.S. companies listed on the Nasdaq stock exchange. The index includes companies from various industries except for the financial industry, like commercial and investment banks. The Russell 3000 Index is a capitalization-weighted stock market index that seeks to be a benchmark of the entire U.S. stock market. The S&P MidCap 400 is designed to measure the performance of 400 mid-sized companies, reflecting the distinctive risk and return characteristics of this market segment. S&P 600 Index measures the small-cap segment of the U.S. equity market. The index is designed to track companies that meet specific inclusion criteria to ensure that they are liquid and financially viable. The S&P 100 index is a capitalization-weighted index based on 100 highly capitalized stocks for which options are listed on the CBOE (Chicago Board of Exchange). The MSCI EAFE Index is an equity index which captures large and mid cap representation across 21 Developed Markets countries* around the world, excluding the US and Canada.
The Bloomberg U.S. Corporate Bond Index measures the investment grade, fixed-rate, taxable corporate bond market. The Bloomberg U.S. Corporate High Yield Index is comprised of domestic and corporate bonds rated Ba and below with a minimum outstanding amount of $150 million. The Bloomberg U.S. Municipal Index covers the USD-denominated long-term tax exempt bond market. The index has four main sectors: state and local general obligation bonds, revenue bonds, insured bonds and prerefunded bonds.