
OVERVIEW
KEY CONSIDERATIONS
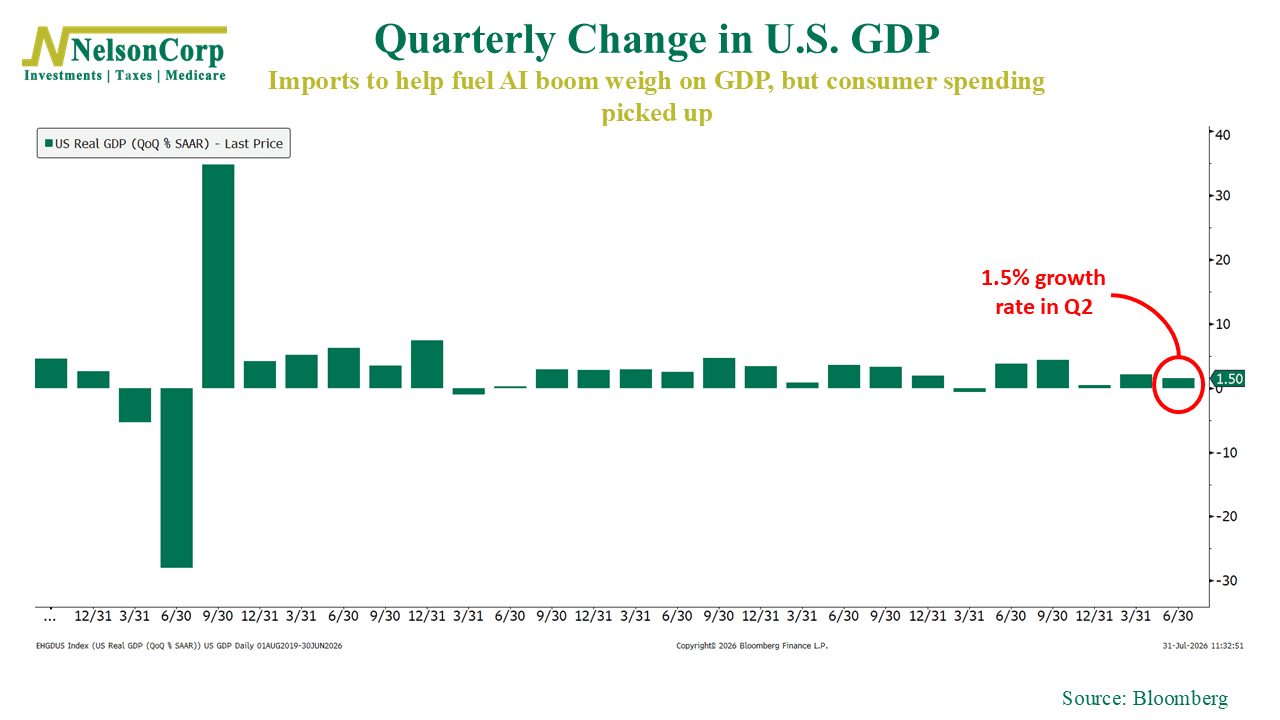
Following the Signals – It was a bit of a mixed week for stocks. Investors continued to digest another busy week of earnings reports and incoming economic data, including the latest GDP report, which showed the economy grew at an annualized rate of 1.5%.
The S&P 500 finished roughly flat. Nothing too unusual there.
But it was a different story in the bond market. Treasury yields climbed following the Federal Reserve’s latest policy meeting. Kevin Warsh, the Fed’s new Chair, outlined the central bank’s updated policy framework, but investors appeared to remain cautious about the outlook for inflation and interest rates.
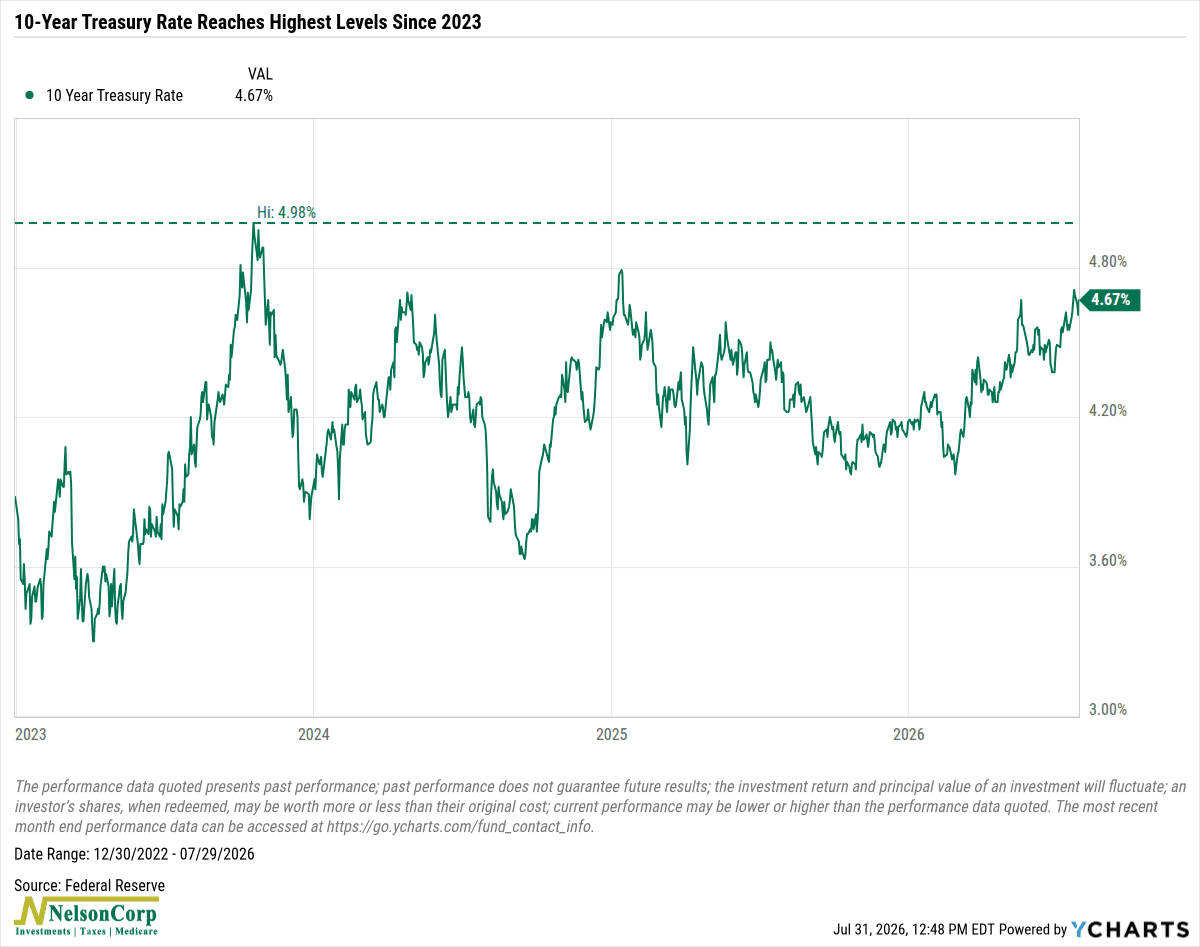
By the end of the week, the 10-year Treasury yield had climbed to roughly 4.7%, around its highest level since 2023.
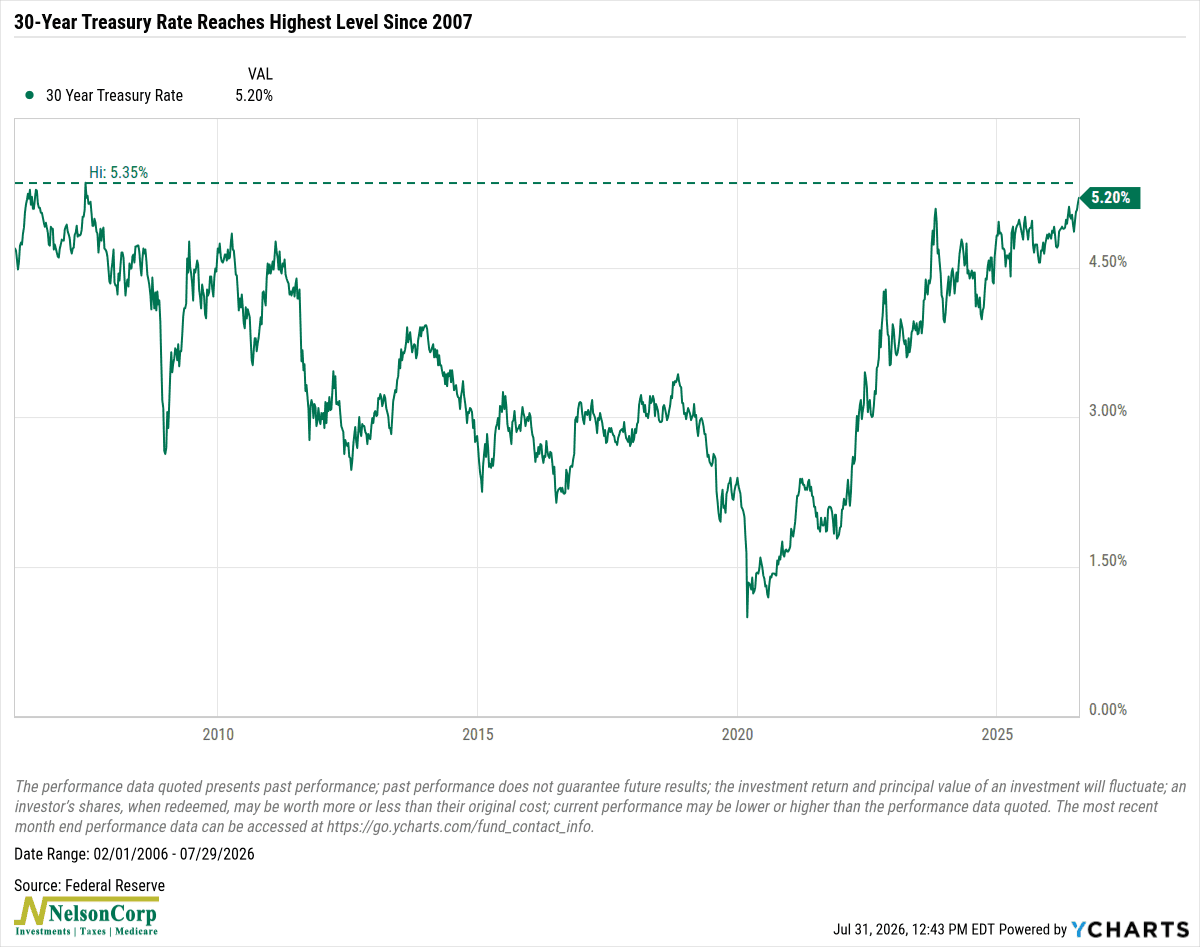
The longer-dated 30-year Treasury yield moved even higher, reaching its highest level since 2007.
That really fits the theme of this week’s newsletter. Inflation remains top of mind for both consumers and bond investors. While long-term inflation expectations remain relatively well anchored—as we discussed in other posts this week—the bond market also appears to be signaling that interest rates may stay higher for longer than many investors had hoped.
Higher rates aren’t necessarily bad news, though. One encouraging development has been a broadening of market leadership. The chart below shows that since the S&P 500 peaked on June 2nd, the Technology sector has lagged while traditionally defensive and value-oriented sectors such as Health Care, Financials, and Consumer Staples have taken the lead.
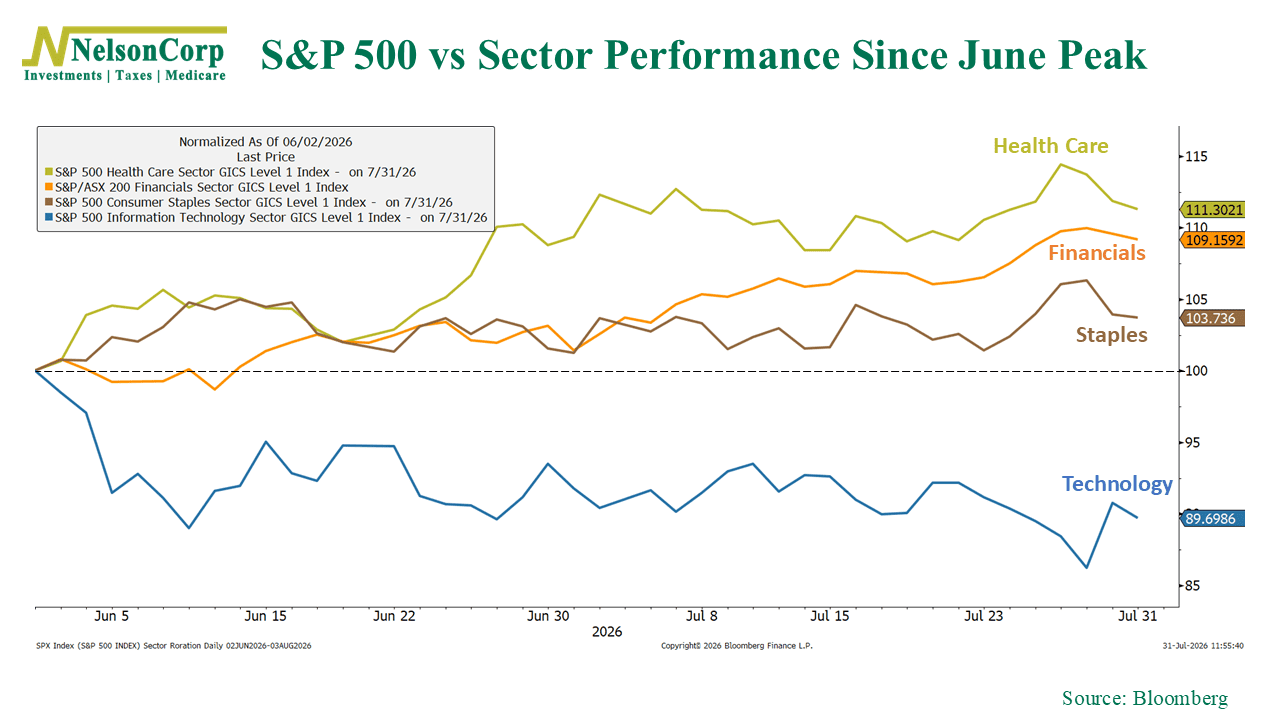
In other words, higher rates haven’t derailed the market—they’ve simply shifted where leadership is coming from. After years of technology dominating returns, seeing more sectors participate in the rally is a healthy development and one we’d generally view as constructive.
The bottom line? While higher interest rates have created new challenges for investors, they’ve also provided valuable information about how markets are adapting to today’s economic environment. We’ll continue following these signals closely because, as always, they’re subject to change. For now, they paint a picture of a market that remains resilient but is still navigating an uncertain path forward.
This is intended for informational purposes only and should not be used as the primary basis for an investment decision. Consult an advisor for your personal situation.
Indices mentioned are unmanaged, do not incur fees, and cannot be invested into directly.
Past performance does not guarantee future results.
The S&P 500 Index, or Standard & Poor’s 500 Index, is a market-capitalization-weighted index of 500 leading publicly traded companies in the U.S.
The Dow Jones Industrial Average (DJIA) is a price-weighted index composed of 30 widely traded blue-chip U.S. common stocks. The Nasdaq 100 Index is a basket of the 100 largest, most actively traded U.S. companies listed on the Nasdaq stock exchange. The index includes companies from various industries except for the financial industry, like commercial and investment banks. The Russell 3000 Index is a capitalization-weighted stock market index that seeks to be a benchmark of the entire U.S. stock market. The S&P MidCap 400 is designed to measure the performance of 400 mid-sized companies, reflecting the distinctive risk and return characteristics of this market segment. S&P 600 Index measures the small-cap segment of the U.S. equity market. The index is designed to track companies that meet specific inclusion criteria to ensure that they are liquid and financially viable. The S&P 100 index is a capitalization-weighted index based on 100 highly capitalized stocks for which options are listed on the CBOE (Chicago Board of Exchange). The MSCI EAFE Index is an equity index which captures large and mid cap representation across 21 Developed Markets countries* around the world, excluding the US and Canada.
The Bloomberg U.S. Corporate Bond Index measures the investment grade, fixed-rate, taxable corporate bond market. The Bloomberg U.S. Corporate High Yield Index is comprised of domestic and corporate bonds rated Ba and below with a minimum outstanding amount of $150 million. The Bloomberg U.S. Municipal Index covers the USD-denominated long-term tax exempt bond market. The index has four main sectors: state and local general obligation bonds, revenue bonds, insured bonds and prerefunded bonds.