OVERVIEW
KEY CONSIDERATIONS
Free Fallin’ – The stock market has been channeling its inner Tom Petty lately. It’s been “free fallin’” for more than a month now. As the chart below shows, the S&P 500 is trading below its 10-day, 20-day, 50-day, and, after last week, even its 200-day moving average.
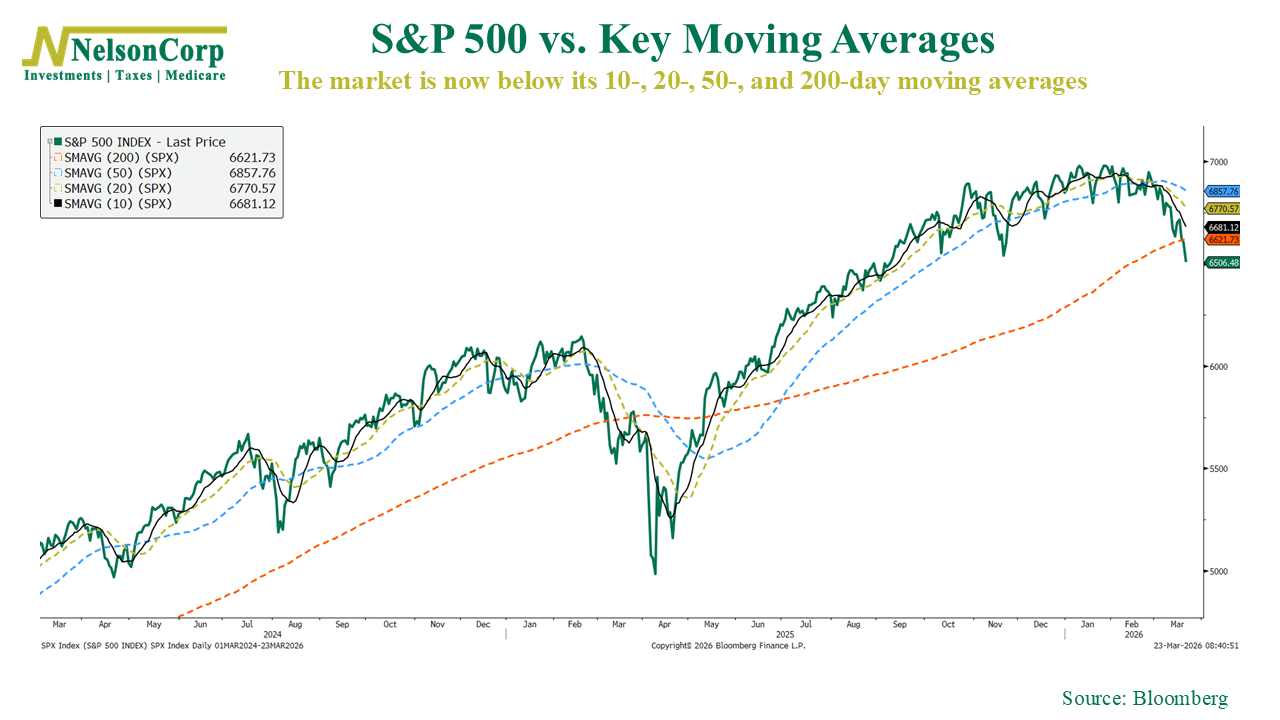
This is what I’d call a trend break. Multiple measures of trend are starting to roll over at the same time.
That said, not every trend indicator has cracked just yet.
Take our Moving Average Slope indicator, for example. This uses the S&P 500’s 126-day moving average as a proxy for the market’s trend. It’s slower than some other examples, but when it rolls over, it tends to be a sign that something has seriously broken in the market.
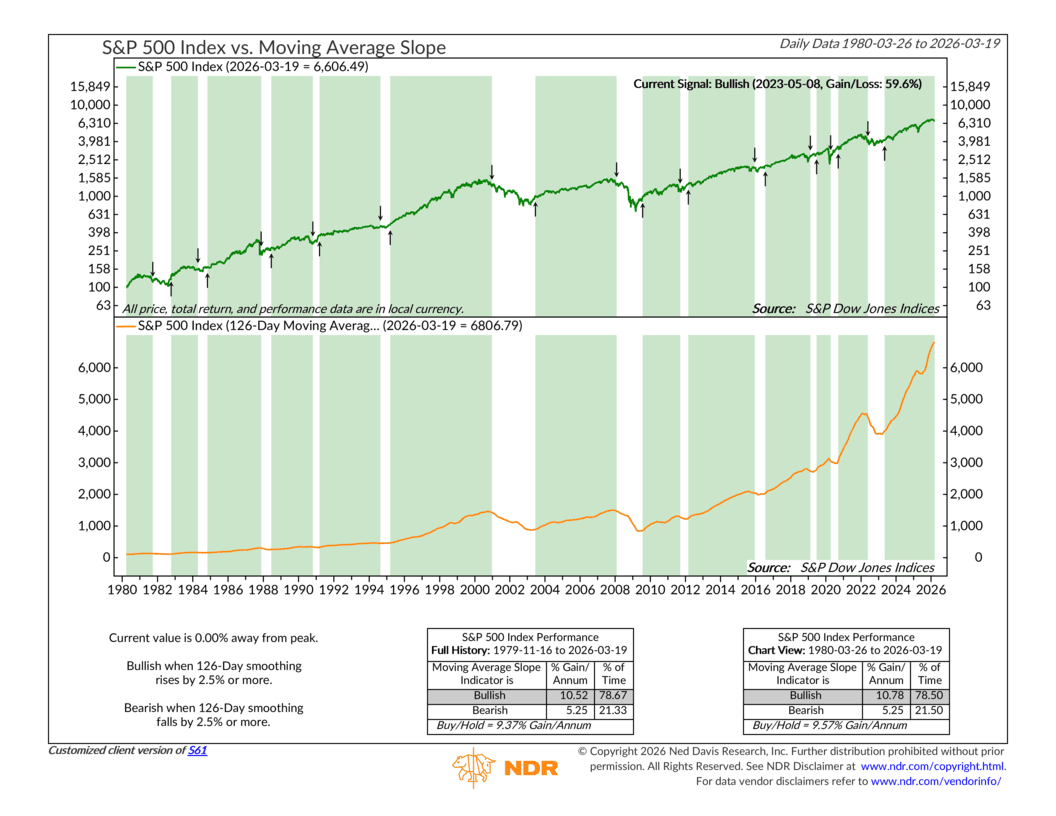
As you can see, it has yet to roll over from all-time highs. The 126-day moving average (orange line) needs to fall 2.5 percentage points from the current peak before a negative trend signal is produced.
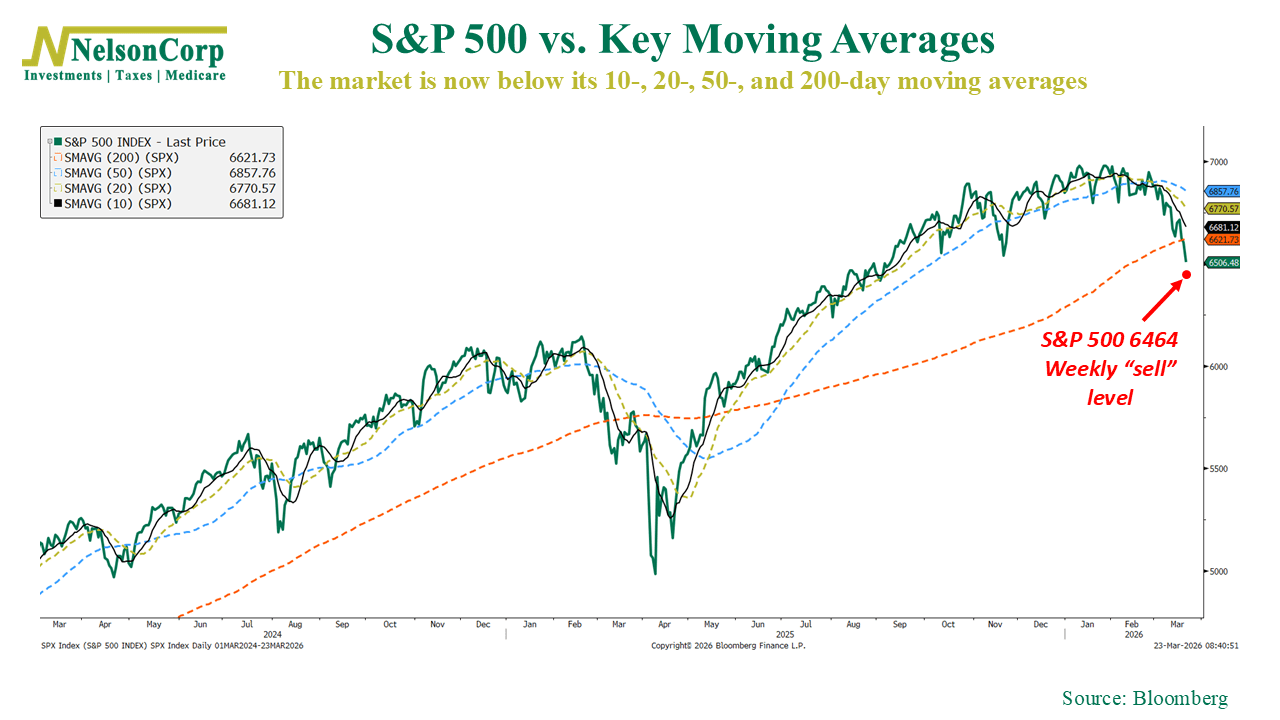
However, here’s another trend indicator that’s much closer to going negative. It’s called the Percentage Reversals indicator, and its signal is fairly simple. If the market falls 7.2% or more from a weekly high, a “sell” signal is generated.
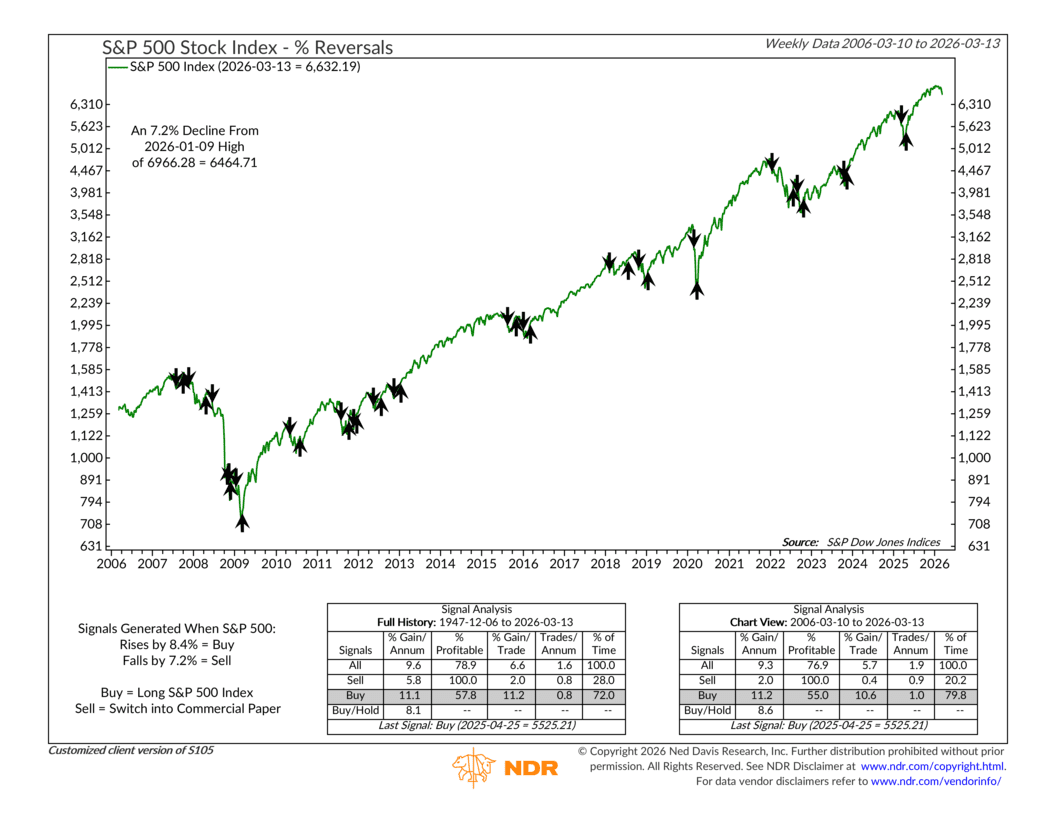
That equates to a level of 6464 on the S&P 500, which is here on the chart:
So what could push these remaining trend measures lower?
Bond yields are a key pressure point. They’ve been moving higher, and that tends to tighten financial conditions and weigh on equities. One way to see this is through the 26-week change in Moody’s Baa corporate bond yields, which are medium-quality credits. That measure is now above zero and sits around 3.6%.
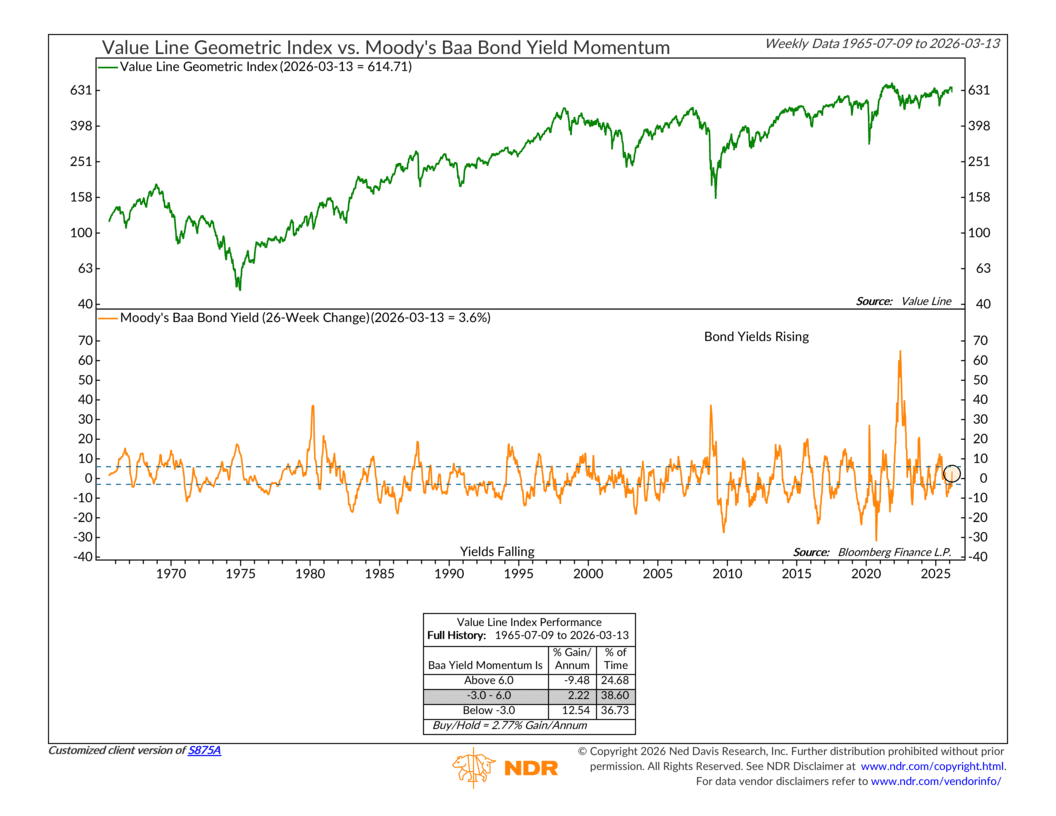
But even more concerning is if it rises above 6%. That’s when stocks have really struggled historically.
So, the bottom line is this. The trend has already weakened, and more signals are close to confirming it. Until we see improvement in either price action or interest rates, the weight of the evidence continues to lean toward a risk-off environment.
This is intended for informational purposes only and should not be used as the primary basis for an investment decision. Consult an advisor for your personal situation.
Indices mentioned are unmanaged, do not incur fees, and cannot be invested into directly.
Past performance does not guarantee future results.
The S&P 500 Index, or Standard & Poor’s 500 Index, is a market-capitalization-weighted index of 500 leading publicly traded companies in the U.S.
The Dow Jones Industrial Average (DJIA) is a price-weighted index composed of 30 widely traded blue-chip U.S. common stocks. The Nasdaq 100 Index is a basket of the 100 largest, most actively traded U.S. companies listed on the Nasdaq stock exchange. The index includes companies from various industries except for the financial industry, like commercial and investment banks. The Russell 3000 Index is a capitalization-weighted stock market index that seeks to be a benchmark of the entire U.S. stock market. The S&P MidCap 400 is designed to measure the performance of 400 mid-sized companies, reflecting the distinctive risk and return characteristics of this market segment. S&P 600 Index measures the small-cap segment of the U.S. equity market. The index is designed to track companies that meet specific inclusion criteria to ensure that they are liquid and financially viable. The S&P 100 index is a capitalization-weighted index based on 100 highly capitalized stocks for which options are listed on the CBOE (Chicago Board of Exchange). The MSCI EAFE Index is an equity index which captures large and mid cap representation across 21 Developed Markets countries* around the world, excluding the US and Canada.
The Bloomberg U.S. Corporate Bond Index measures the investment grade, fixed-rate, taxable corporate bond market. The Bloomberg U.S. Corporate High Yield Index is comprised of domestic and corporate bonds rated Ba and below with a minimum outstanding amount of $150 million. The Bloomberg U.S. Municipal Index covers the USD-denominated long-term tax exempt bond market. The index has four main sectors: state and local general obligation bonds, revenue bonds, insured bonds and prerefunded bonds.