OVERVIEW
Markets cooled off last week, with most major indexes slipping into the red. The S&P 500 fell 0.39%, the Dow dropped 1.32%, and the NASDAQ declined 0.63%. Small- and mid-caps took the brunt of the weakness—S&P 400 and 600 indexes sank 1.46% and 1.35%, respectively. Growth stocks held up best, nearly flat on the week.
International equities were mixed. Developed markets dipped 0.18%, while emerging markets posted a modest gain of 0.60%. The U.S. dollar dipped 0.98%.
Bond markets showed broad strength. Long-term Treasuries rallied 1.08%, while intermediate-term and short-term Treasuries rose 0.58% and 0.09%, respectively. Investment-grade corporates and municipal bonds each gained 0.66%, and high-yield bonds advanced 0.15%.
Commodities surged. Oil spiked 12.38% as tensions between Israel and Iran flared again in the Middle East, raising concerns over potential supply disruptions. Gold climbed 3.17%, and the overall commodity index rose 1.93%. Corn prices fell 2.76%. Real estate was unchanged, and MLPs added 1.18%.
KEY CONSIDERATIONS
From Chaos to Calm – It’s pretty wild to think that just a couple of months ago, the market was in the midst of a pretty scary sell-off. In just 48 calendar days, the S&P 500 stock index lost 18.9%.
But then, over the next 63 calendar days, it gained back 21.2%.
Thanks to how percentages work, we’re still not quite back to new highs, despite the gain being greater than the loss. But hey, don’t blame me—blame the math.
At any rate, if we look at a candlestick chart of the S&P 500, you can see how much smaller the high-low bars have gotten since April. All those dramatic intra-day reversals we saw during the spring? Yeah, they’re gone.
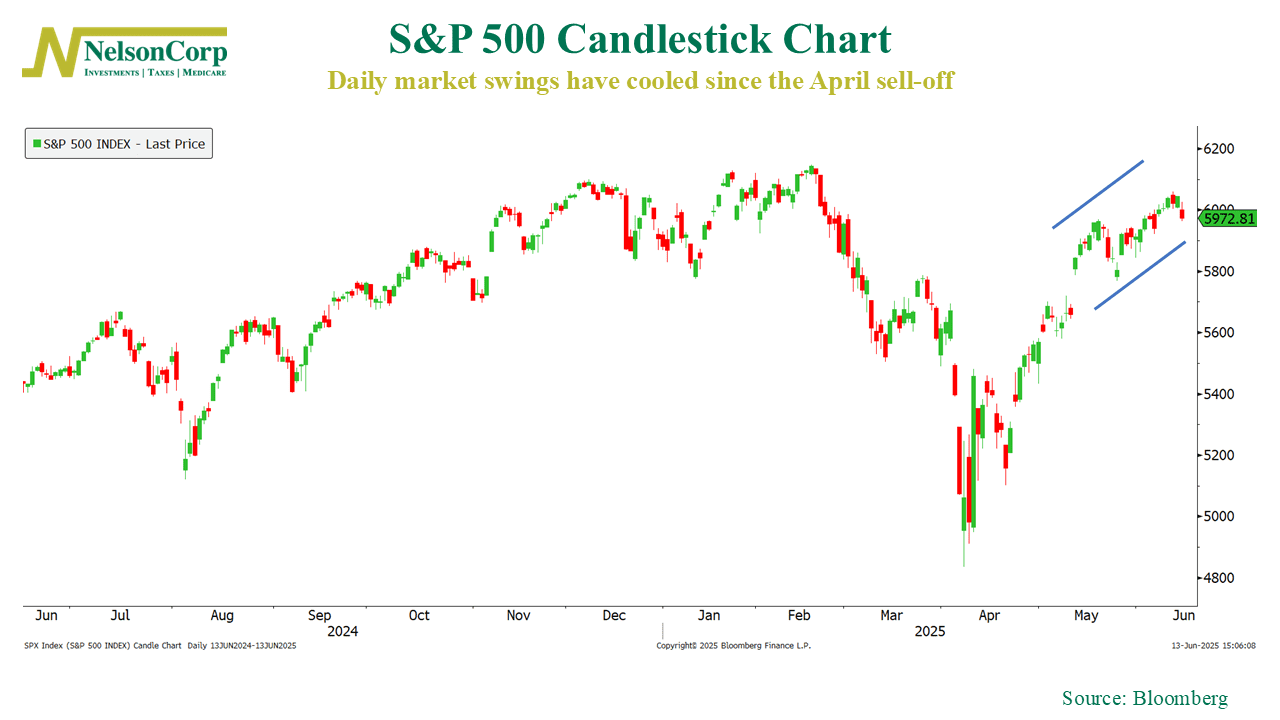
So volatility has collapsed. That’s a good thing. Bull markets thrive on low volatility. But you know what else they need? Breadth. Or if you prefer: participation.
By that, I mean individual stocks need to be participating in the rally—not just a few of the large mega-caps that pull the broader indexes higher. To be sure, breadth isn’t a necessary condition for a bull market, nor is it a sufficient one. But it does help—a lot.
We pointed this out in this week’s Chart of the Week post, showing that nearly half of the stocks within the S&P 500 are now beating the index itself this year. That’s good. But we’d also like to see the percentage of stocks in the index hitting new highs increase as well.
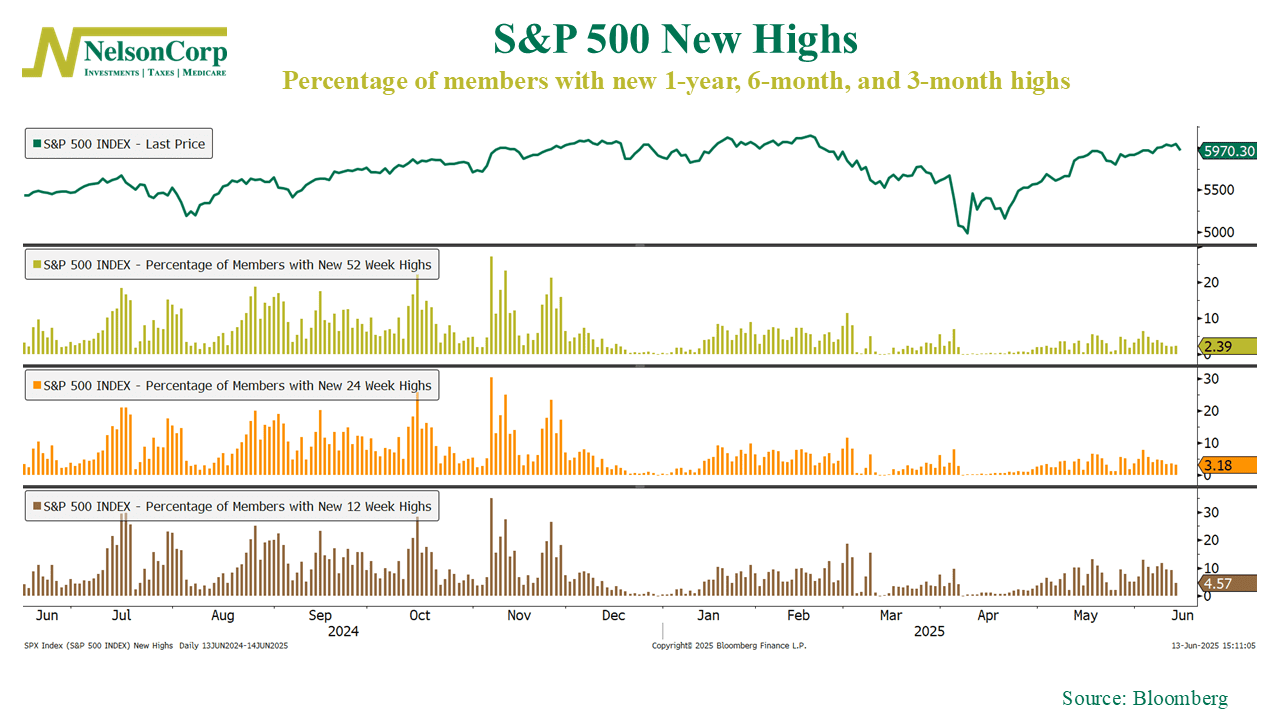
As you can see, while it’s elevated from the April lows, we still have a ways to go before we reach the levels from last year, when roughly 20–30% of stocks were consistently hitting new 1-year, 6-month, and 3-month highs.
But at the end of the day, the theme for the market this year has been trade uncertainty. Any news—positive or negative—on trade has really moved the market. In fact, as this final chart shows, market volatility (the VIX Index) has moved in lockstep with the Bloomberg U.S. Trade Policy Uncertainty Index this year.
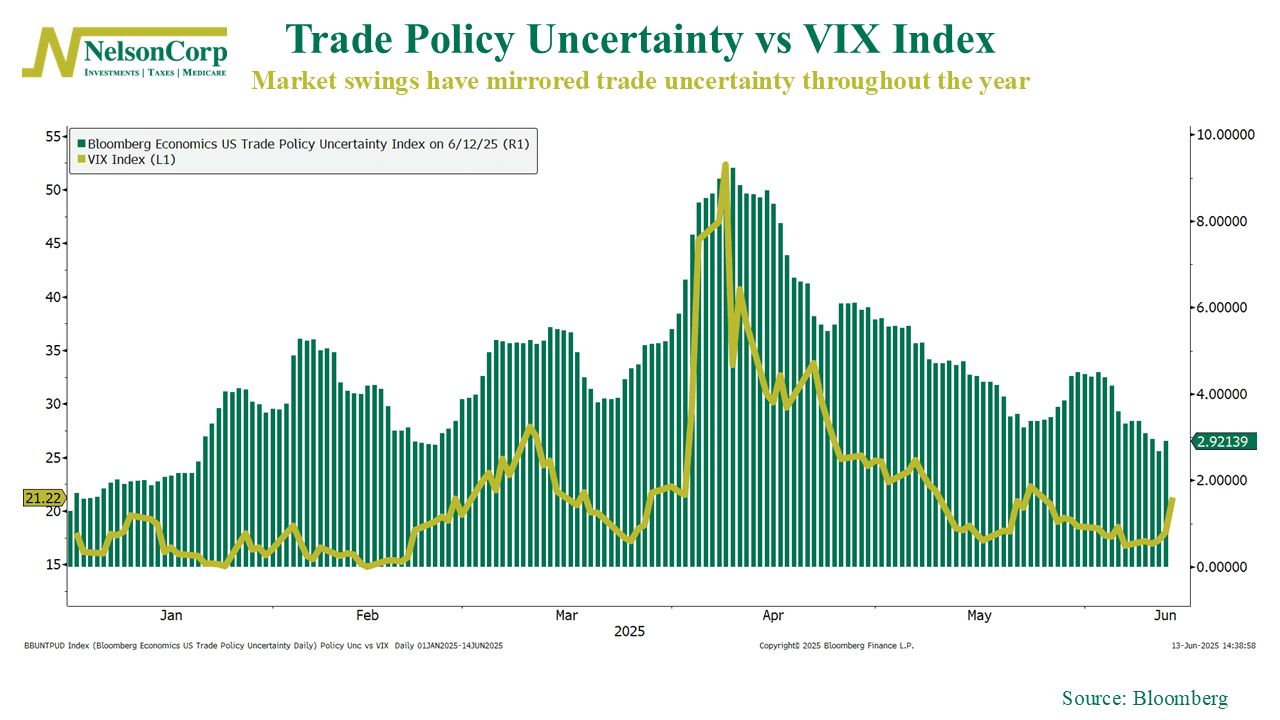
So, the bottom line? Volatility is down and breadth is starting to pick up—but as long as trade uncertainty dominates the headlines, the market’s direction is likely still at the mercy of the next news cycle.
This is intended for informational purposes only and should not be used as the primary basis for an investment decision. Consult an advisor for your personal situation.
Indices mentioned are unmanaged, do not incur fees, and cannot be invested into directly.
Past performance does not guarantee future results.
The S&P 500 Index, or Standard & Poor’s 500 Index, is a market-capitalization-weighted index of 500 leading publicly traded companies in the U.S.