OVERVIEW
Markets struggled again this week, with most major indexes finishing in the red. The S&P 500 dropped 0.97%, while the Dow bucked the trend, gaining 0.95%. Tech stocks had a rough week, as the Nasdaq plunged 3.47%.
Small- and mid-cap stocks also faced losses. The S&P 600 declined 1.08%, while mid-caps (S&P 400) slipped 0.22%. The broader market followed suit, with the Russell 3000 down 0.99%, and its growth counterpart falling 2.55%.
International markets were mixed. Developed markets (EAFE) dipped 0.84%, while emerging markets took a steep 4.36% hit. Meanwhile, the U.S. dollar rose 1.07%.
Bonds provided some stability. Long-term Treasuries surged 3.25%, while investment-grade bonds climbed 1.05%. Short- and intermediate-term Treasuries also gained modestly.
Commodities struggled. Broad commodities fell 3.82%, while oil inched down 0.17%. Gold slumped 3.55%, and corn dropped a hefty 7.03%.
KEY CONSIDERATIONS
Growth Scare – The market is going through a bit of a “growth scare” right now—and for good reason. The latest batch of economic data has been pretty weak.
For example, this past week we found out that personal consumption expenditures—a measure of consumer spending in the economy—dropped 0.2% in January, the first decline in monthly spending since March 2023.
Here’s what that did to the Atlanta Fed’s GDPNow model, an estimate of GDP growth based on incoming data:
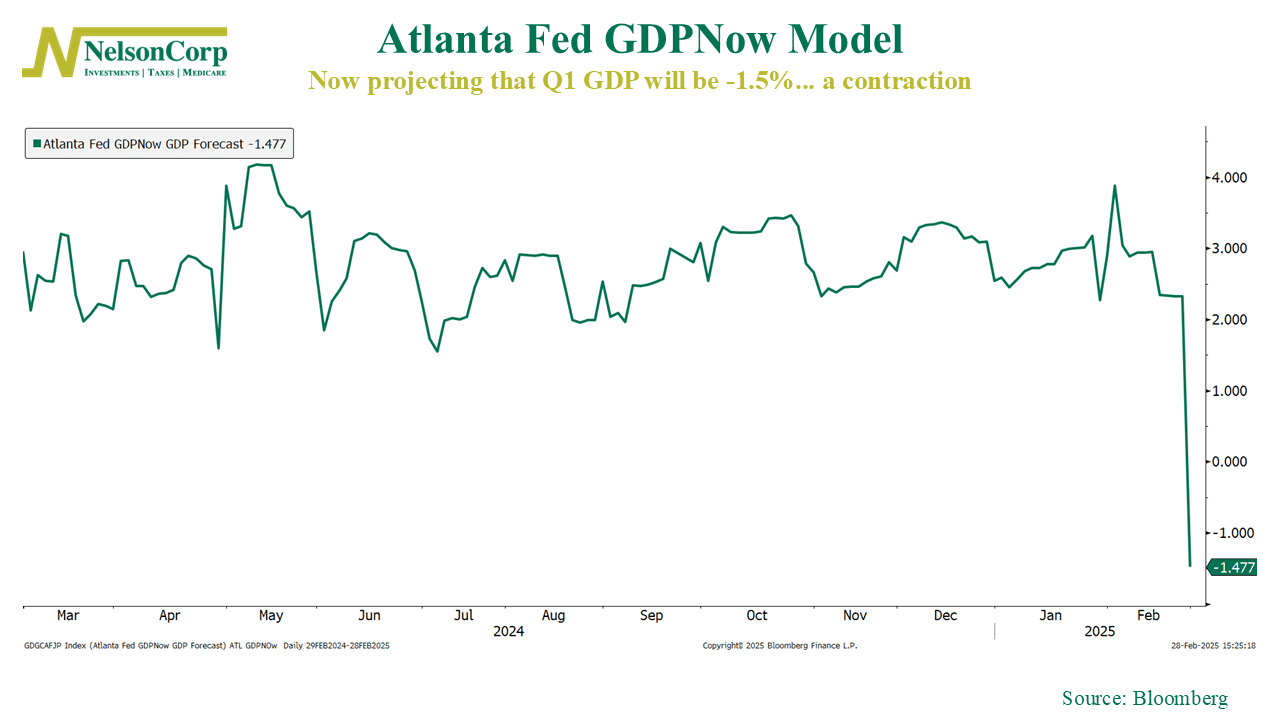
Just last week, the model was projecting solid economic growth at +2.3%. Four weeks ago, it was +3.9%. Now? It’s signaling contraction.
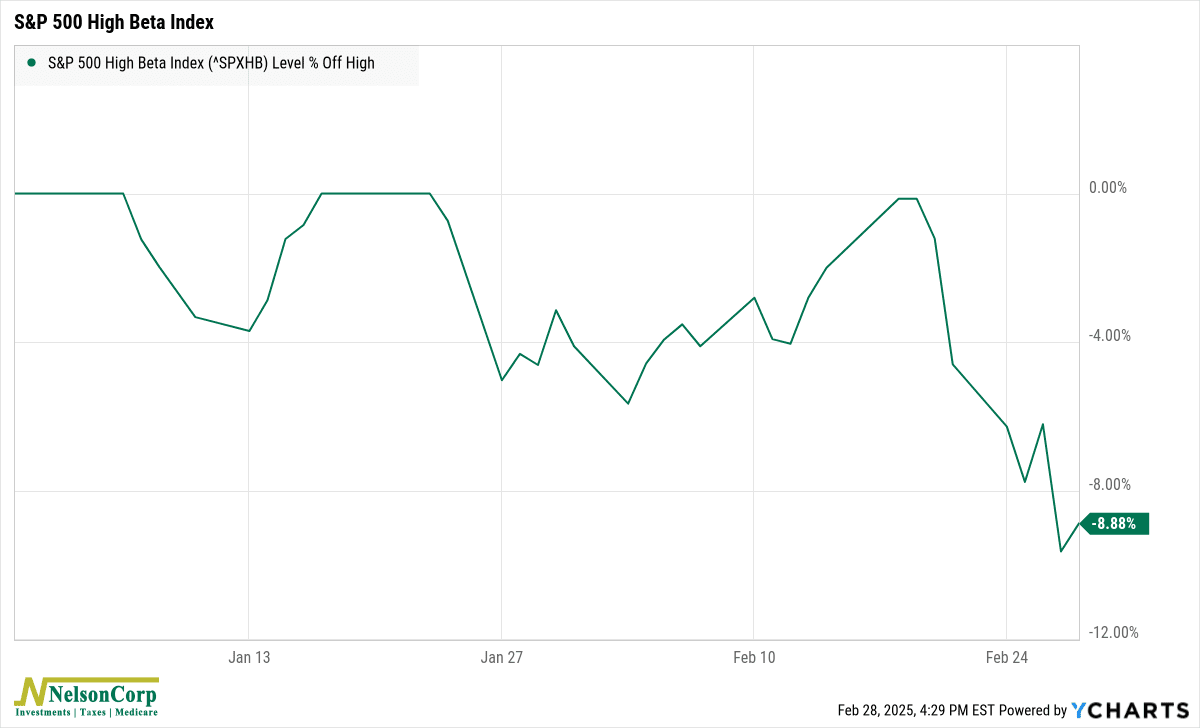
Unsurprisingly, this has rattled the stock market. In just a few days, Wall Street has turned sharply against anything and everything perceived as too risky—cryptocurrencies, gold, tech stocks, you name it. The S&P 500 High Beta Index, a measure of volatile stocks, has plunged roughly 9% in the past seven days alone.
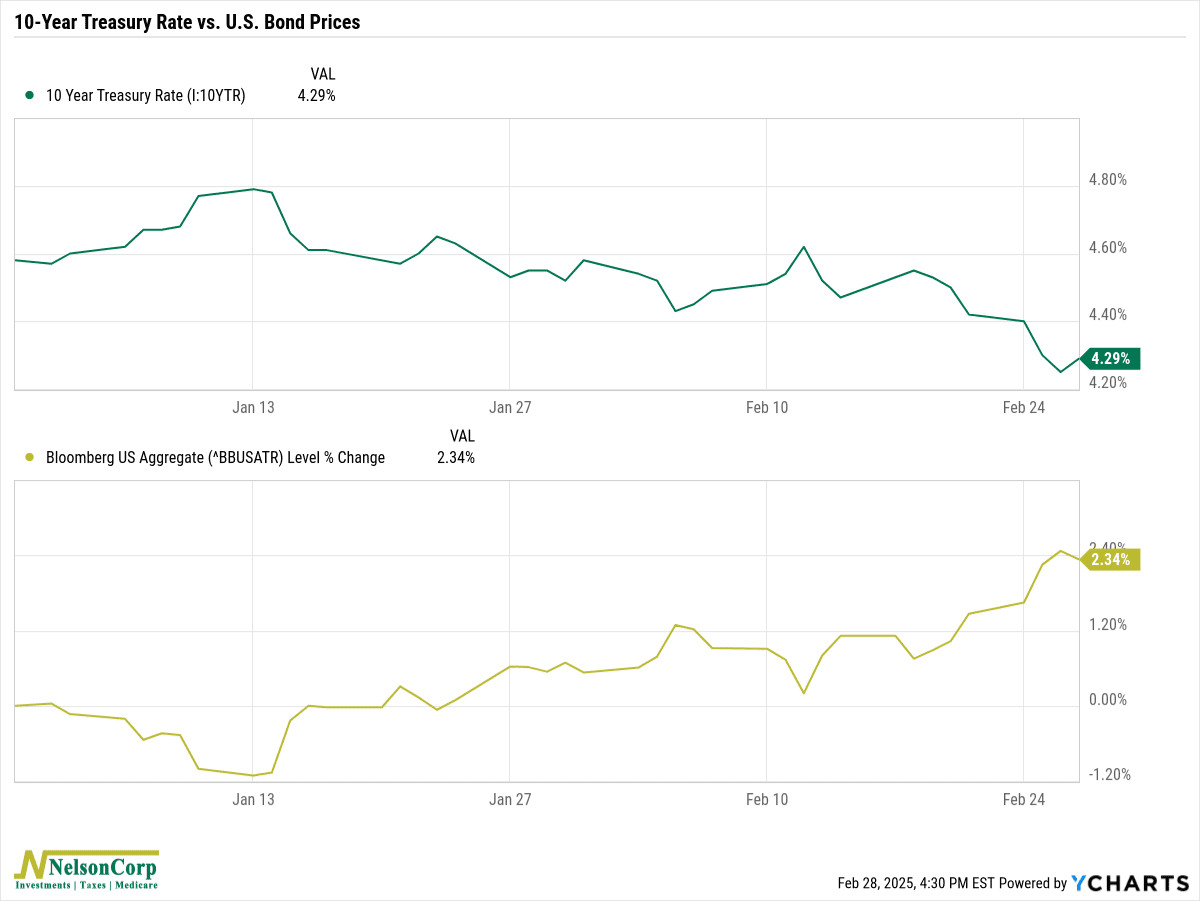
So, where’s the money flowing? Mostly into U.S. Treasuries. The 10-year Treasury yield (green line below) has dropped about half a percentage point since mid-January, now sitting at 4.29%. That decline has given the bond market a lift, with the Bloomberg U.S. Aggregate Bond Index (gold line) up more than 2% this year.
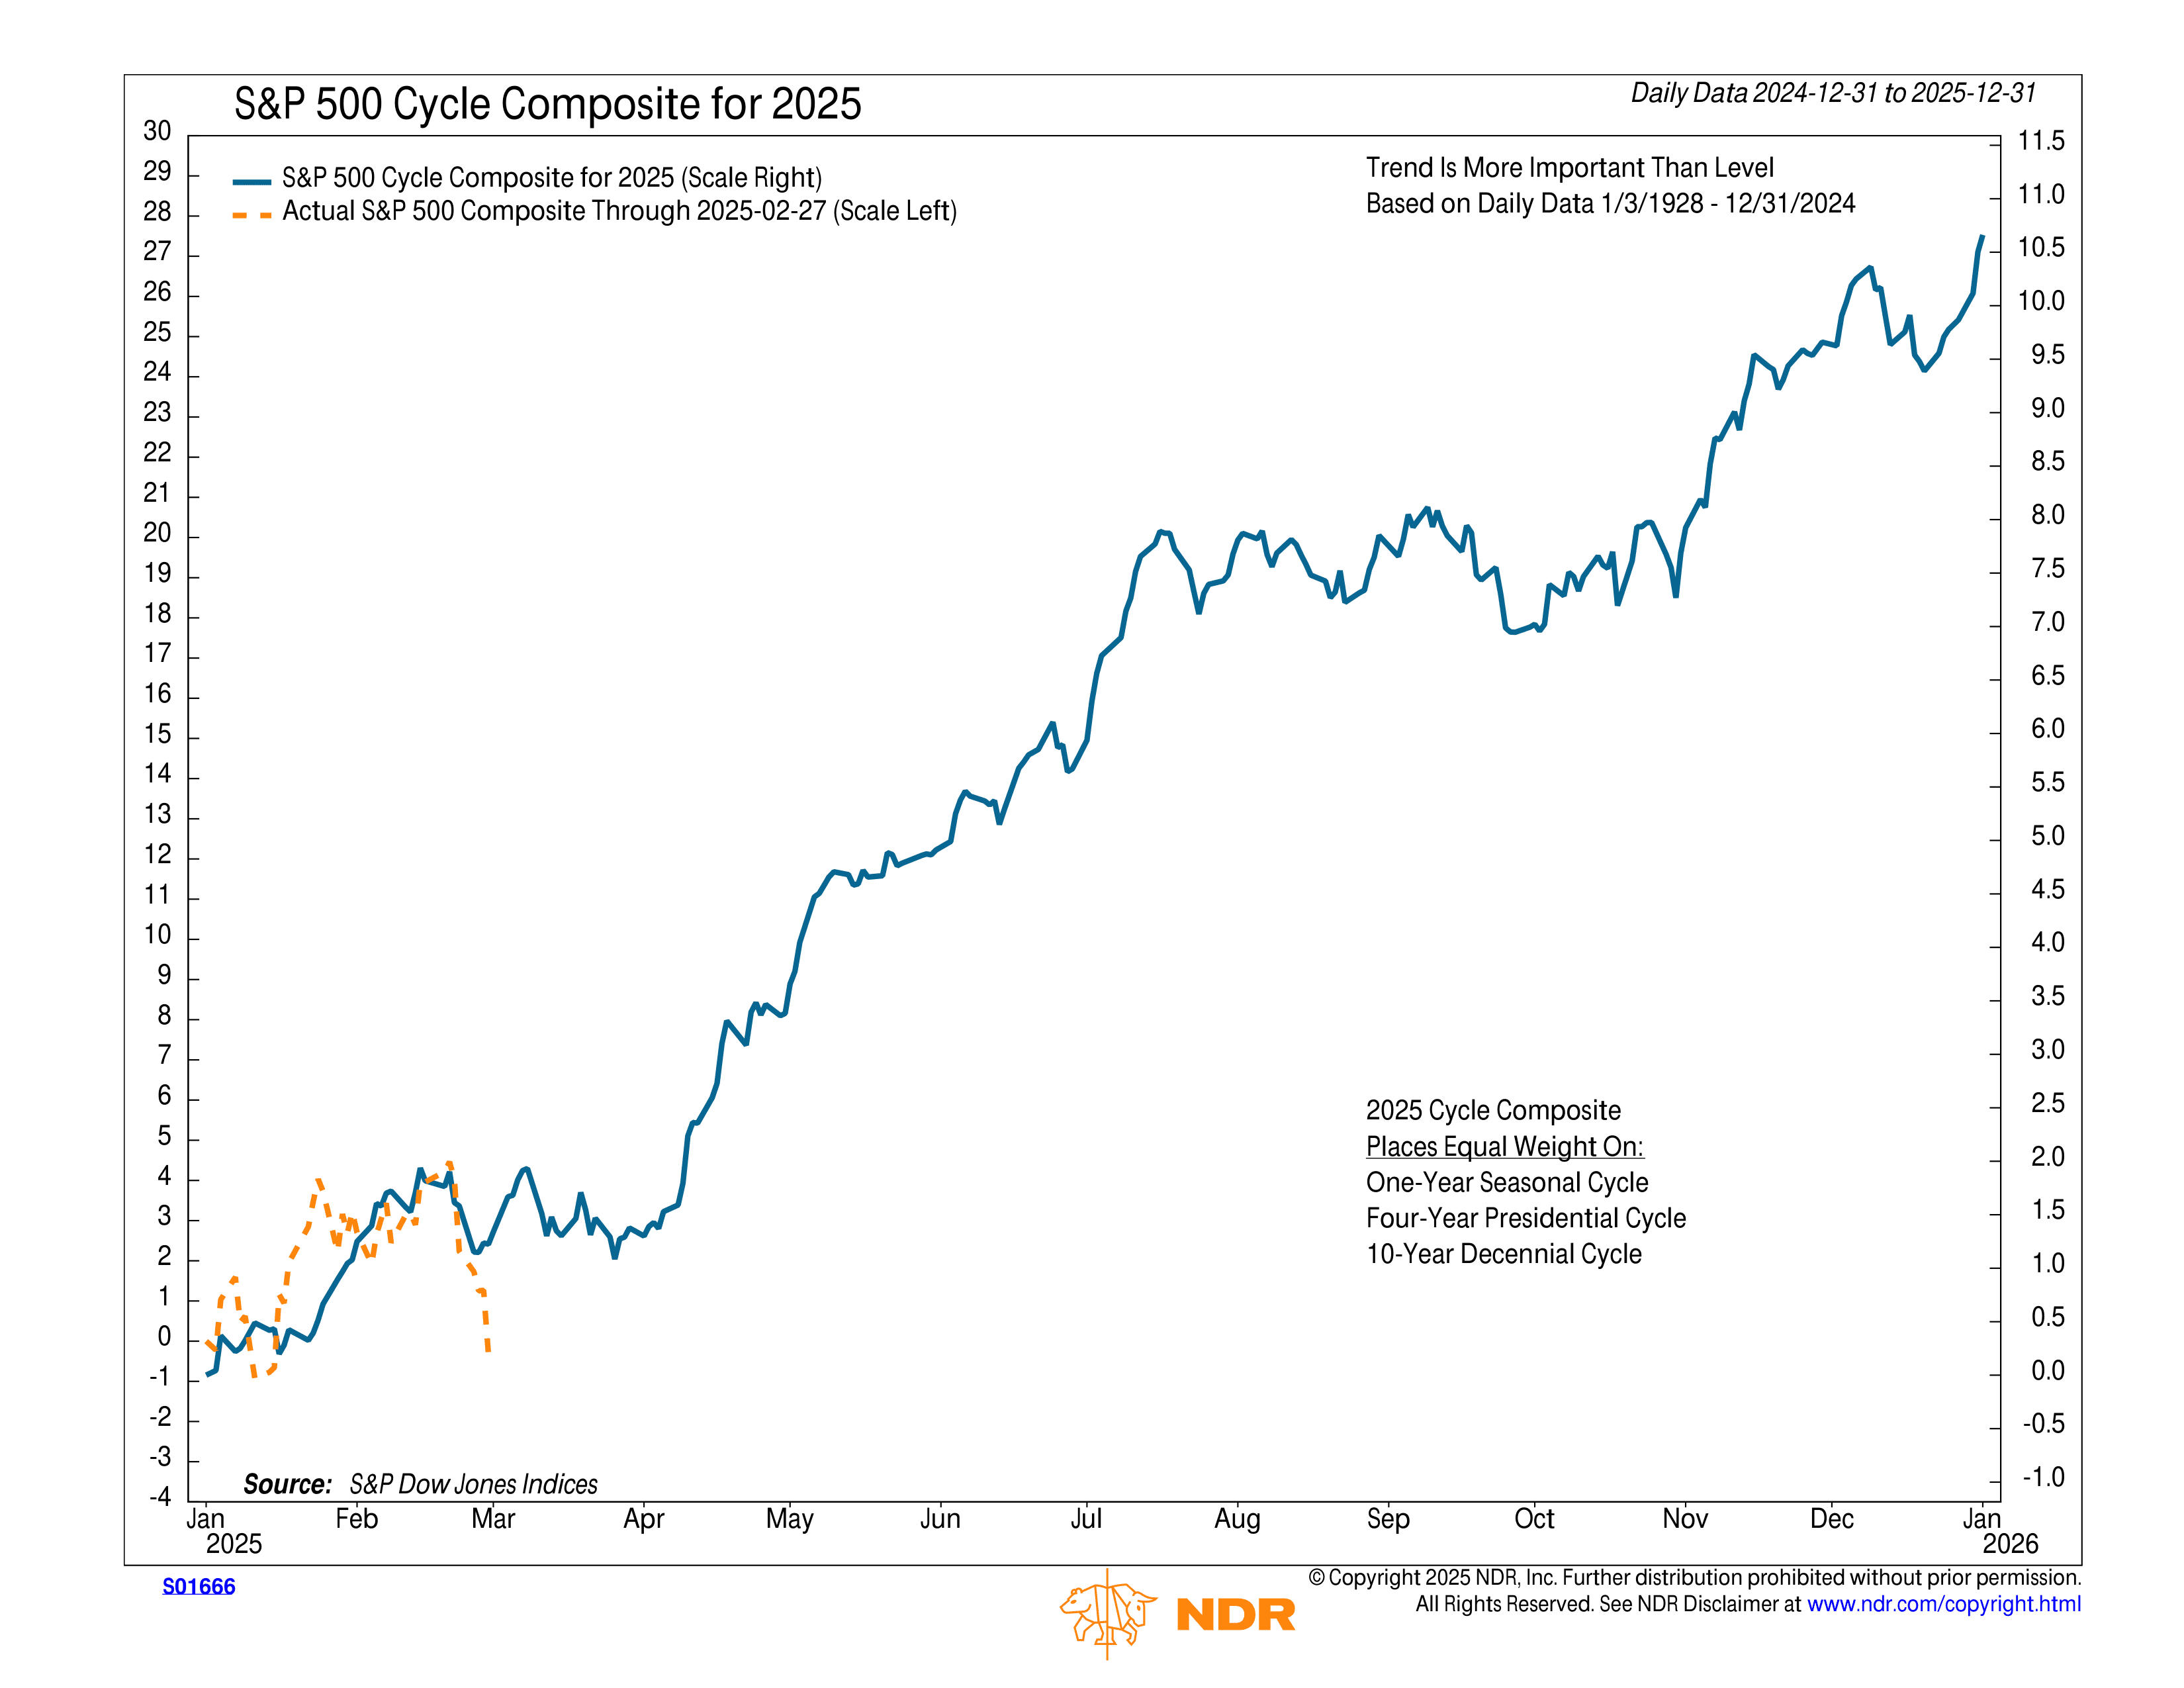
In other words, risk is out, and safety is in. But there’s a silver lining—our primary stock market risk model has shown signs of improvement lately. A few more positive shifts in key areas and it could turn bullish soon. That would align with the stock market seasonality composite for 2025, shown below.
The bottom line? The current environment has investors questioning stock valuations. Ideally, this is just a temporary scare, resolving into new record highs later this year on the back of strong economic and earnings growth. But for that to happen, the market will need to prove itself first.
This is intended for informational purposes only and should not be used as the primary basis for an investment decision. Consult an advisor for your personal situation.
Indices mentioned are unmanaged, do not incur fees, and cannot be invested into directly.
Past performance does not guarantee future results.
The S&P 500 Index, or Standard & Poor’s 500 Index, is a market-capitalization-weighted index of 500 leading publicly traded companies in the U.S.