OVERVIEW
Markets were mixed last week. The S&P 500 inched up 0.08%, the Dow gained 0.34%, and the S&P 100 (large-cap) rose 0.32%. The NASDAQ slipped 0.45% as technology shares struggled to keep pace. Broadly, the Russell 3000 dipped 0.07%, as growth stocks fell 0.31% and value stocks edged up 0.09%.
Small- and mid-sized companies lagged. Mid-caps (S&P 400) fell 1.17%, and small-caps (S&P 600) dropped 1.00%. International equities fared much better. Developed markets (EAFE) climbed 1.60%, and emerging markets added 0.29%, continuing their year-to-date leadership.
Bond markets were mixed as interest rates moved unevenly. Short-term Treasuries rose 0.06%, while intermediate-term Treasuries slipped 0.22% and long-term Treasuries declined 0.77%. Investment-grade bonds fell 0.24%, while high-yield gained a modest 0.05%. Municipal bonds declined 0.23%, and TIPS slipped 0.14%.
Commodities and alternatives posted broad gains. Gold jumped 2.81%, oil rose 0.17%, and broad commodities gained 1.67%. Corn advanced 3.21%. Real estate fell 0.71%, but MLPs rose 2.18%. The U.S. dollar slipped 0.18%, while the VIX surged 3.93%, reflecting a small uptick in market volatility.
KEY CONSIDERATIONS
Hitting a Wall – Good news! The U.S. government shutdown has finally ended after more than a month. The bad news? Stocks have hit a bit of a wall lately.
To be fair, it’s not a major wall just yet. Even with the recent pullback, the S&P 500 is still trading above its 50-day average price. But participation beneath the surface has thinned out. As the chart below shows, the percentage of NYSE stocks trading above their own 50-day moving averages has slipped below 50 percent, near the weakest level since April.
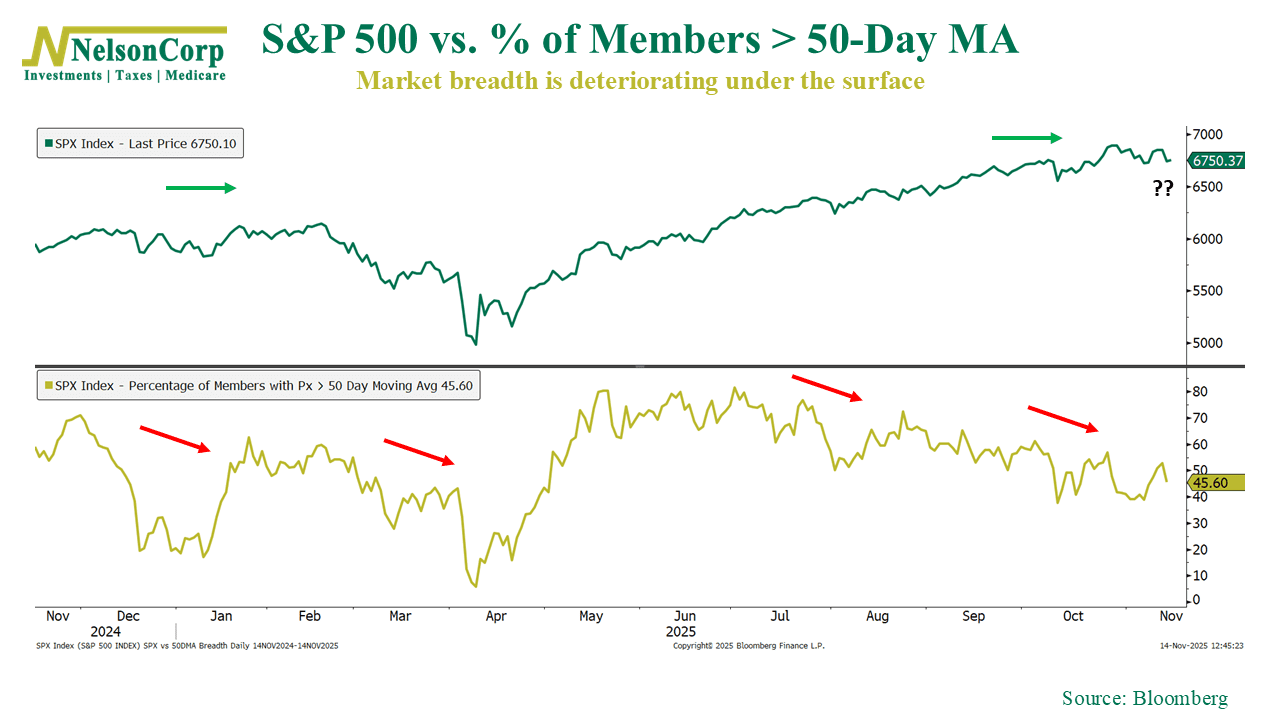
This type of divergence, where the index is trending higher but underlying breadth is trending lower, is a sign of a sick market—or at least a market that might be catching a cold.
There are other signs, too. Back in March, before the April selloff, more than 65 percent of S&P 500 stocks had positive year-to-date gains. The market hasn’t been able to get back to that level since, and today only about half of the index is in the green, even though the S&P 500 itself sits just a few percentage points from its all-time high.
When you take that weakening price action and add elevated valuations and some soft economic readings, it’s no surprise our models have seen some deterioration over the past month. Several indicators have slipped, and from a risk standpoint, the overall environment simply isn’t very favorable right now.
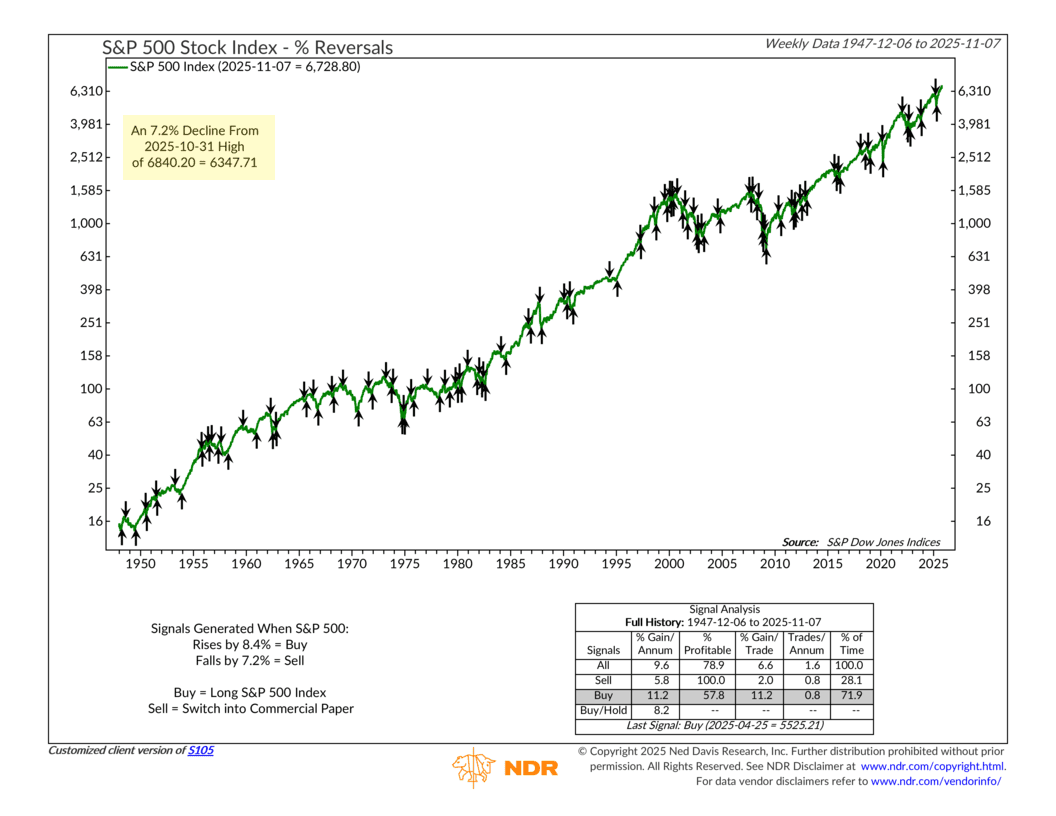
There is one bright spot, however, and that is the market’s long-term trend. Step back and look at the big picture. Is the market generally moving higher or lower? That’s the trend, and it tends to change more slowly than things like momentum. Because of that, it can sometimes be the last pillar to weaken.
The simplest trend measure we track is shown below. It looks at reversals in the S&P 500 index. The key threshold is a 7.2 percent drop from a weekly high. In this case, the high was 6840, set on Halloween day. A decline of that size would bring the index down to about 6348. At that point, things could start to get scarier for the market.
Okay, so what’s the bottom line you need to know this week? Well, I’d say it’s that the shutdown’s end removes one source of uncertainty, but the broader market picture remains cloudy. Breadth is soft, valuations are rich, and economic data has cooled. The long-term trend is still intact, which helps, but it’s one of the few supports left in place. Until we see improvement beneath the surface, caution is likely the more reasonable stance.
This is intended for informational purposes only and should not be used as the primary basis for an investment decision. Consult an advisor for your personal situation.
Indices mentioned are unmanaged, do not incur fees, and cannot be invested into directly.
Past performance does not guarantee future results.
The S&P 500 Index, or Standard & Poor’s 500 Index, is a market-capitalization-weighted index of 500 leading publicly traded companies in the U.S.
The Dow Jones Industrial Average (DJIA) is a price-weighted index composed of 30 widely traded blue-chip U.S. common stocks. The Nasdaq 100 Index is a basket of the 100 largest, most actively traded U.S. companies listed on the Nasdaq stock exchange. The index includes companies from various industries except for the financial industry, like commercial and investment banks. The Russell 3000 Index is a capitalization-weighted stock market index that seeks to be a benchmark of the entire U.S. stock market. The S&P MidCap 400 is designed to measure the performance of 400 mid-sized companies, reflecting the distinctive risk and return characteristics of this market segment. S&P 600 Index measures the small-cap segment of the U.S. equity market. The index is designed to track companies that meet specific inclusion criteria to ensure that they are liquid and financially viable. The S&P 100 index is a capitalization-weighted index based on 100 highly capitalized stocks for which options are listed on the CBOE (Chicago Board of Exchange). The MSCI EAFE Index is an equity index which captures large and mid cap representation across 21 Developed Markets countries* around the world, excluding the US and Canada.
The Bloomberg U.S. Corporate Bond Index measures the investment grade, fixed-rate, taxable corporate bond market. The Bloomberg U.S. Corporate High Yield Index is comprised of domestic and corporate bonds rated Ba and below with a minimum outstanding amount of $150 million. The Bloomberg U.S. Municipal Index covers the USD-denominated long-term tax exempt bond market. The index has four main sectors: state and local general obligation bonds, revenue bonds, insured bonds and prerefunded bonds.