
OVERVIEW
KEY CONSIDERATIONS
Hurdles – It’s been a rough start to summer for the U.S. stock market. Nothing too dramatic, but the S&P 500 peaked at the beginning of June and is still down a few percentage points since then.
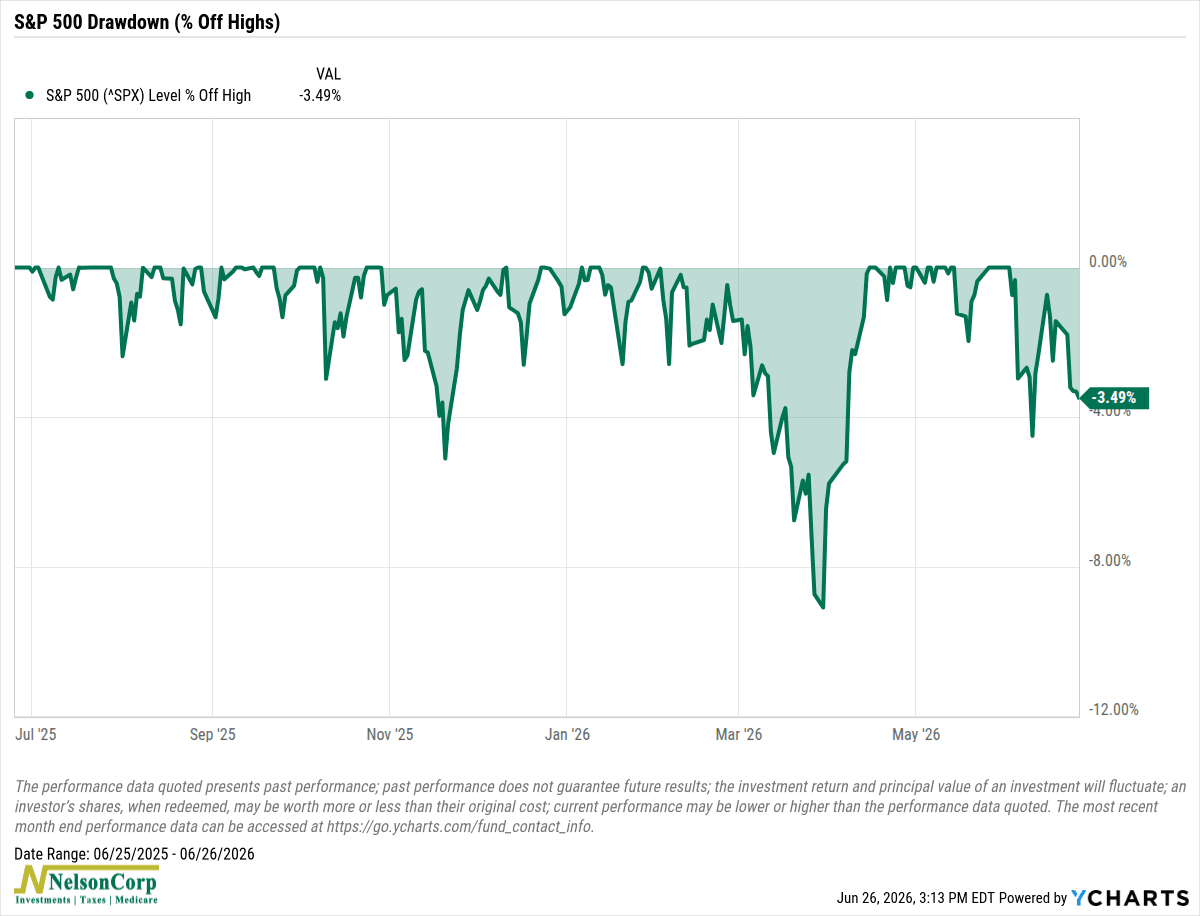
While the tentative U.S.-Iran peace deal is certainly a positive for both stocks and bonds, we do think the stock market could face a few hurdles in the short term.
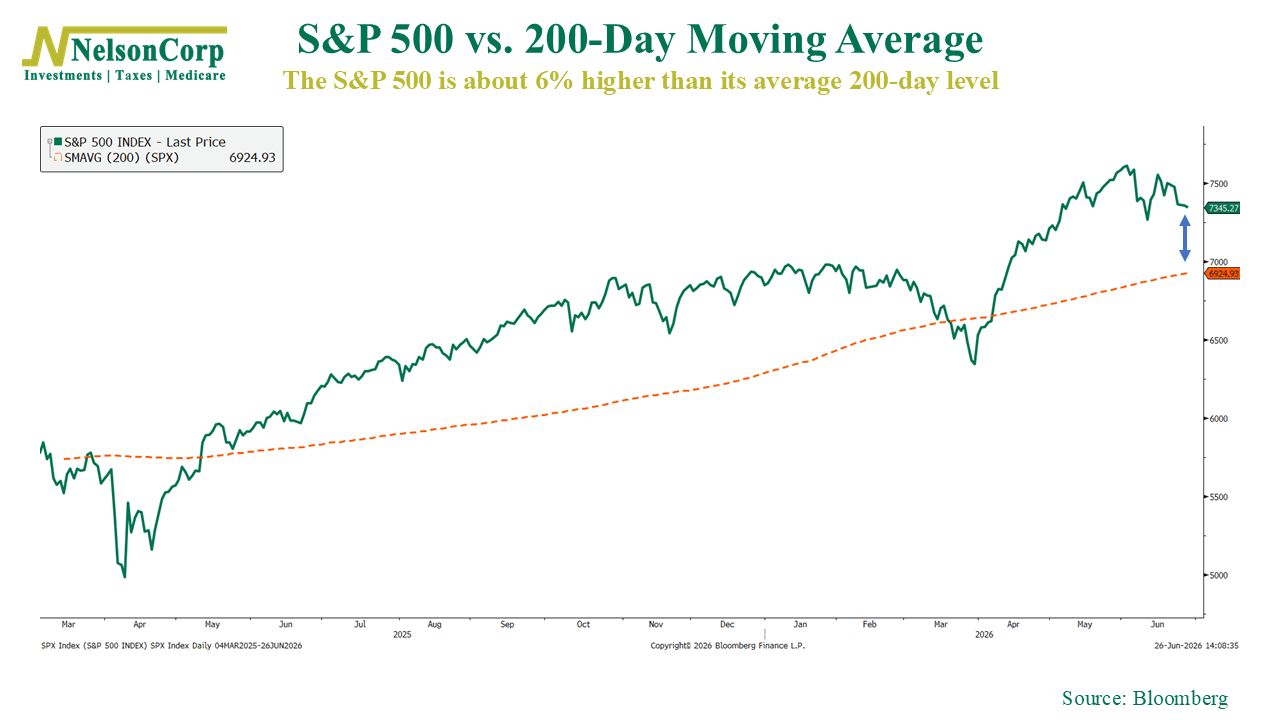
The challenge is the steep run-up in stock prices since early April. That surge was a good sign that the market had moved past the Iranian conflict and oil shock, shifting its focus back to the AI story. However, after such a strong advance, the market may simply need some time to digest those gains.
For example, several technical indicators are flashing warning signs that the market may have gotten a bit ahead of itself. The chart below shows there is a significant gap between the S&P 500’s current level and its 200-day moving average.
As a result, the indicator below flashed an overbought signal earlier this month. It measures how far the S&P 500’s 25-day moving average is trading relative to its volatility-defined overbought and oversold bands.
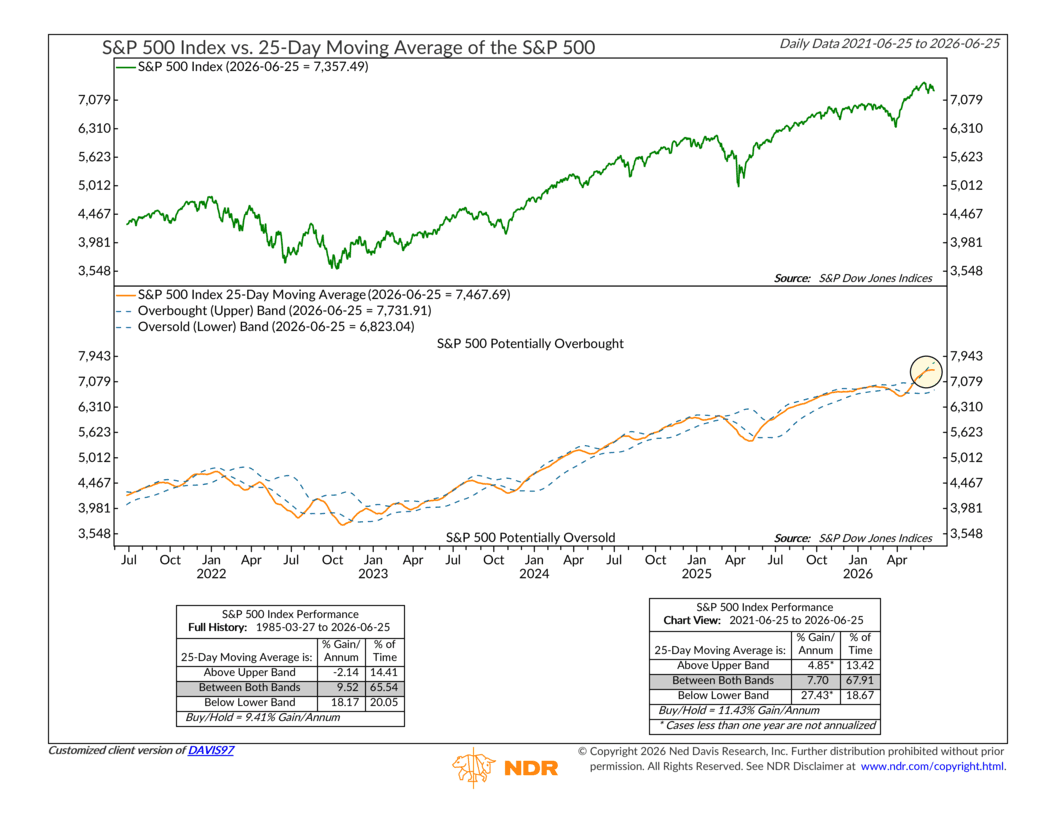
The good news, though, is that the recent pullback has brought the indicator back into a neutral zone, which is encouraging.
That said, we still find the market remains pretty “bulled up” overall. The put/call ratio, shown below, recently fell to extremely optimistic levels before reversing. From a contrarian perspective, that has often been an early warning sign of a short-term pullback.
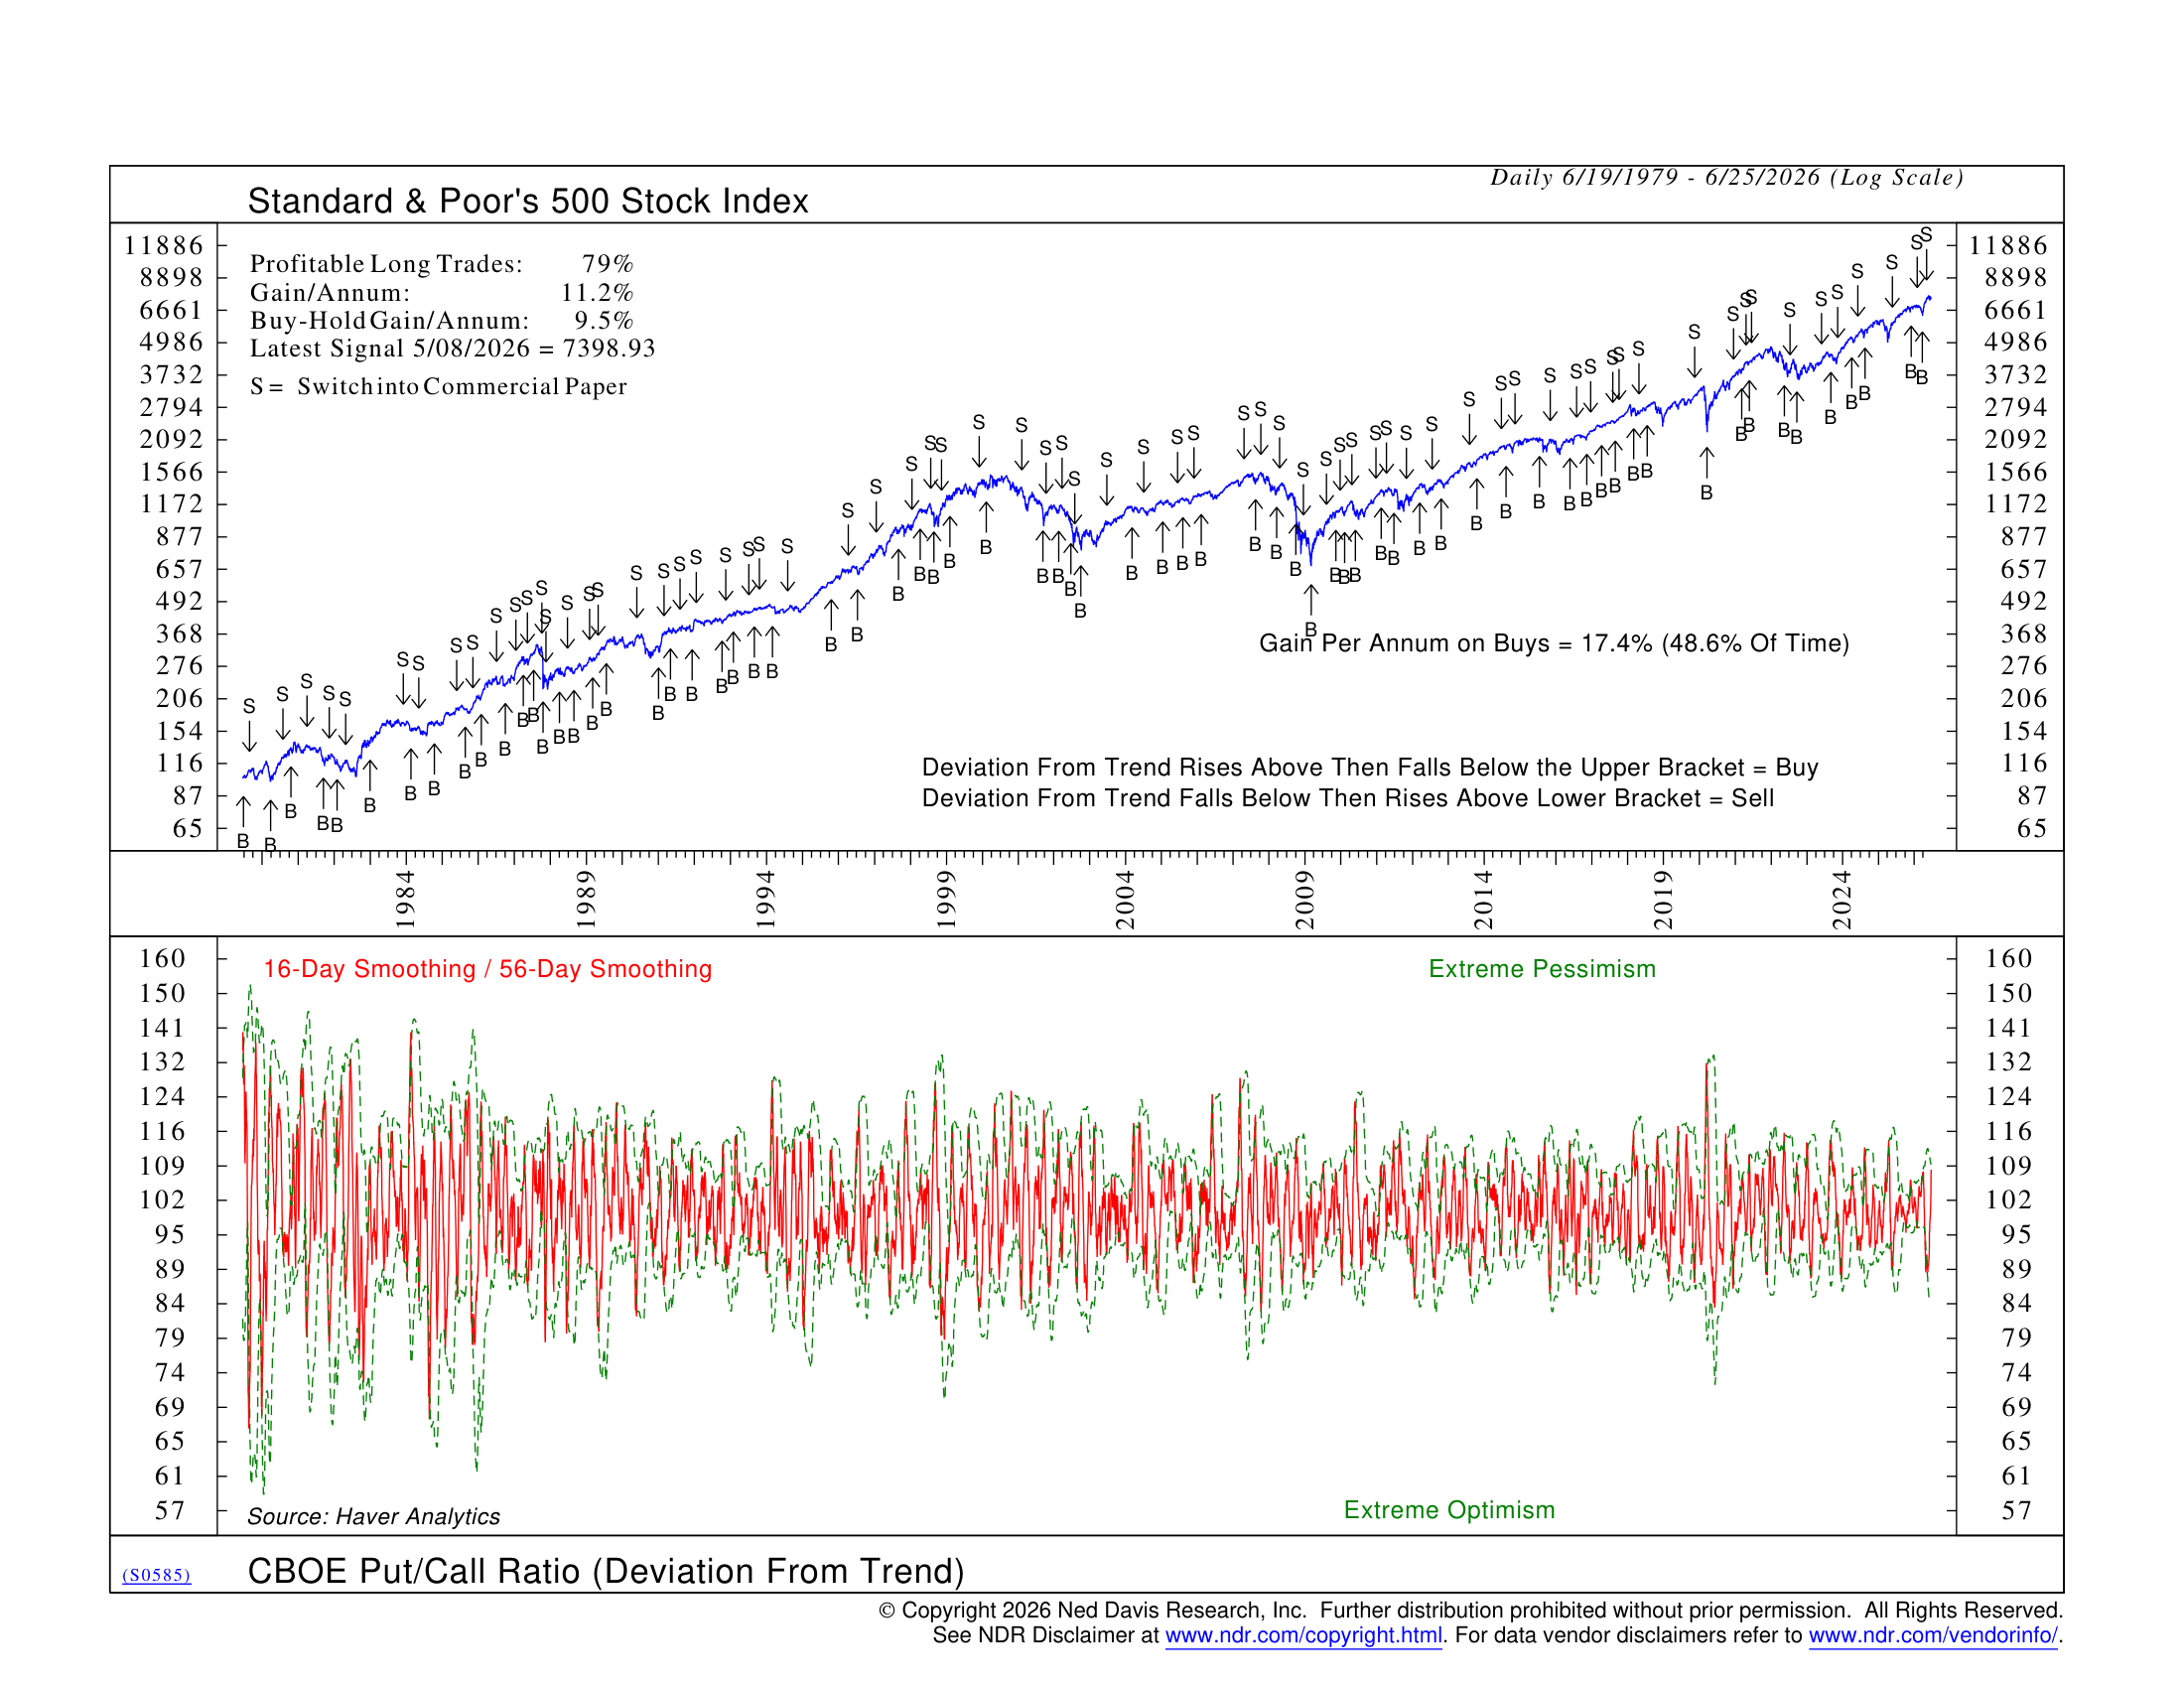
At the end of the day, though, the weight of the overall indicator evidence still leans to the “mostly bullish” side of the ledger. We may hit a few bumps along the way, but as long as the majority of indicators continue to hold up, the broader outlook remains constructive.
This is intended for informational purposes only and should not be used as the primary basis for an investment decision. Consult an advisor for your personal situation.
Indices mentioned are unmanaged, do not incur fees, and cannot be invested into directly.
Past performance does not guarantee future results.
The S&P 500 Index, or Standard & Poor’s 500 Index, is a market-capitalization-weighted index of 500 leading publicly traded companies in the U.S.
The Dow Jones Industrial Average (DJIA) is a price-weighted index composed of 30 widely traded blue-chip U.S. common stocks. The Nasdaq 100 Index is a basket of the 100 largest, most actively traded U.S. companies listed on the Nasdaq stock exchange. The index includes companies from various industries except for the financial industry, like commercial and investment banks. The Russell 3000 Index is a capitalization-weighted stock market index that seeks to be a benchmark of the entire U.S. stock market. The S&P MidCap 400 is designed to measure the performance of 400 mid-sized companies, reflecting the distinctive risk and return characteristics of this market segment. S&P 600 Index measures the small-cap segment of the U.S. equity market. The index is designed to track companies that meet specific inclusion criteria to ensure that they are liquid and financially viable. The S&P 100 index is a capitalization-weighted index based on 100 highly capitalized stocks for which options are listed on the CBOE (Chicago Board of Exchange). The MSCI EAFE Index is an equity index which captures large and mid cap representation across 21 Developed Markets countries* around the world, excluding the US and Canada.
The Bloomberg U.S. Corporate Bond Index measures the investment grade, fixed-rate, taxable corporate bond market. The Bloomberg U.S. Corporate High Yield Index is comprised of domestic and corporate bonds rated Ba and below with a minimum outstanding amount of $150 million. The Bloomberg U.S. Municipal Index covers the USD-denominated long-term tax exempt bond market. The index has four main sectors: state and local general obligation bonds, revenue bonds, insured bonds and prerefunded bonds.