
OVERVIEW
KEY CONSIDERATIONS
Ignoring the Bad News – The stock market has had plenty of reasons to worry lately. So naturally, it surged to new highs last week.
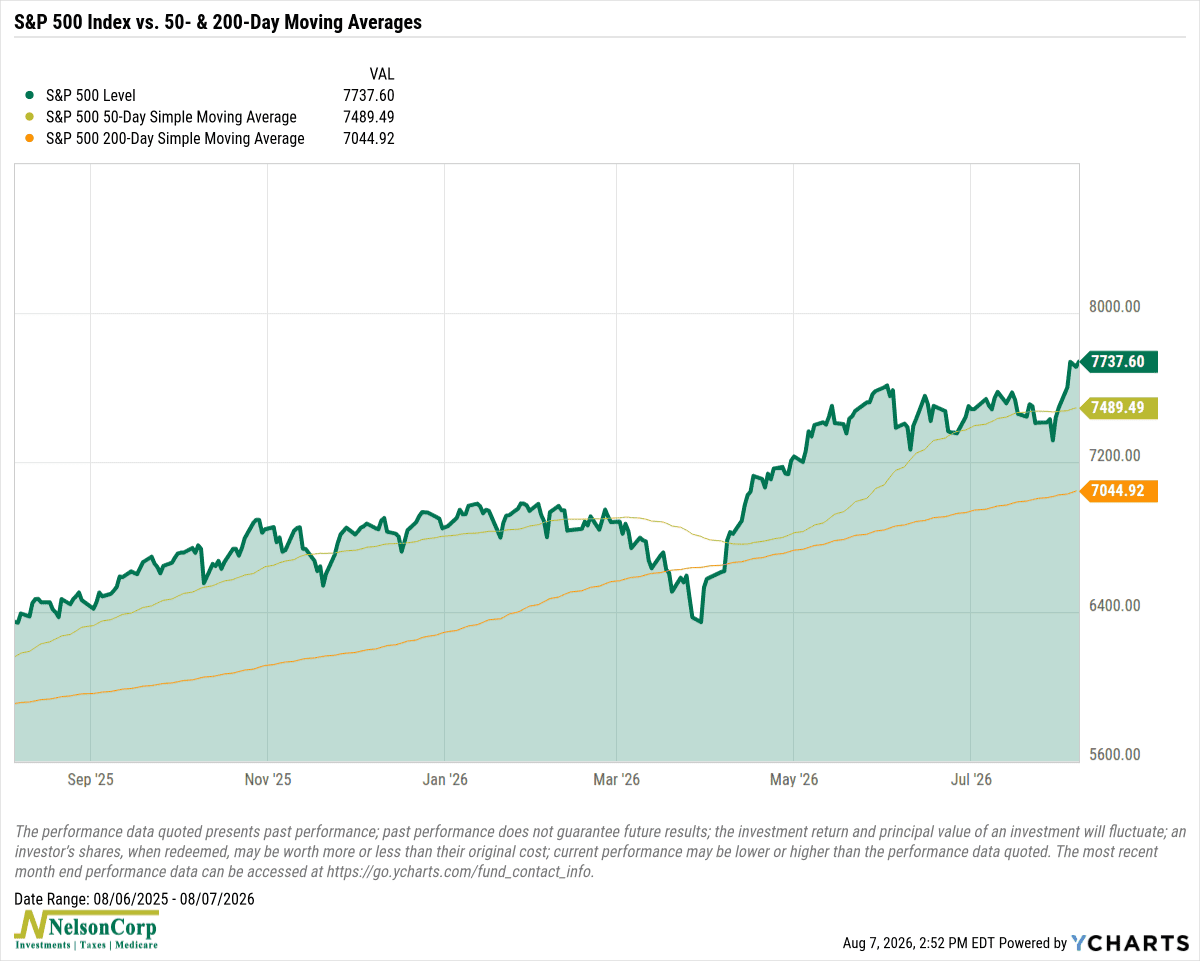
What’s going on? It seems weird, right? I mean, the latest jobs report showed that the U.S. economy actually lost 23,000 jobs in July.
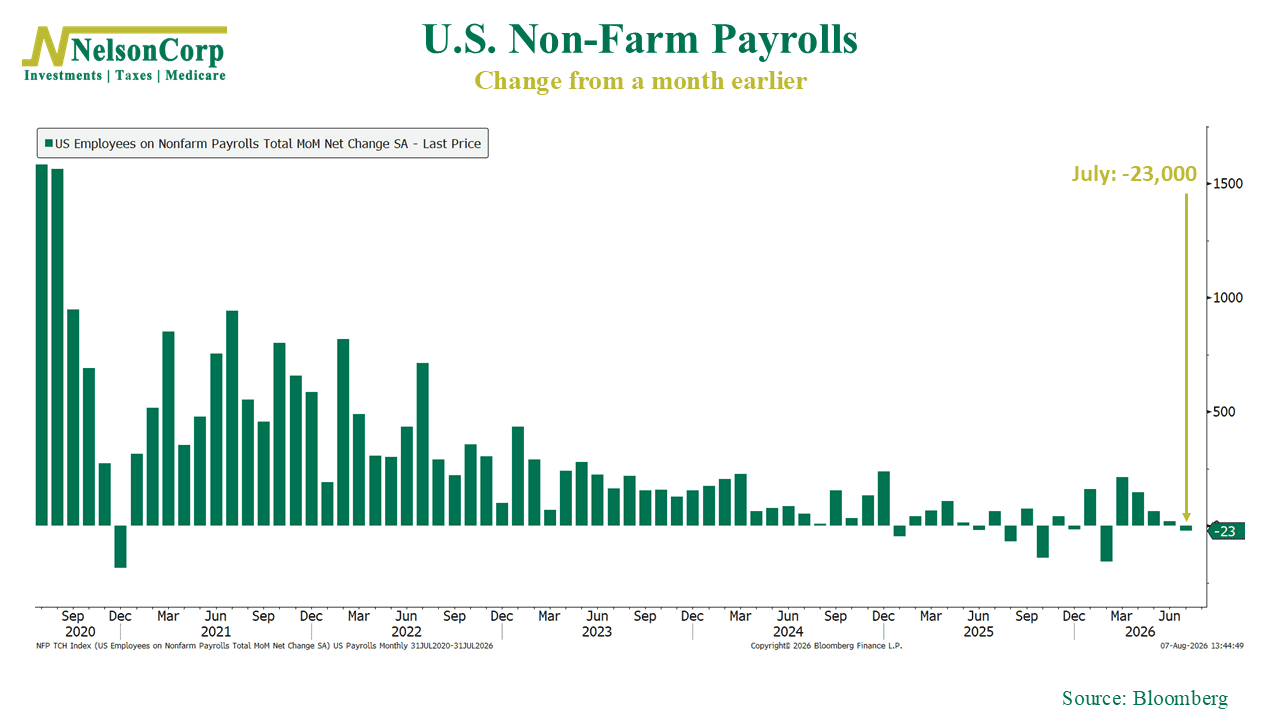
And our Long Exposure Risk Index, or LEXI, shown below, has fallen to 22.49, putting it below the 25 level that has historically been associated with poor stock returns.
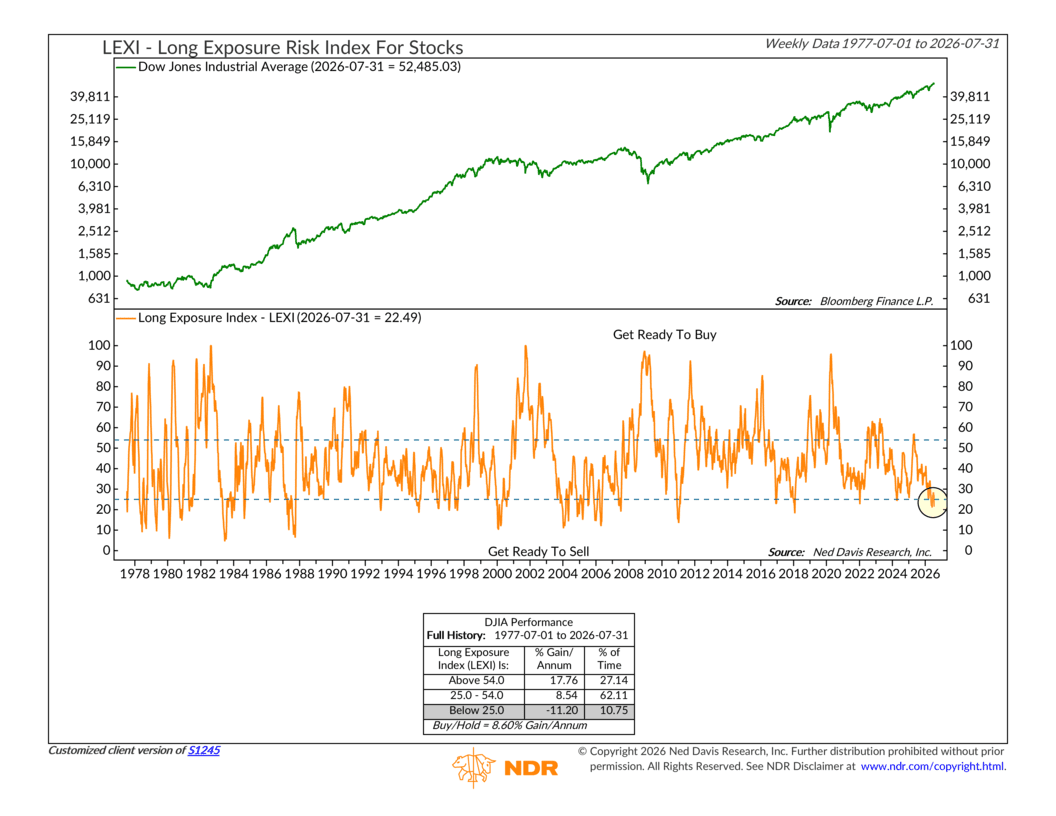
So why is the market seemingly ignoring the bad news?
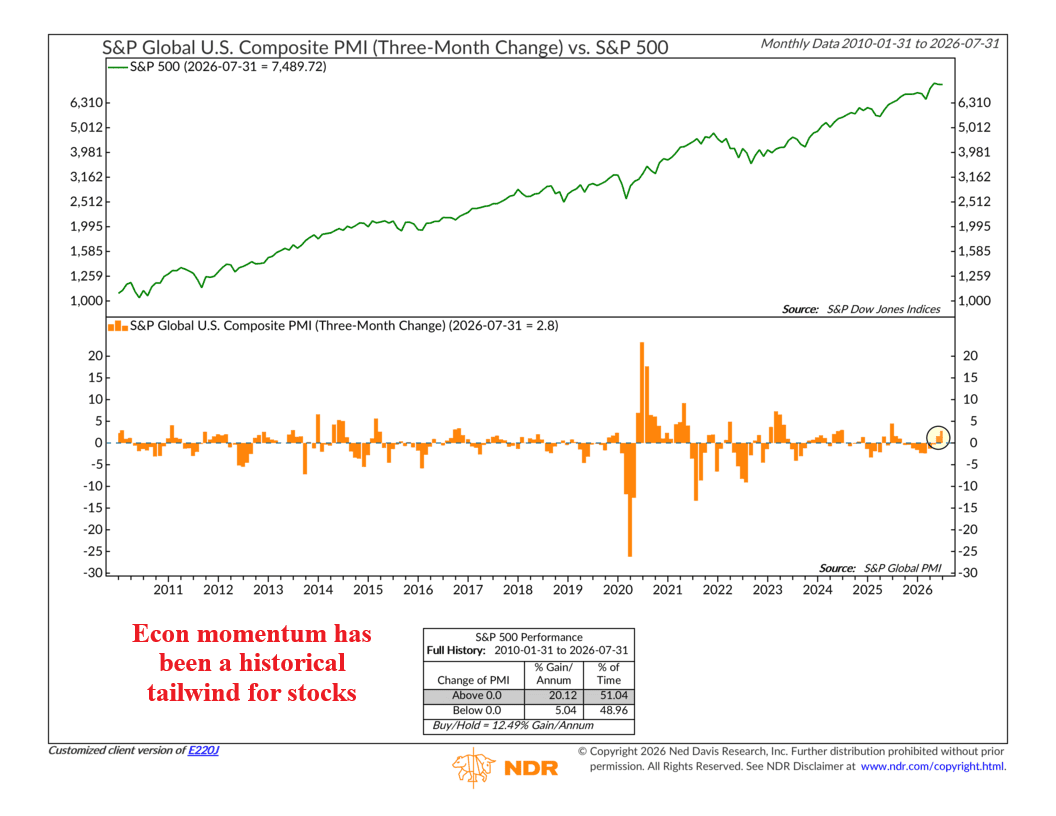
Well, part of the answer is that not all the news is bad. As we pointed out in this week’s featured indicator, economic momentum is actually proving to be a tailwind for stocks right now.
But perhaps more important is the fact that the stock market is forward-looking. Economic data tells us what has already happened, while stock prices reflect what investors expect to happen next. Something like a weaker jobs report matters, sure, but ultimately, stocks tend to care more about whether businesses can continue growing sales and earnings.
That is why we do not want to make too much of any one economic report or indicator. Instead, we look at the weight of the evidence.
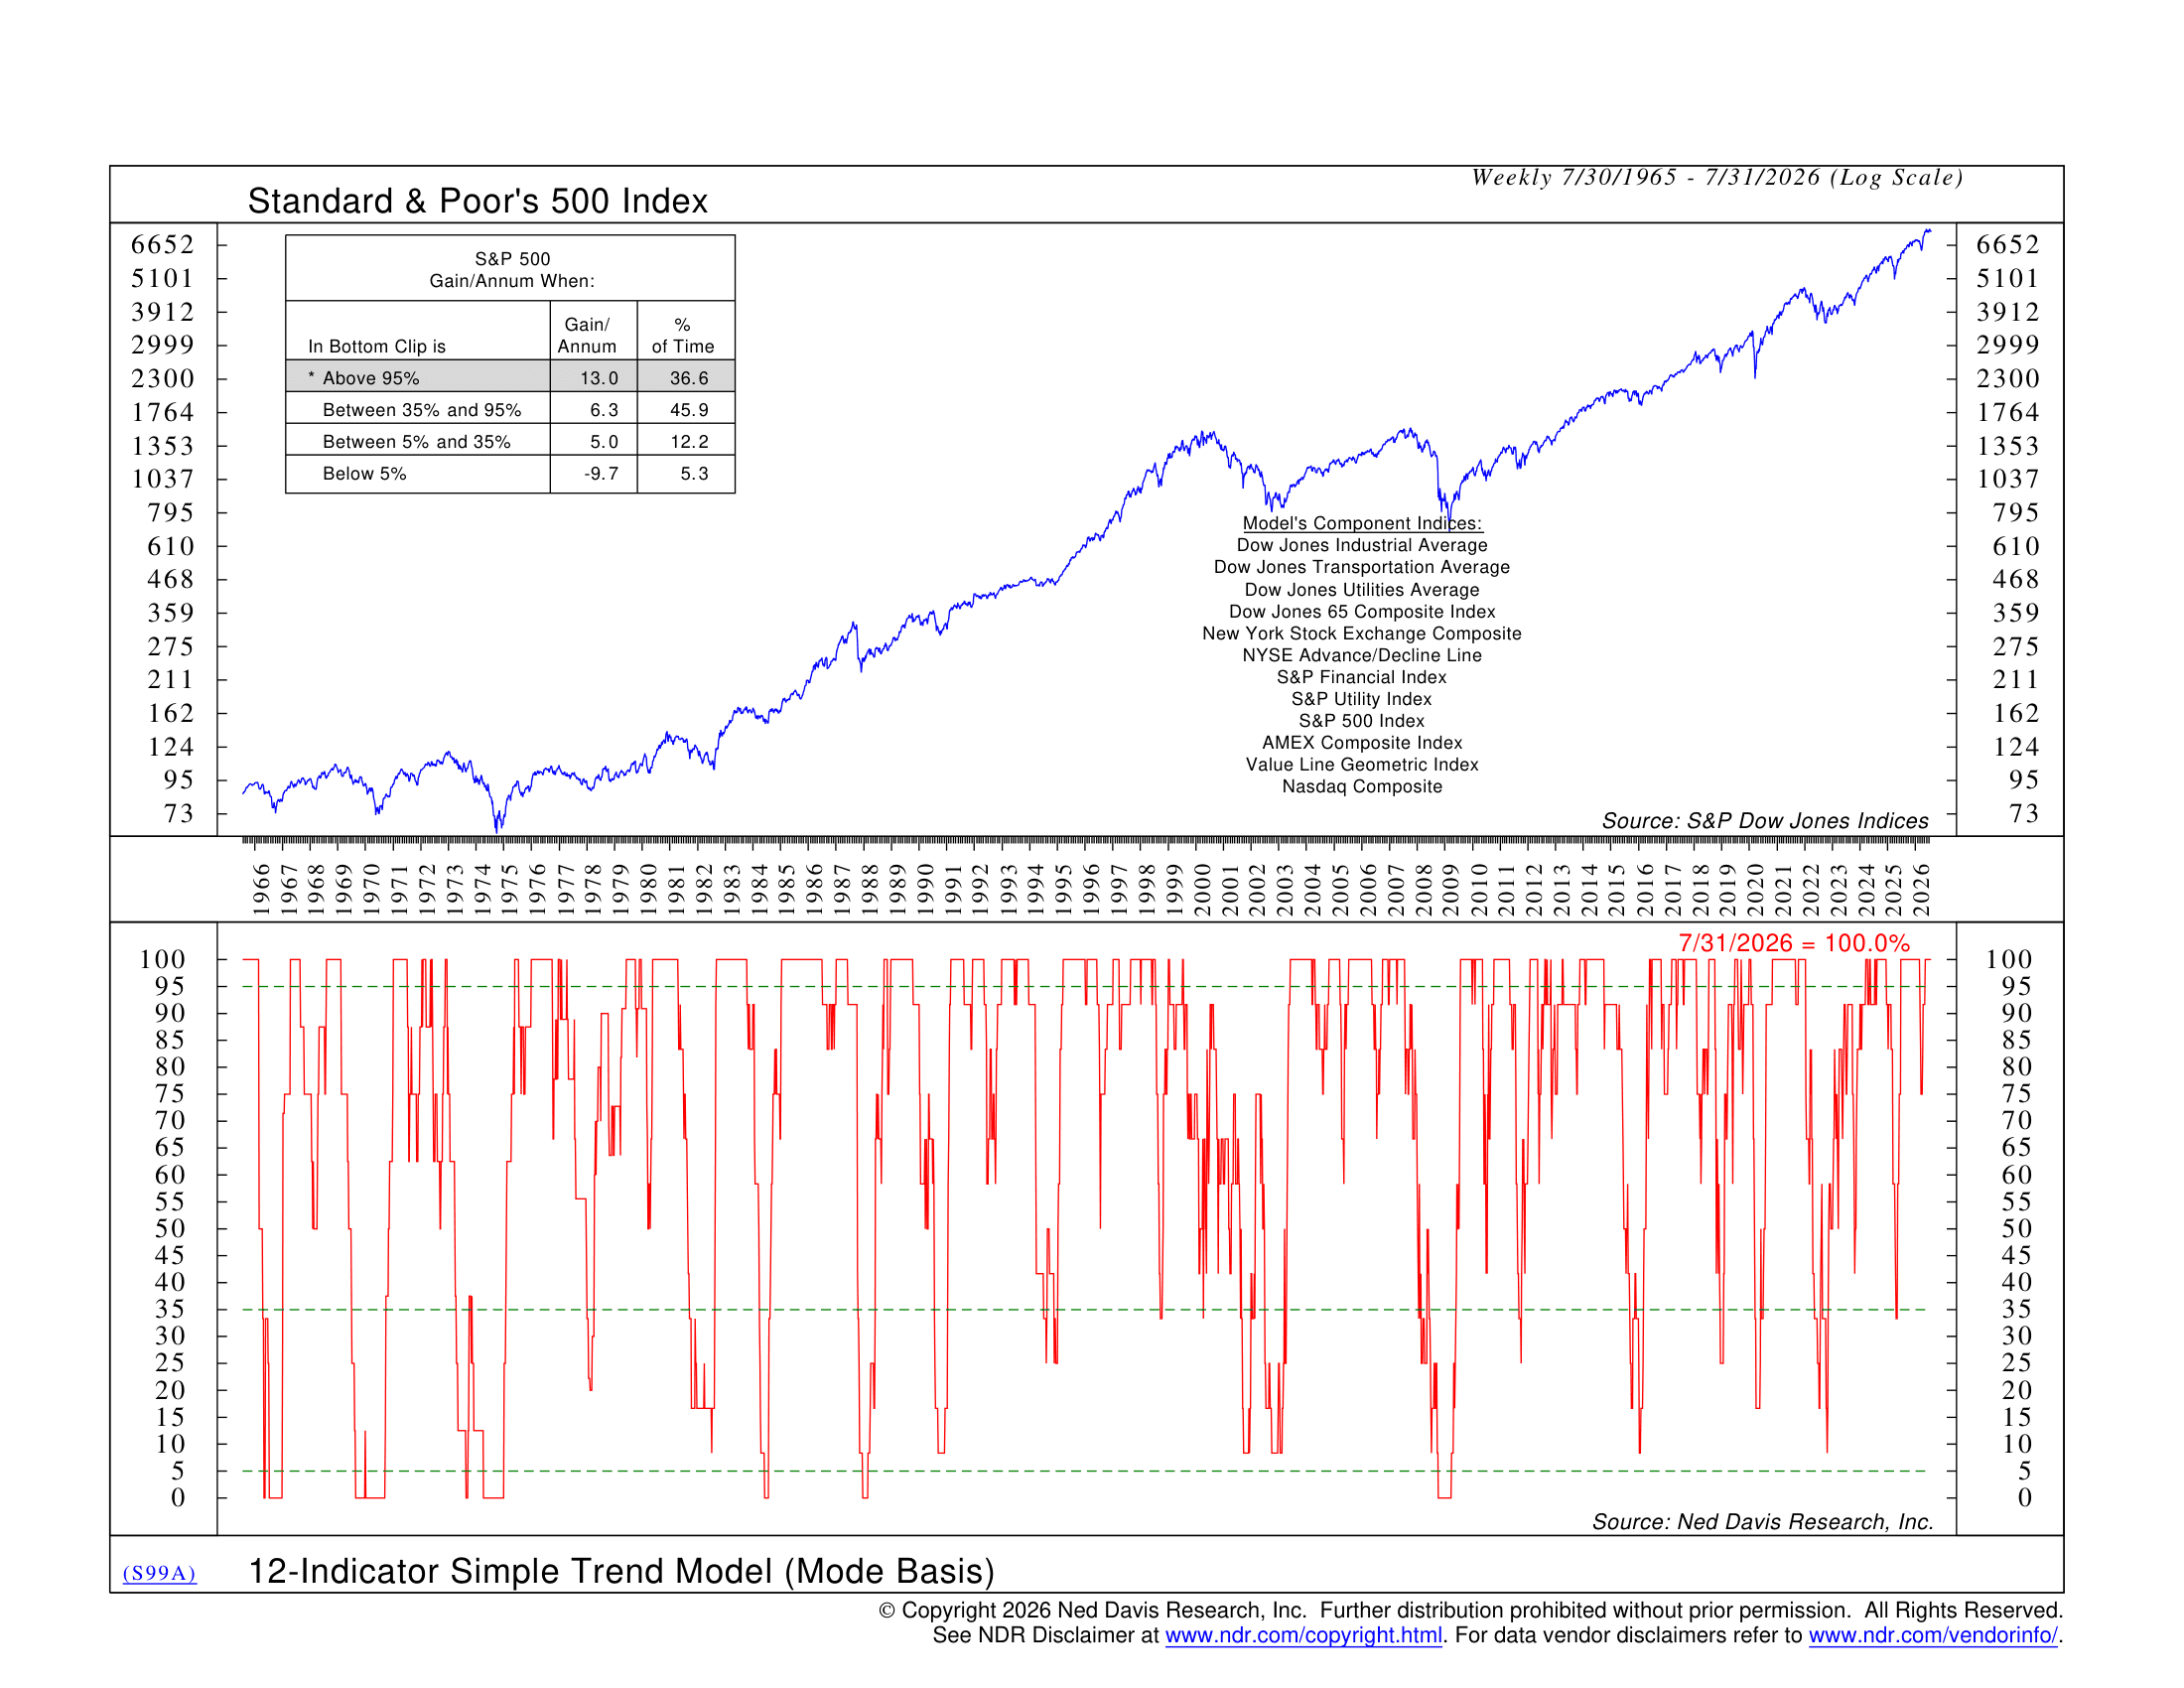
And right now, the broader market trend remains pretty darn strong. Our 12-Indicator Simple Trend Model (shown below) is currently 100% bullish, meaning all 12 of its underlying measures are in positive trends. Historically, when more than 95% of the model has been bullish, the S&P 500 has gained 13.0% per year on average—which, curiously enough, is just about where the S&P 500 currently stands year-to-date.
Additionally, volatility is moving in the right direction. After several elevated readings earlier this year, our measure of VIX volatility has fallen to 1.36 standard deviations below its 20-day average.
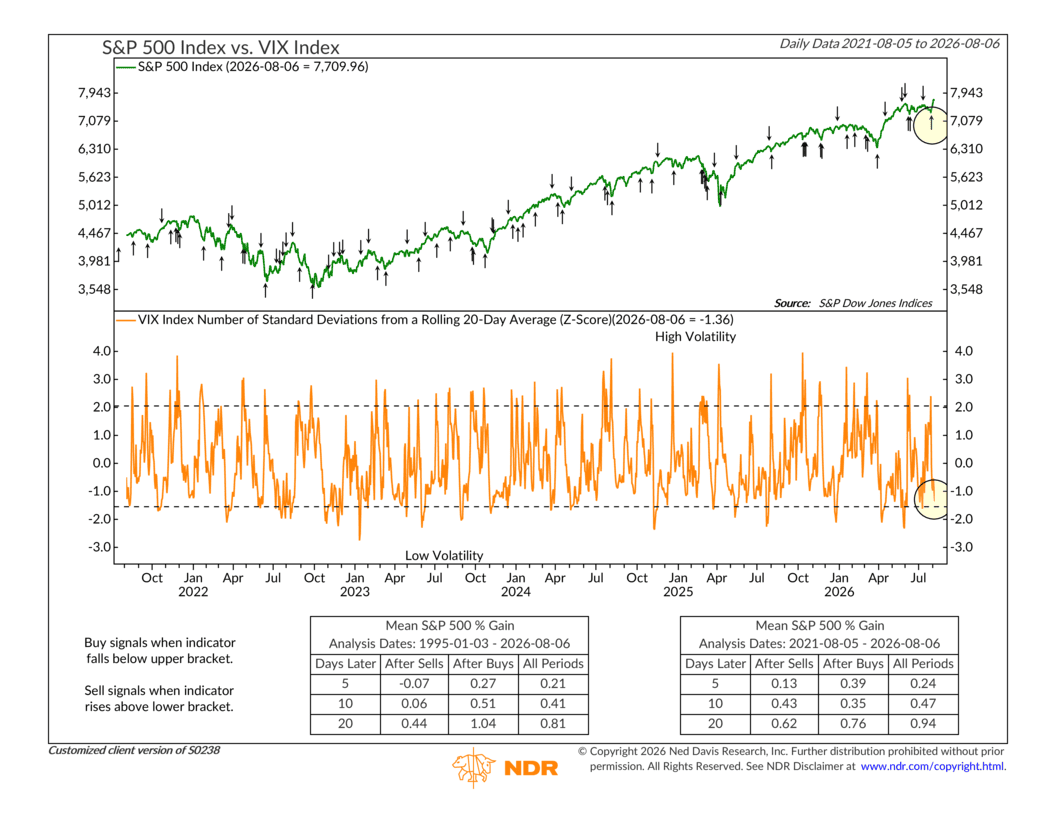
In other words, volatility has been settling down. Historically, these falling-volatility signals have tended to be followed by stronger stock returns.
Now, none of this means the weak labor market data or the LEXI warning should be dismissed. They are risks worth watching. But markets rarely wait until all the news is good before moving higher. In fact, by the time the economic headlines look perfect, stocks have often already priced much of that improvement in.
For now, the market appears willing to look through some bad news because the things that matter most for the trend remain supportive. Volatility is settling down, economic momentum is improving, and our trend model remains fully bullish.
The warning signs deserve our attention. But until they begin showing up more broadly in the market itself, the trend still gets the benefit of the doubt.
This is intended for informational purposes only and should not be used as the primary basis for an investment decision. Consult an advisor for your personal situation.
Indices mentioned are unmanaged, do not incur fees, and cannot be invested into directly.
Past performance does not guarantee future results.
The S&P 500 Index, or Standard & Poor’s 500 Index, is a market-capitalization-weighted index of 500 leading publicly traded companies in the U.S.
The Dow Jones Industrial Average (DJIA) is a price-weighted index composed of 30 widely traded blue-chip U.S. common stocks. The Nasdaq 100 Index is a basket of the 100 largest, most actively traded U.S. companies listed on the Nasdaq stock exchange. The index includes companies from various industries except for the financial industry, like commercial and investment banks. The Russell 3000 Index is a capitalization-weighted stock market index that seeks to be a benchmark of the entire U.S. stock market. The S&P MidCap 400 is designed to measure the performance of 400 mid-sized companies, reflecting the distinctive risk and return characteristics of this market segment. S&P 600 Index measures the small-cap segment of the U.S. equity market. The index is designed to track companies that meet specific inclusion criteria to ensure that they are liquid and financially viable. The S&P 100 index is a capitalization-weighted index based on 100 highly capitalized stocks for which options are listed on the CBOE (Chicago Board of Exchange). The MSCI EAFE Index is an equity index which captures large and mid cap representation across 21 Developed Markets countries* around the world, excluding the US and Canada.
The Bloomberg U.S. Corporate Bond Index measures the investment grade, fixed-rate, taxable corporate bond market. The Bloomberg U.S. Corporate High Yield Index is comprised of domestic and corporate bonds rated Ba and below with a minimum outstanding amount of $150 million. The Bloomberg U.S. Municipal Index covers the USD-denominated long-term tax exempt bond market. The index has four main sectors: state and local general obligation bonds, revenue bonds, insured bonds and prerefunded bonds.