OVERVIEW
Markets advanced last week, with solid gains across major equity benchmarks. The S&P 500 rose 1.09%, while the Dow added 1.10%. The NASDAQ led the pack with a 1.32% gain. Broad measures were similarly strong, as the Russell 3000 climbed 1.09%. Growth stocks (+0.86%) slightly outpaced value (+1.01%), extending their modest year-to-date edge.
By size, small caps stood out, with the S&P 600 jumping 1.27%, while mid-caps (S&P 400) rose 0.65% and large caps (S&P 100) advanced 0.89%. International markets were even stronger. Developed markets (EAFE) surged 2.50%, and emerging markets soared 3.64%, bringing their year-to-date gains near 28%.
Bond markets also participated in the rally. Short-term Treasuries gained 0.08%, while intermediate and long-term Treasuries rose 0.38% and 0.82%, respectively. Investment-grade corporates added 0.57%, high yield bonds increased 0.23%, and municipals edged up 0.11%.
Commodities were mixed. Gold jumped 2.62%, extending its impressive year-to-date climb above 48%, while oil tumbled 6.89% and corn slipped 0.71%. Broad commodities rose 0.24%, and real estate gained 0.44%, but MLPs lagged with a 2.27% drop.
The U.S. dollar weakened 0.40%, while volatility spiked, with the VIX climbing 8.89%.
KEY CONSIDERATIONS
In the Eye of the Beholder – Here’s a fascinating chart I came across this week. It compares a wide range of stock market valuation metrics against their historical averages. (A valuation metric is simply a way to judge whether the market looks cheap, expensive, or fairly priced relative to some measure like earnings, sales, or GDP).
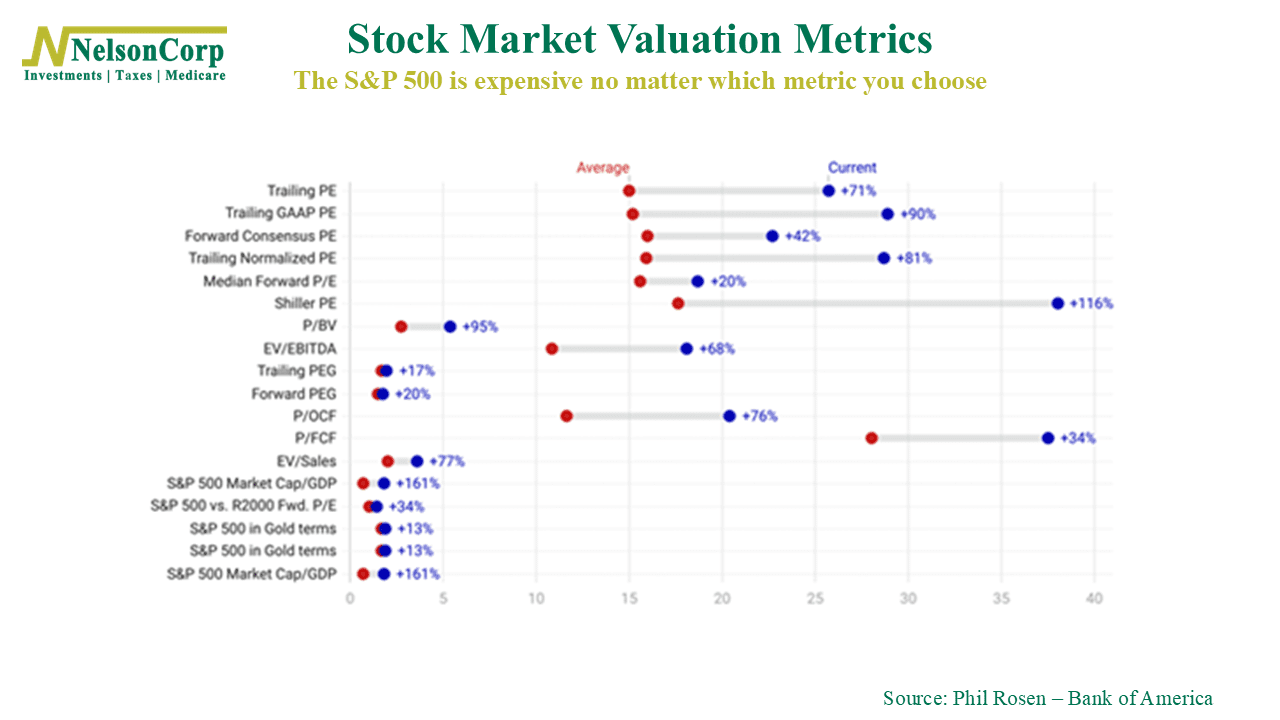
The red dots are the average, and the blue dots are the current reading. As you can see, by every single metric—from P/E to market cap-to-GDP—the stock market is very overvalued relative to history. In other words, the stock market is expensive.
But, as the old saying goes, beauty is in the eye of the beholder—and it’s no different for the stock market. In fact, it’s even more than that. The economist John Maynard Keynes once famously likened investing to a newspaper beauty contest, where the winner isn’t the one who picks their personal favorite, but the one who best guesses which face everyone else will choose.
In other words, Keynes argued that the stock market isn’t just about finding the “best” companies (the prettiest faces). Instead, investors try to guess what everyone else will think is best. That creates layers of expectation, where people buy not what they value, but what they think others will value.
So, when we look at metrics like P/E ratios, price-to-sales, or market cap to GDP, the numbers are objective, but the interpretation isn’t.
One investor sees a P/E of 30 and says, “That’s wildly expensive.”
Another says, “Not if growth keeps compounding—it’s cheap in context.”
And a third might say, “It doesn’t matter what I think. The market will keep paying this multiple as long as others believe in the story.”
This is also why we don’t base strategic decisions on valuation alone. We measure it, and it matters, but it’s only one piece of the bigger picture. The more important piece is price itself. Price action tells us how investors are interpreting valuations in real time—what they’re actually willing to pay.
In practice, we call this “the trend.” If the trend is strong, valuations aren’t really going to help us much. Here’s what our Trend Composite looks like right now:
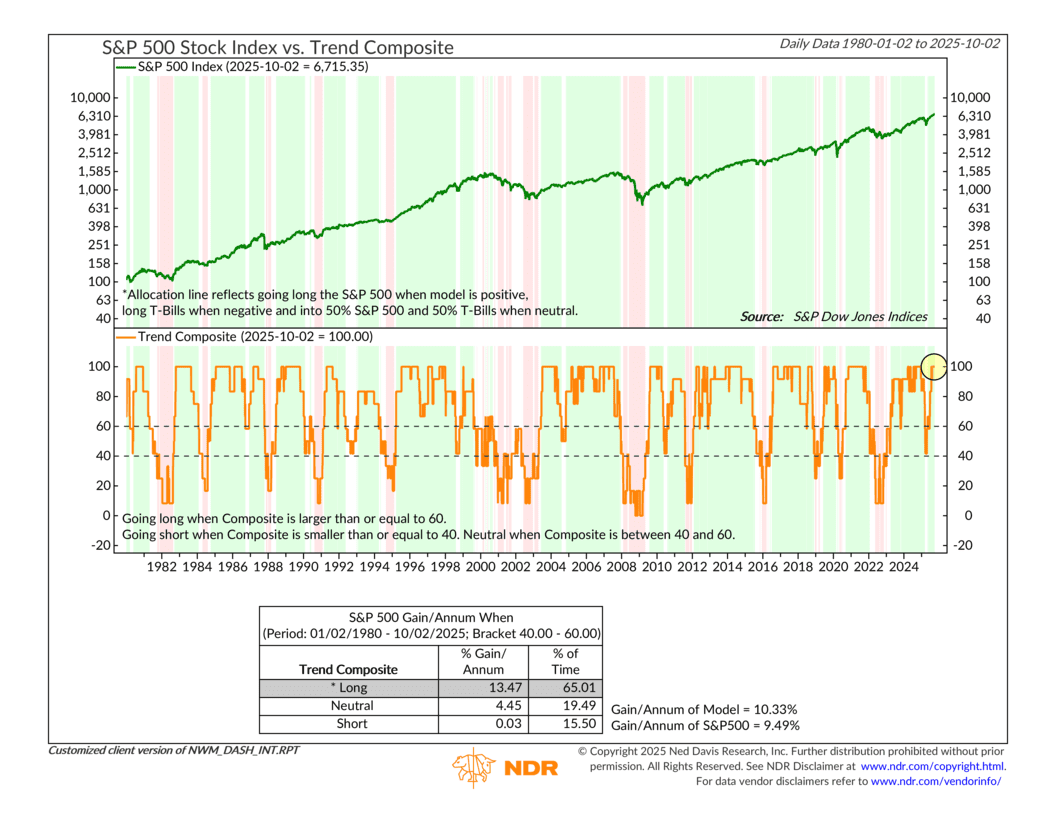
Yep, that’s pretty bullish. All six trend indicators that we track are pointing to an upwards trending market.
But if the trend breaks down, those lofty valuations suddenly become much more important. Without strong price support, extreme valuations can quickly turn into a reason to sell, not buy.
The bottom line is that valuation metrics tell us the market is expensive right now, but the trend tells us it’s still moving higher. Both matter, but it’s the trend that is actually driving the ship at this time.
This is intended for informational purposes only and should not be used as the primary basis for an investment decision. Consult an advisor for your personal situation.
Indices mentioned are unmanaged, do not incur fees, and cannot be invested into directly.
Past performance does not guarantee future results.
The S&P 500 Index, or Standard & Poor’s 500 Index, is a market-capitalization-weighted index of 500 leading publicly traded companies in the U.S.
The Dow Jones Industrial Average (DJIA) is a price-weighted index composed of 30 widely traded blue-chip U.S. common stocks. The Nasdaq 100 Index is a basket of the 100 largest, most actively traded U.S. companies listed on the Nasdaq stock exchange. The index includes companies from various industries except for the financial industry, like commercial and investment banks. The Russell 3000 Index is a capitalization-weighted stock market index that seeks to be a benchmark of the entire U.S. stock market. The S&P MidCap 400 is designed to measure the performance of 400 mid-sized companies, reflecting the distinctive risk and return characteristics of this market segment. S&P 600 Index measures the small-cap segment of the U.S. equity market. The index is designed to track companies that meet specific inclusion criteria to ensure that they are liquid and financially viable. The S&P 100 index is a capitalization-weighted index based on 100 highly capitalized stocks for which options are listed on the CBOE (Chicago Board of Exchange). The MSCI EAFE Index is an equity index which captures large and mid cap representation across 21 Developed Markets countries* around the world, excluding the US and Canada.
The Bloomberg U.S. Corporate Bond Index measures the investment grade, fixed-rate, taxable corporate bond market. The Bloomberg U.S. Corporate High Yield Index is comprised of domestic and corporate bonds rated Ba and below with a minimum outstanding amount of $150 million. The Bloomberg U.S. Municipal Index covers the USD-denominated long-term tax exempt bond market. The index has four main sectors: state and local general obligation bonds, revenue bonds, insured bonds and prerefunded bonds.