OVERVIEW
Markets pushed higher last week, fueled by broad-based strength across stocks and bonds. The S&P 500 rose 1.46%, while the Dow added 1.26%. The NASDAQ gained 1.02%, continuing its steady climb. Mid- and small-cap stocks also advanced, with the S&P 400 up 1.47% and the S&P 600 rising 0.92%. Leadership tilted toward value, as the Russell 3000 Value Index jumped 1.60%, outpacing Growth at 1.22%.
International stocks joined the party. Developed markets (EAFE) rallied 1.91%, and emerging markets added 0.67%, helped in part by a weaker U.S. dollar, which slipped 0.84% on the week.
Bonds posted a quiet but steady advance. Long-term Treasuries rose 1.32%, and intermediate-term Treasuries tacked on 0.33%. Investment-grade corporates gained 0.56%, high yield rose 0.35%, and munis edged up 0.37%—not flashy, but moving in the right direction.
Commodities couldn’t keep pace. Oil fell 1.42%, gold dipped 0.63%, and corn slid 2.20%. But real estate offered a bright spot, climbing nearly 2% for the week. Meanwhile, volatility took another step back, with the VIX continuing its summer slide.
KEY CONSIDERATIONS
Inflation Talk – Here’s an interesting chart I came across this week. It’s a Bloomberg analysis of S&P 500 earnings transcripts, showing how often inflation is mentioned on corporate calls. As you can see, it’s dropped to the lowest level since early 2021—a four-year low!
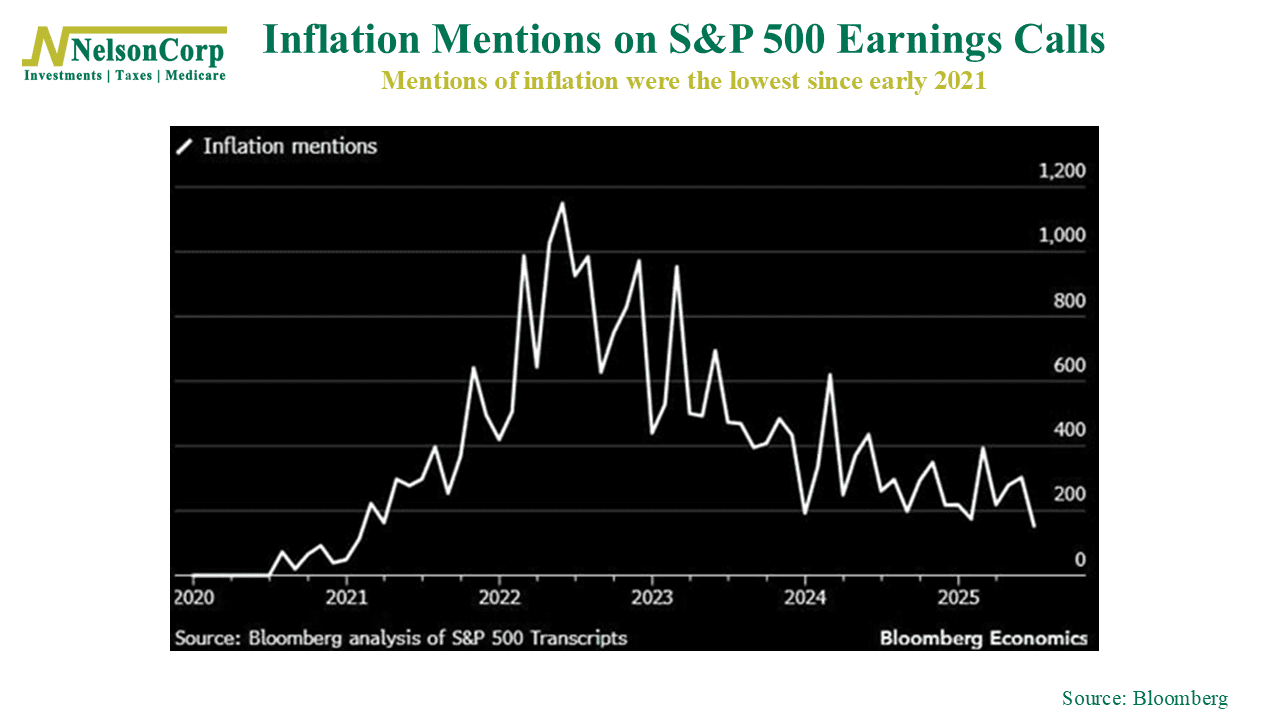
So after years of headlines dominated by rising costs and price pressures, it looks like inflation is no longer such a big deal in corporate boardrooms.
But if companies aren’t worried about inflation, should you be?
To answer that, let’s turn to our go-to inflation indicator: the Consumer Price Index (CPI) relative to its five-year moving average. Rather than zeroing in on the headline inflation number, this indicator puts current price pressures into historical context, by comparing it to its recent (5-year) history.
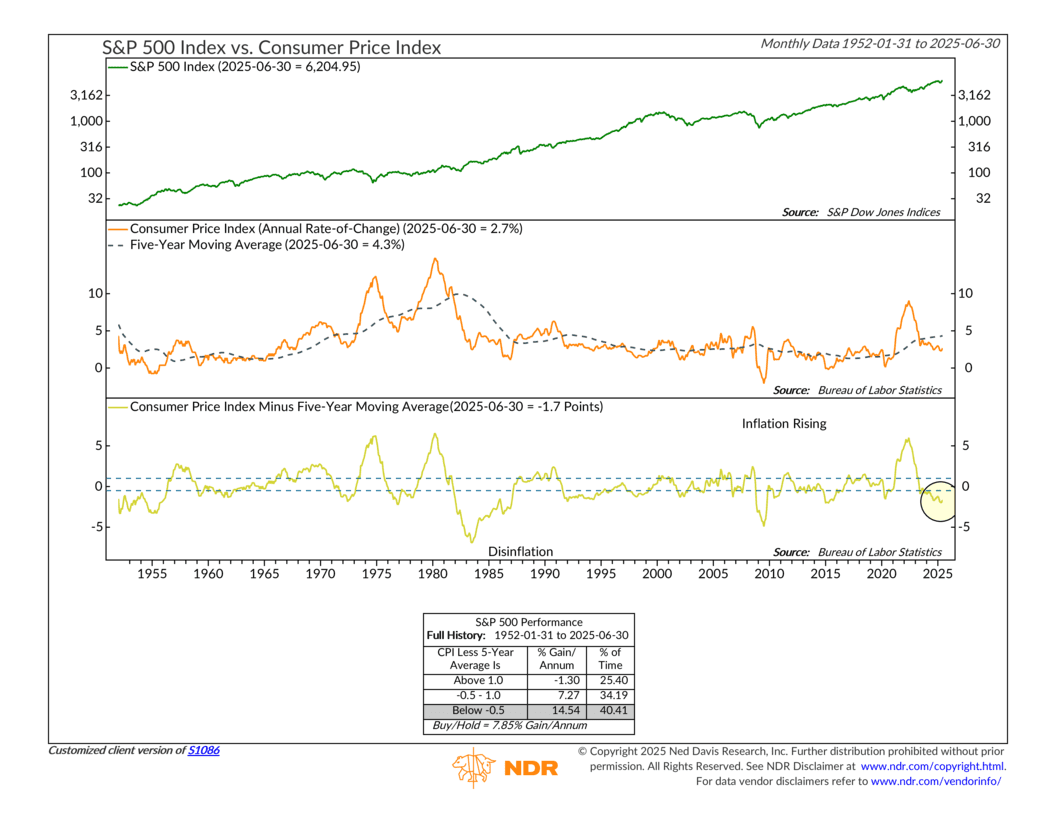
So what’s it saying? Well, the data show that inflation has cooled considerably from its 2022 peak and is now running below its 5-year trend. According to the indicator, when the CPI is more than half a percentage point below its 5-year average, the S&P 500 has delivered annualized returns north of 14%. In other words: bullish.
Of course, this is something we’ll want to keep an eye on. If inflation heats up again, it would have to rise enough to push this indicator into bearish territory before we’d view it as a serious threat to the market.
But the bottom line is that companies aren’t talking about inflation much anymore, and the data suggests that may be warranted. With CPI running below trend and historical returns looking strong in similar environments, the current backdrop continues to support a bullish case for stocks—at least from an inflation standpoint.
This is intended for informational purposes only and should not be used as the primary basis for an investment decision. Consult an advisor for your personal situation.
Indices mentioned are unmanaged, do not incur fees, and cannot be invested into directly.
Past performance does not guarantee future results.
The S&P 500 Index, or Standard & Poor’s 500 Index, is a market-capitalization-weighted index of 500 leading publicly traded companies in the U.S.