OVERVIEW
KEY CONSIDERATIONS
Is the First Cut the Deepest? – A famous song once said that the first cut is the deepest. Last week, the stock market took one of those first deep cuts. The S&P 500 fell 4.4% on Thursday, its worst one-day drop since the tariff selloff in April 2025.
So, the natural next question is, what does that deep cut mean going forward?
Well, first, let’s back up a bit. Remember, stocks rallied Wednesday on the election results. The Dow had its best post-midterm day since 1982, and the average stock (the equal-weight S&P 500) closed at a new high for the year. But then on Thursday the AI trade broke. Worries that the new Congress will slow the data center build-out, plus forced selling by big funds, sent the semiconductor chip index down 12%, the Nasdaq-100 down 6%, and all 11 S&P 500 sectors lower. Sure, Friday’s strong jobs report helped stocks bounce a bit, but it also raised the odds of a December rate hike.
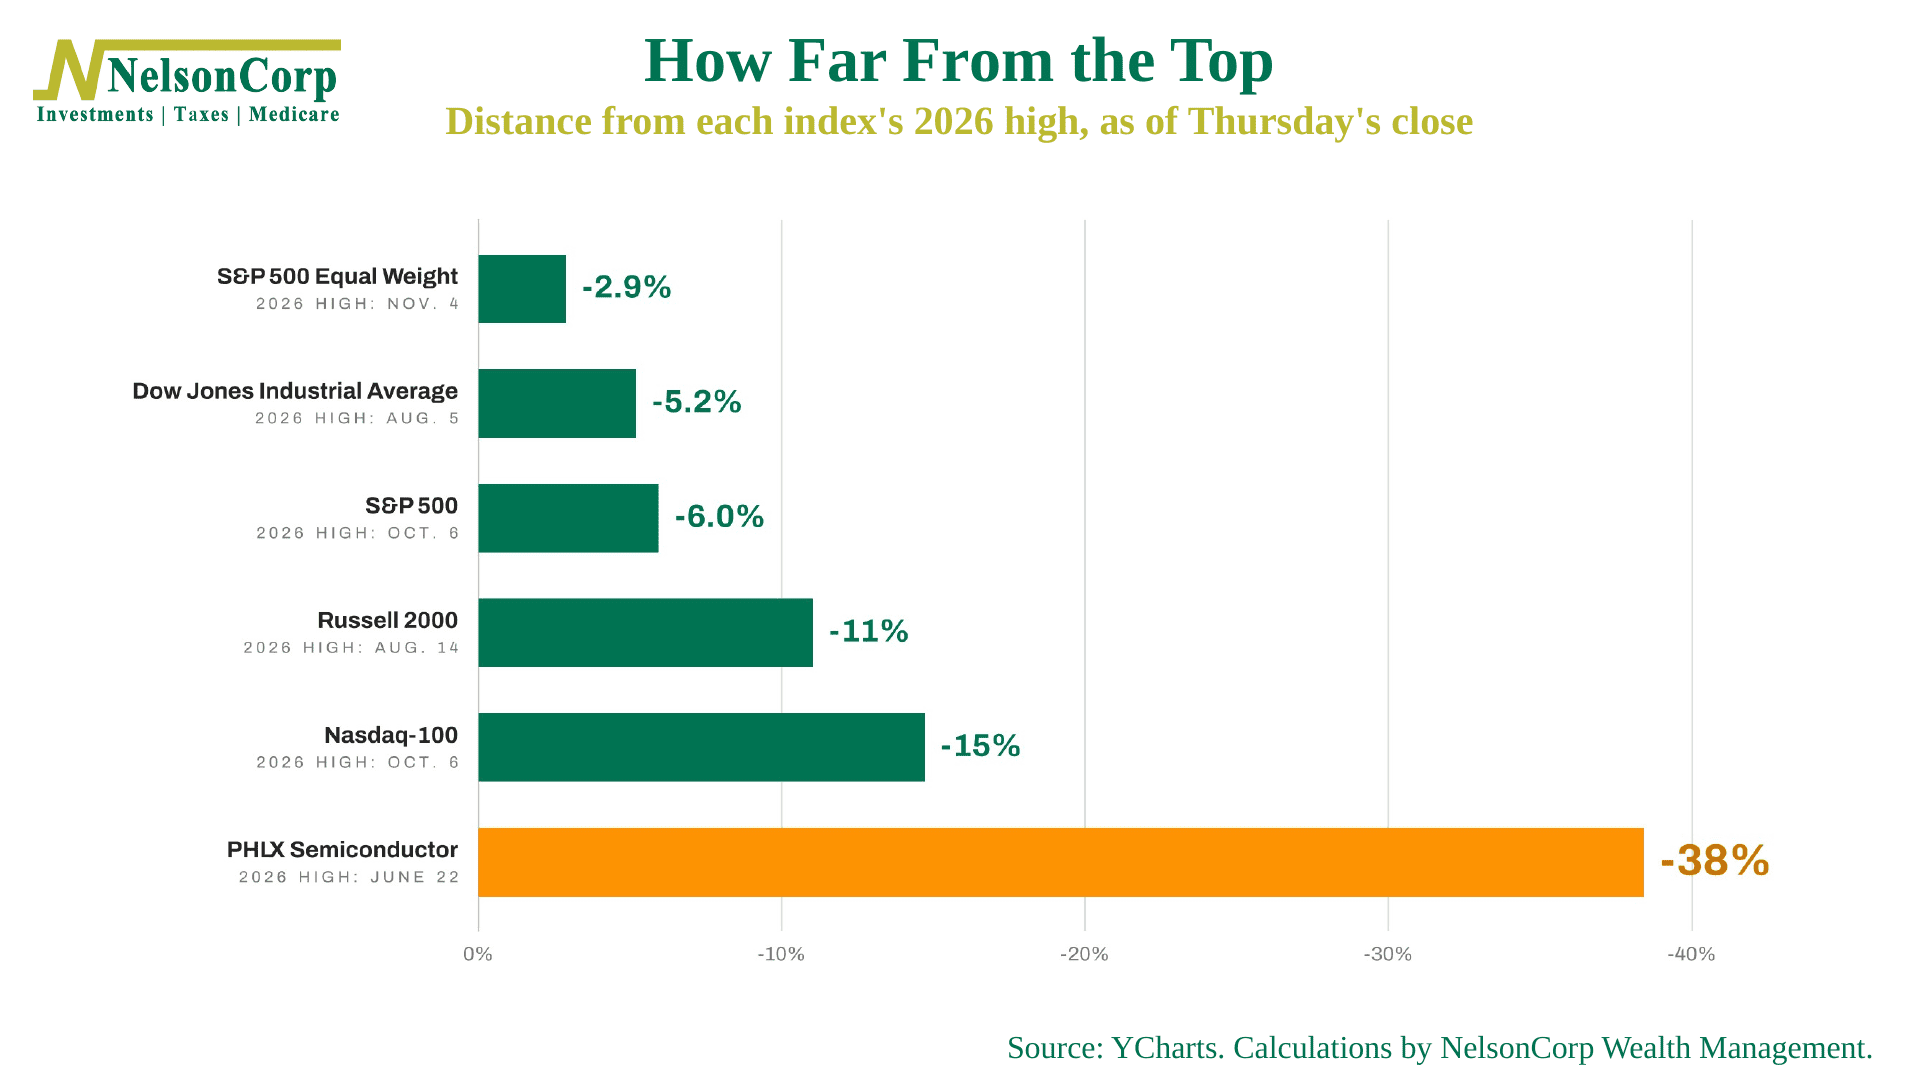
Now, at first glance, this selloff might appear to be a surprise. But here’s the thing: the weakness didn’t just start Thursday. This first chart shows how far each index had fallen from its 2026 high by Thursday’s close. The average stock was 3% off its peak and the S&P 500 6% off, but the Nasdaq-100 was already down 15%, and the chip index was already 38% below its June high. In other words, the cut had been getting deeper for some time now in many parts of the market.
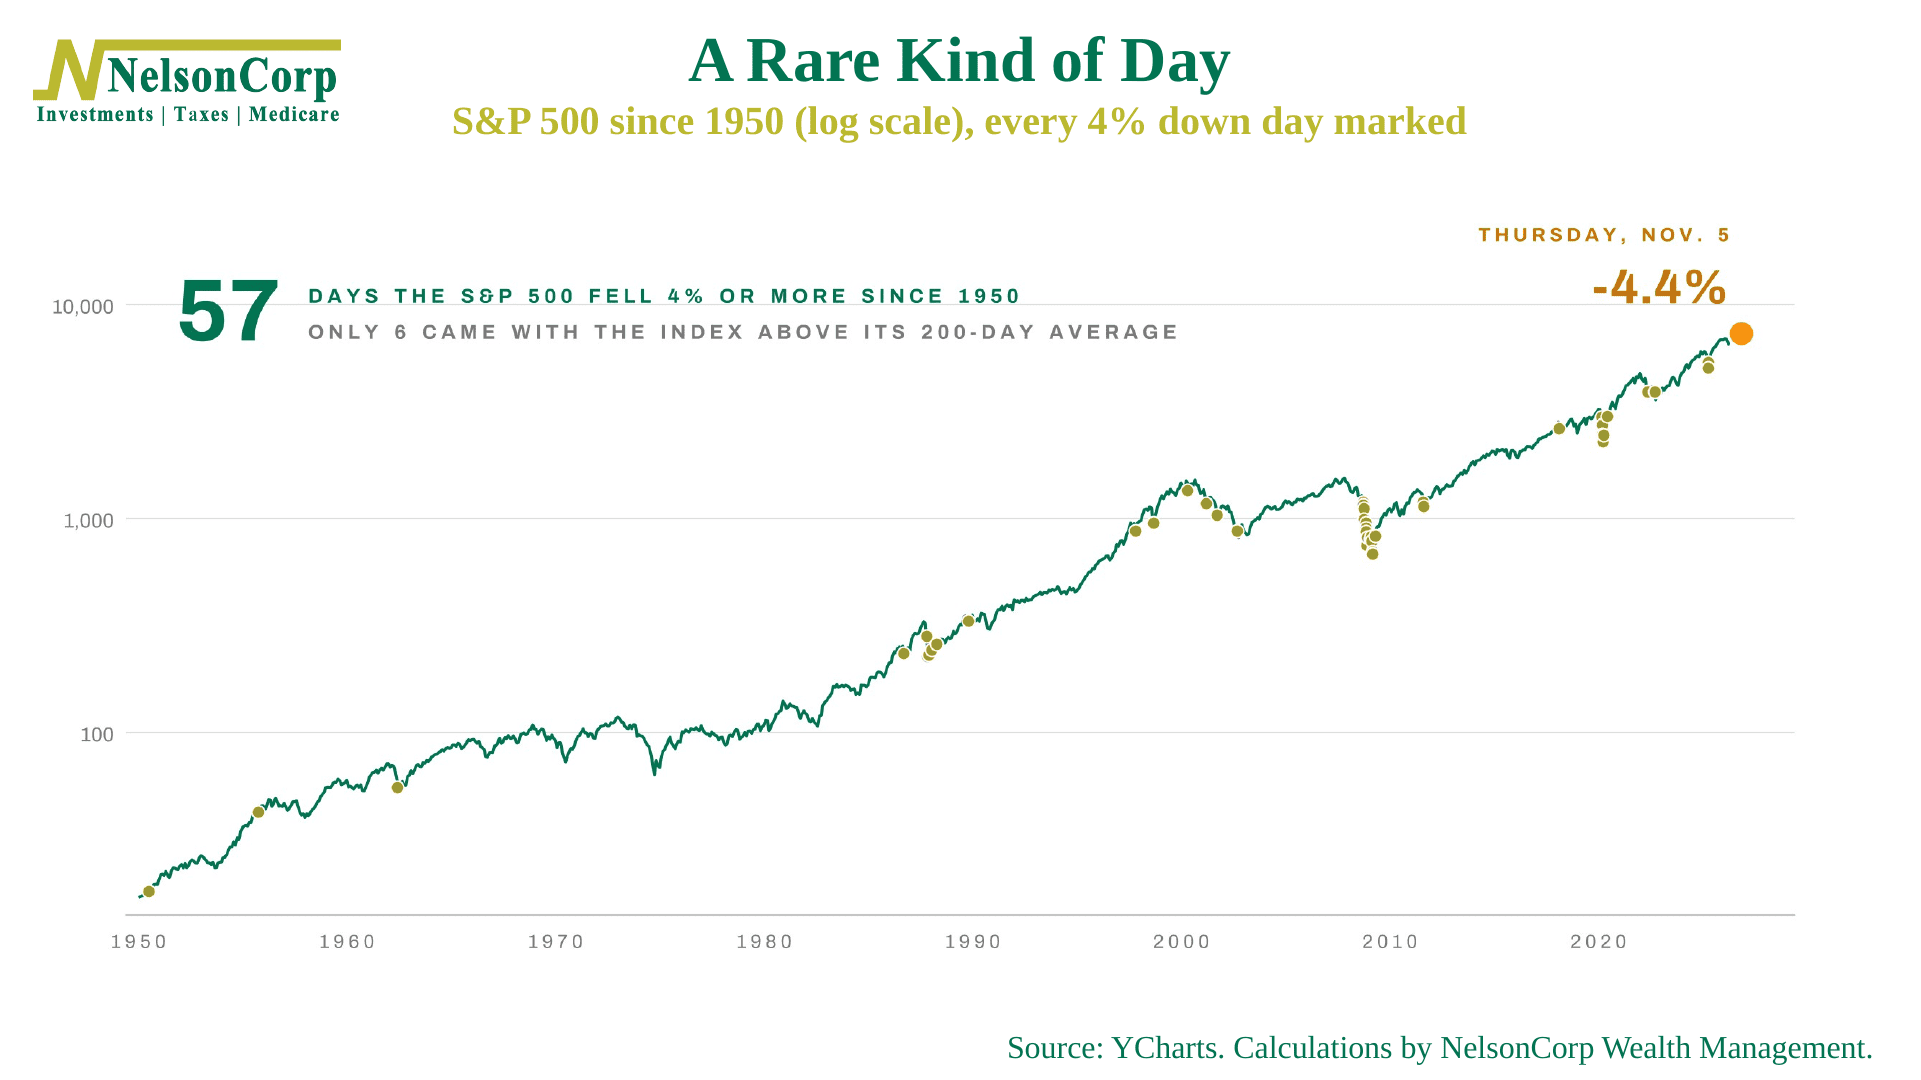
Thursday was still pretty unusual, though. Since 1950, the S&P 500 has fallen 4% or more in a day just 57 times. Look at where the dots land on this second chart: almost all of them are at the bottom of bear markets, like 1987, 2008 and 2020, when prices were already down 20% or more. As you can see, Thursday’s dot sits near the top. Only six of the 57 came with the index still above its 200-day average, and Thursday was one of them.
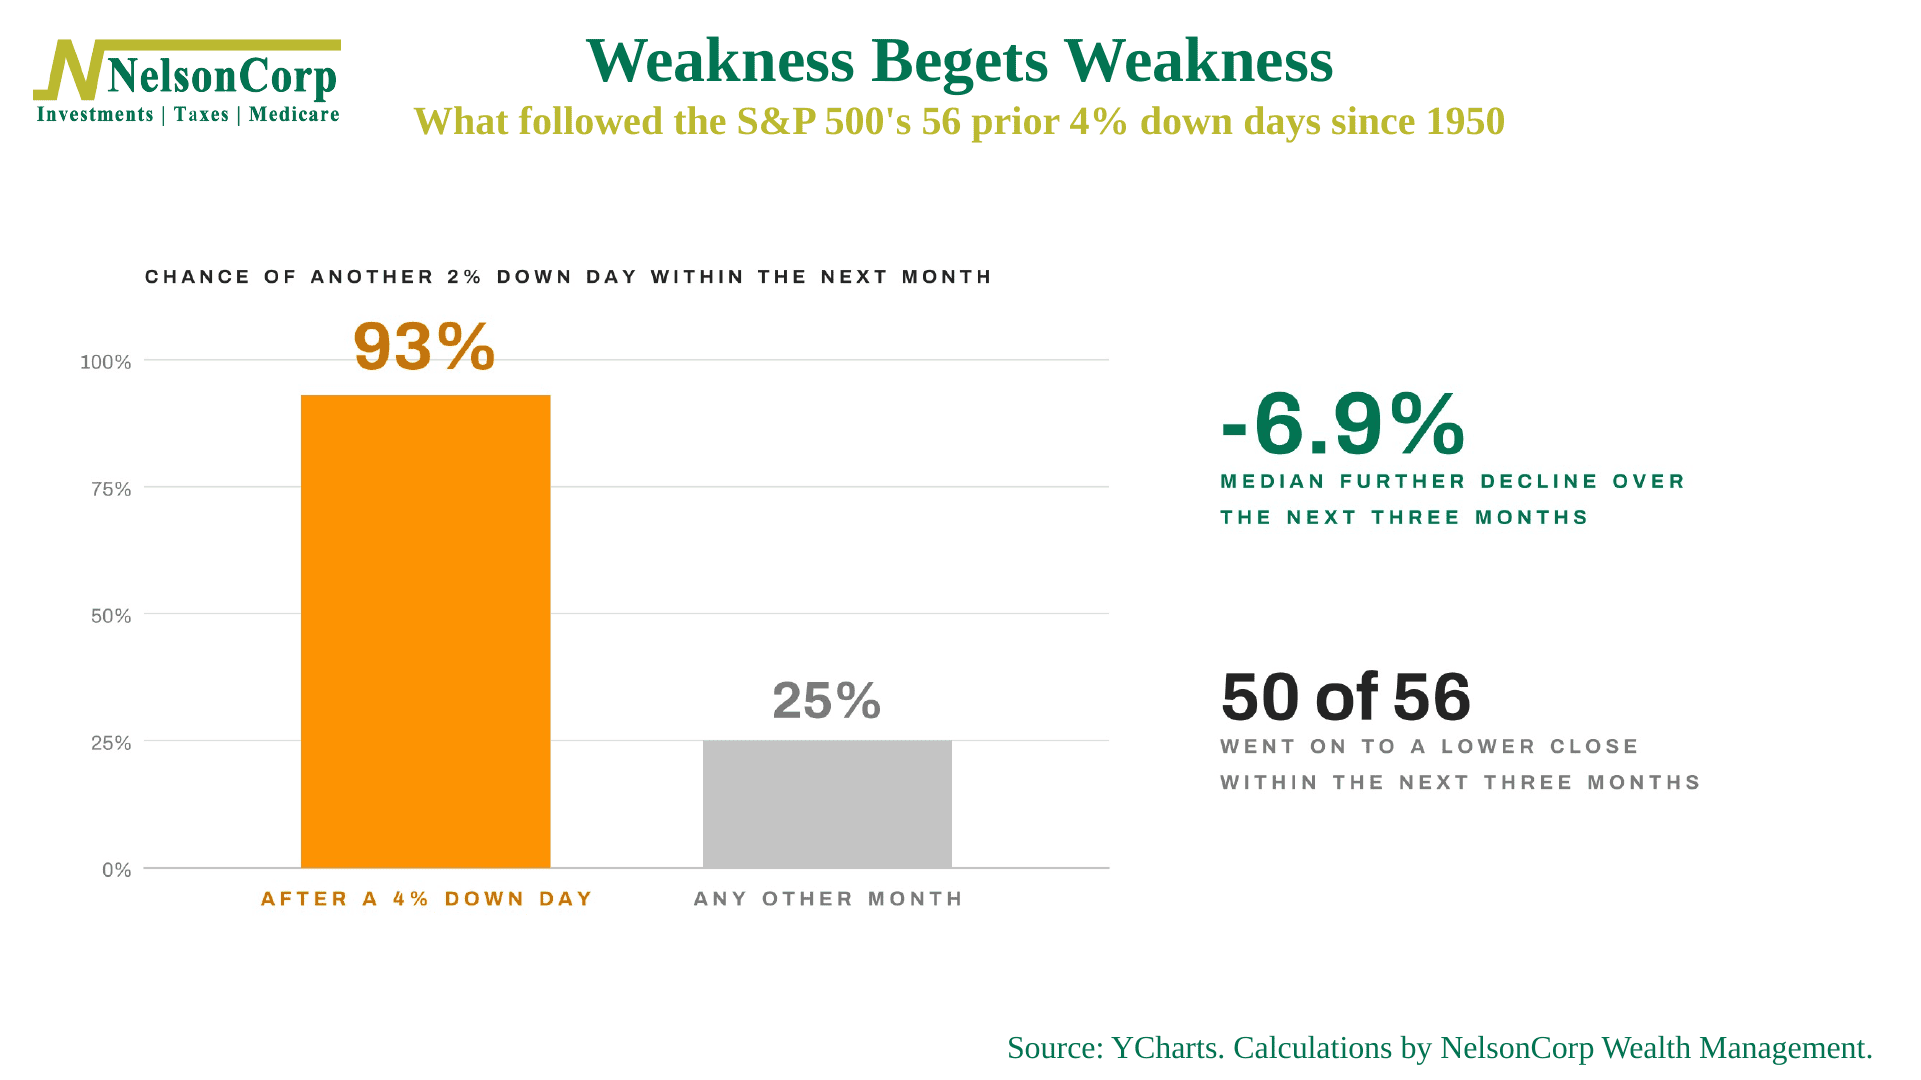
Which brings me to the question in the title. Is the first cut really the deepest? History says: usually not. After the 56 prior 4% days, another 2% down day followed within a month 93% of the time, versus 25% for a typical month, and 50 of the 56 closed lower at some point in the next three months, by a median of 6.9%. Basically, the data say weakness begets weakness.
Wall Street’s fear gauge is also saying the same thing. The VIX closed at 28.2 on Thursday, its highest since March, and above the 27 line that sits one standard deviation above its long-run average—basically, the line between ordinary jitters and real stress. Thursday was the 23rd time it has crossed that line since 1990.
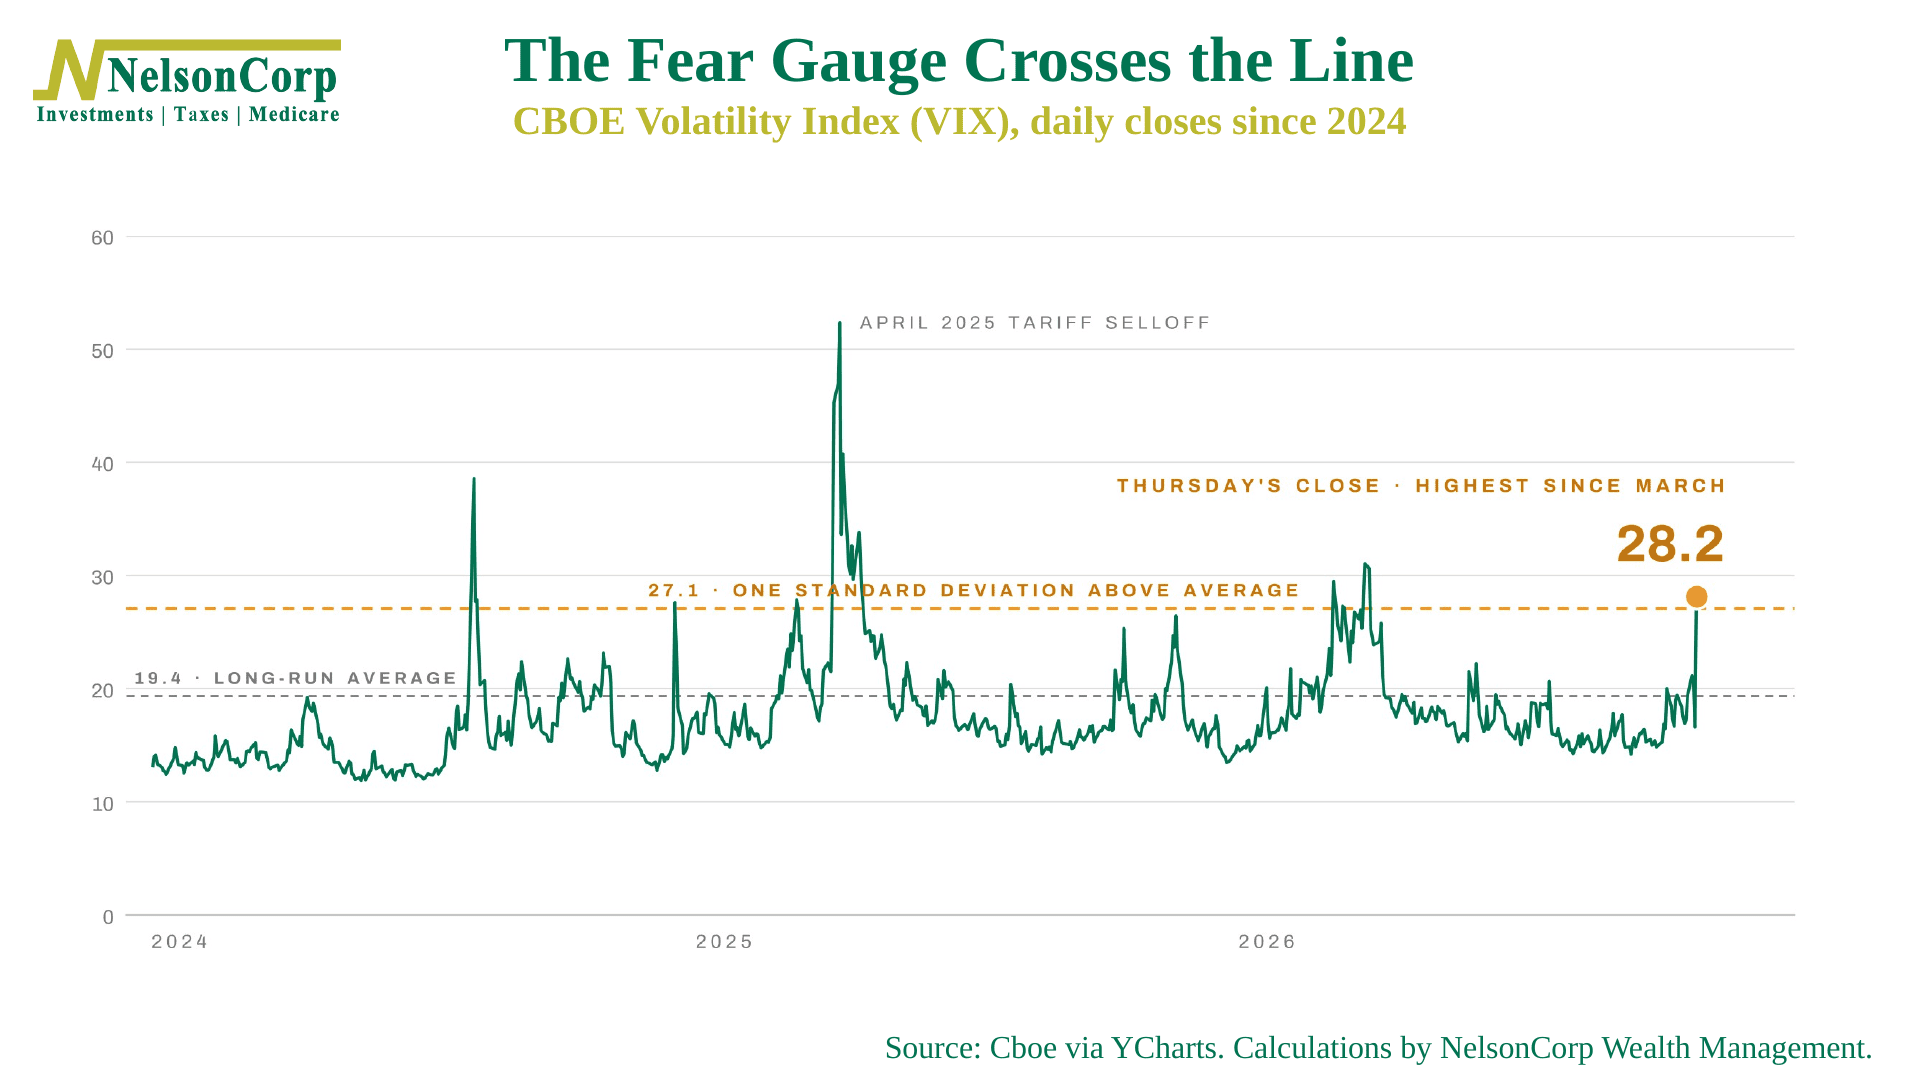
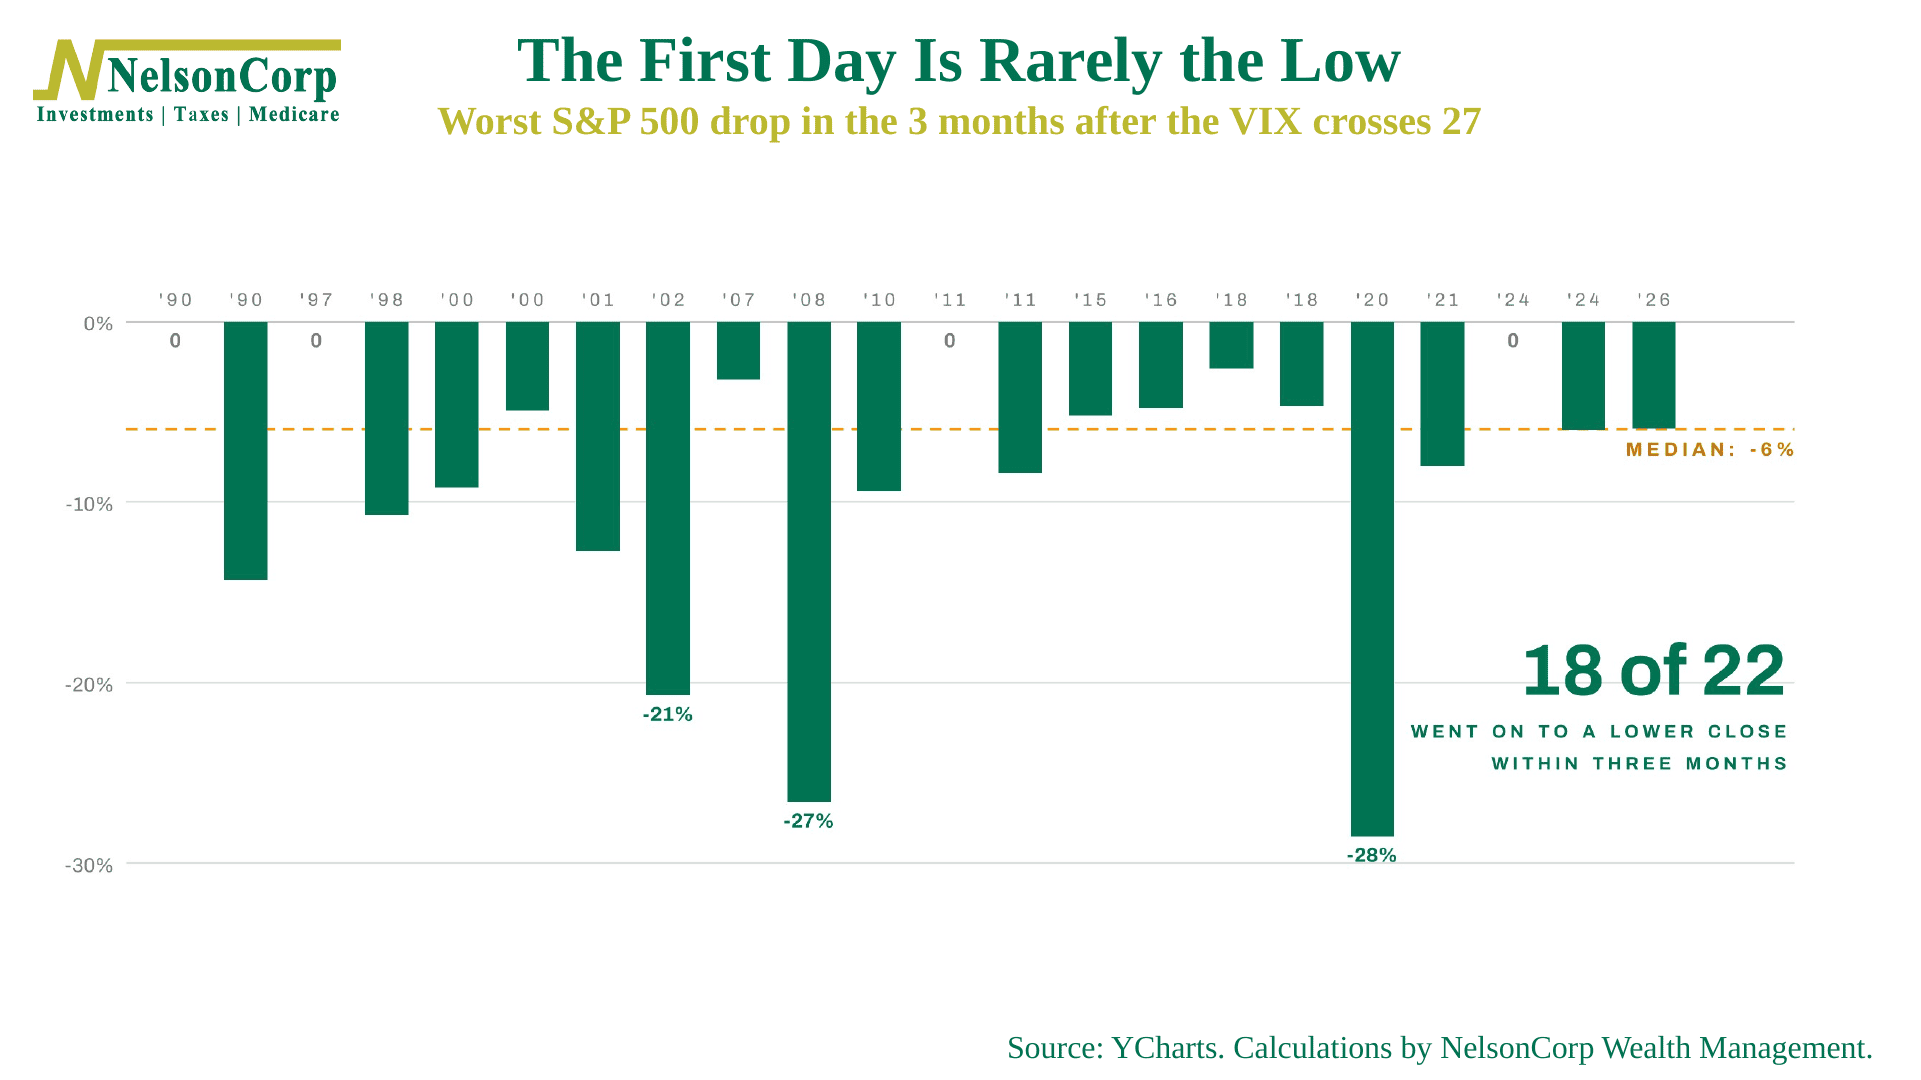
Here’s what happened next in the other 22. The VIX kept rising, to a median peak of 37 within three months, and the S&P 500 made a lower close in 18 of them, by a median of 6%.
Ok, ok, so that’s a lot of data I’ve thrown at you. But the bottom line is that now is a pretty volatile time in the market, so it pays to listen to what the weight of the evidence is telling us. History gives us some direction on what initial weakness like this usually entails. Then add in last week’s Indicator Insights, which says valuations are heading the other way, and the evidence suggests caution, at the very least. The key, as our Chart of the Week last week pointed out, will be what the trend decides to do in the coming weeks. If it holds up, that’s a good sign. If not, history says the first cut probably won’t be the deepest—and we would rather be patient than brave while we find out.
This is intended for informational purposes only and should not be used as the primary basis for an investment decision. Consult an advisor for your personal situation.
Indices mentioned are unmanaged, do not incur fees, and cannot be invested into directly.
Past performance does not guarantee future results.
The S&P 500 Index, or Standard & Poor’s 500 Index, is a market-capitalization-weighted index of 500 leading publicly traded companies in the U.S. The S&P 500 Equal Weight Index is a version of the S&P 500 in which each of the 500 companies is given the same weight, so it reflects the performance of the average stock in the index rather than the largest companies.
The Dow Jones Industrial Average (DJIA) is a price-weighted index composed of 30 widely traded blue-chip U.S. common stocks. The Nasdaq 100 Index is a basket of the 100 largest, most actively traded U.S. companies listed on the Nasdaq stock exchange. The index includes companies from various industries except for the financial industry, like commercial and investment banks. The Russell 3000 Index is a capitalization-weighted stock market index that seeks to be a benchmark of the entire U.S. stock market. The S&P MidCap 400 is designed to measure the performance of 400 mid-sized companies, reflecting the distinctive risk and return characteristics of this market segment. S&P 600 Index measures the small-cap segment of the U.S. equity market. The index is designed to track companies that meet specific inclusion criteria to ensure that they are liquid and financially viable. The S&P 100 index is a capitalization-weighted index based on 100 highly capitalized stocks for which options are listed on the CBOE (Chicago Board of Exchange). The MSCI EAFE Index is an equity index which captures large and mid cap representation across 21 Developed Markets countries* around the world, excluding the US and Canada.
The Bloomberg U.S. Corporate Bond Index measures the investment grade, fixed-rate, taxable corporate bond market. The Bloomberg U.S. Corporate High Yield Index is comprised of domestic and corporate bonds rated Ba and below with a minimum outstanding amount of $150 million. The Bloomberg U.S. Municipal Index covers the USD-denominated long-term tax exempt bond market. The index has four main sectors: state and local general obligation bonds, revenue bonds, insured bonds and prerefunded bonds.