OVERVIEW
Markets took a step back last week, with weakness spread across major U.S. equity benchmarks. The S&P 500 slipped 0.10%, while the Dow Jones Industrial Average and NASDAQ each lost 0.19%. Small- and mid-caps lagged further, with the S&P 600 down 0.35% and the S&P 400 off 0.06%. Growth and value were both slightly negative, as the Russell 3000 Value fell 0.09% and the Russell 3000 Growth edged up just 0.05%.
International markets struggled as well. Developed markets (EAFE) dropped 1.46%, while emerging markets declined 0.64%. The U.S. dollar posted a small weekly gain of 0.15%.
Bonds were mixed. Short-term Treasuries rose 0.09% and intermediate Treasuries advanced 0.17%, but long-term Treasuries declined 0.50%. Investment-grade corporates dipped 0.08%, while high yield bonds gained 0.45%. Municipal bonds rose 0.22%, and TIPS added 0.23%.
Commodities showed strength, with the broad index up 1.14%. Oil gained 0.27%, corn rose 2.13%, and gold jumped 2.86%. Real estate was little changed at +0.07%. Volatility spiked, with the VIX surging 8.02% after weeks of calm.
KEY CONSIDERATIONS
Is the Market Overvalued? – Is the market overvalued? It’s a question that’s been asked a lot lately—and one investors wrestle with all the time. After all, nobody wants to buy at the so-called “top.” But how do we know when valuations are stretched?
Well, one way is by looking at the Price-to-Sales ratio. This measure compares the price of the S&P 500 to the revenue its companies generate. Analysts like it because, unlike earnings, revenues are harder to manipulate.
This ratio has been making headlines lately, and for good reason. As the following chart shows, it’s now at record highs.
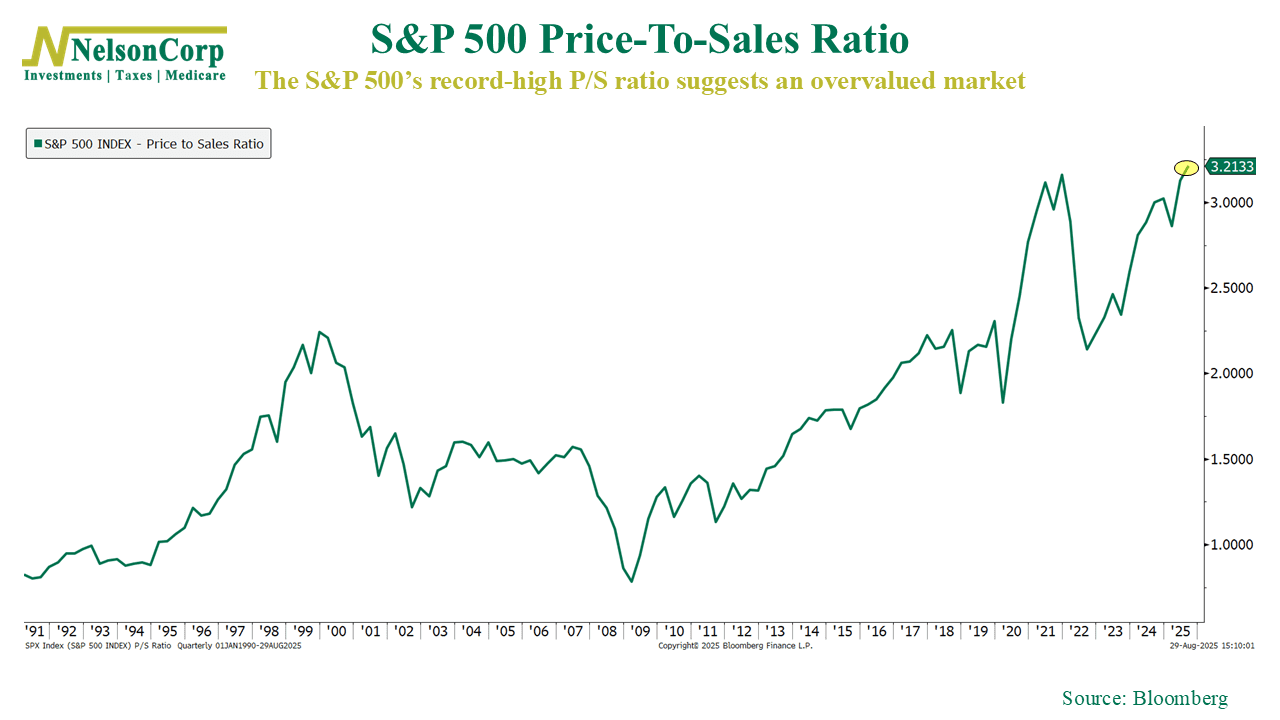
In other words, investors are paying more for every dollar of sales than they ever have. On the surface, that makes the market look very overvalued indeed.
But this second chart adds some perspective. Historically, the best returns come when valuations are low—when the Price-to-Sales ratio is cheap and stocks are “on sale.” This makes sense.
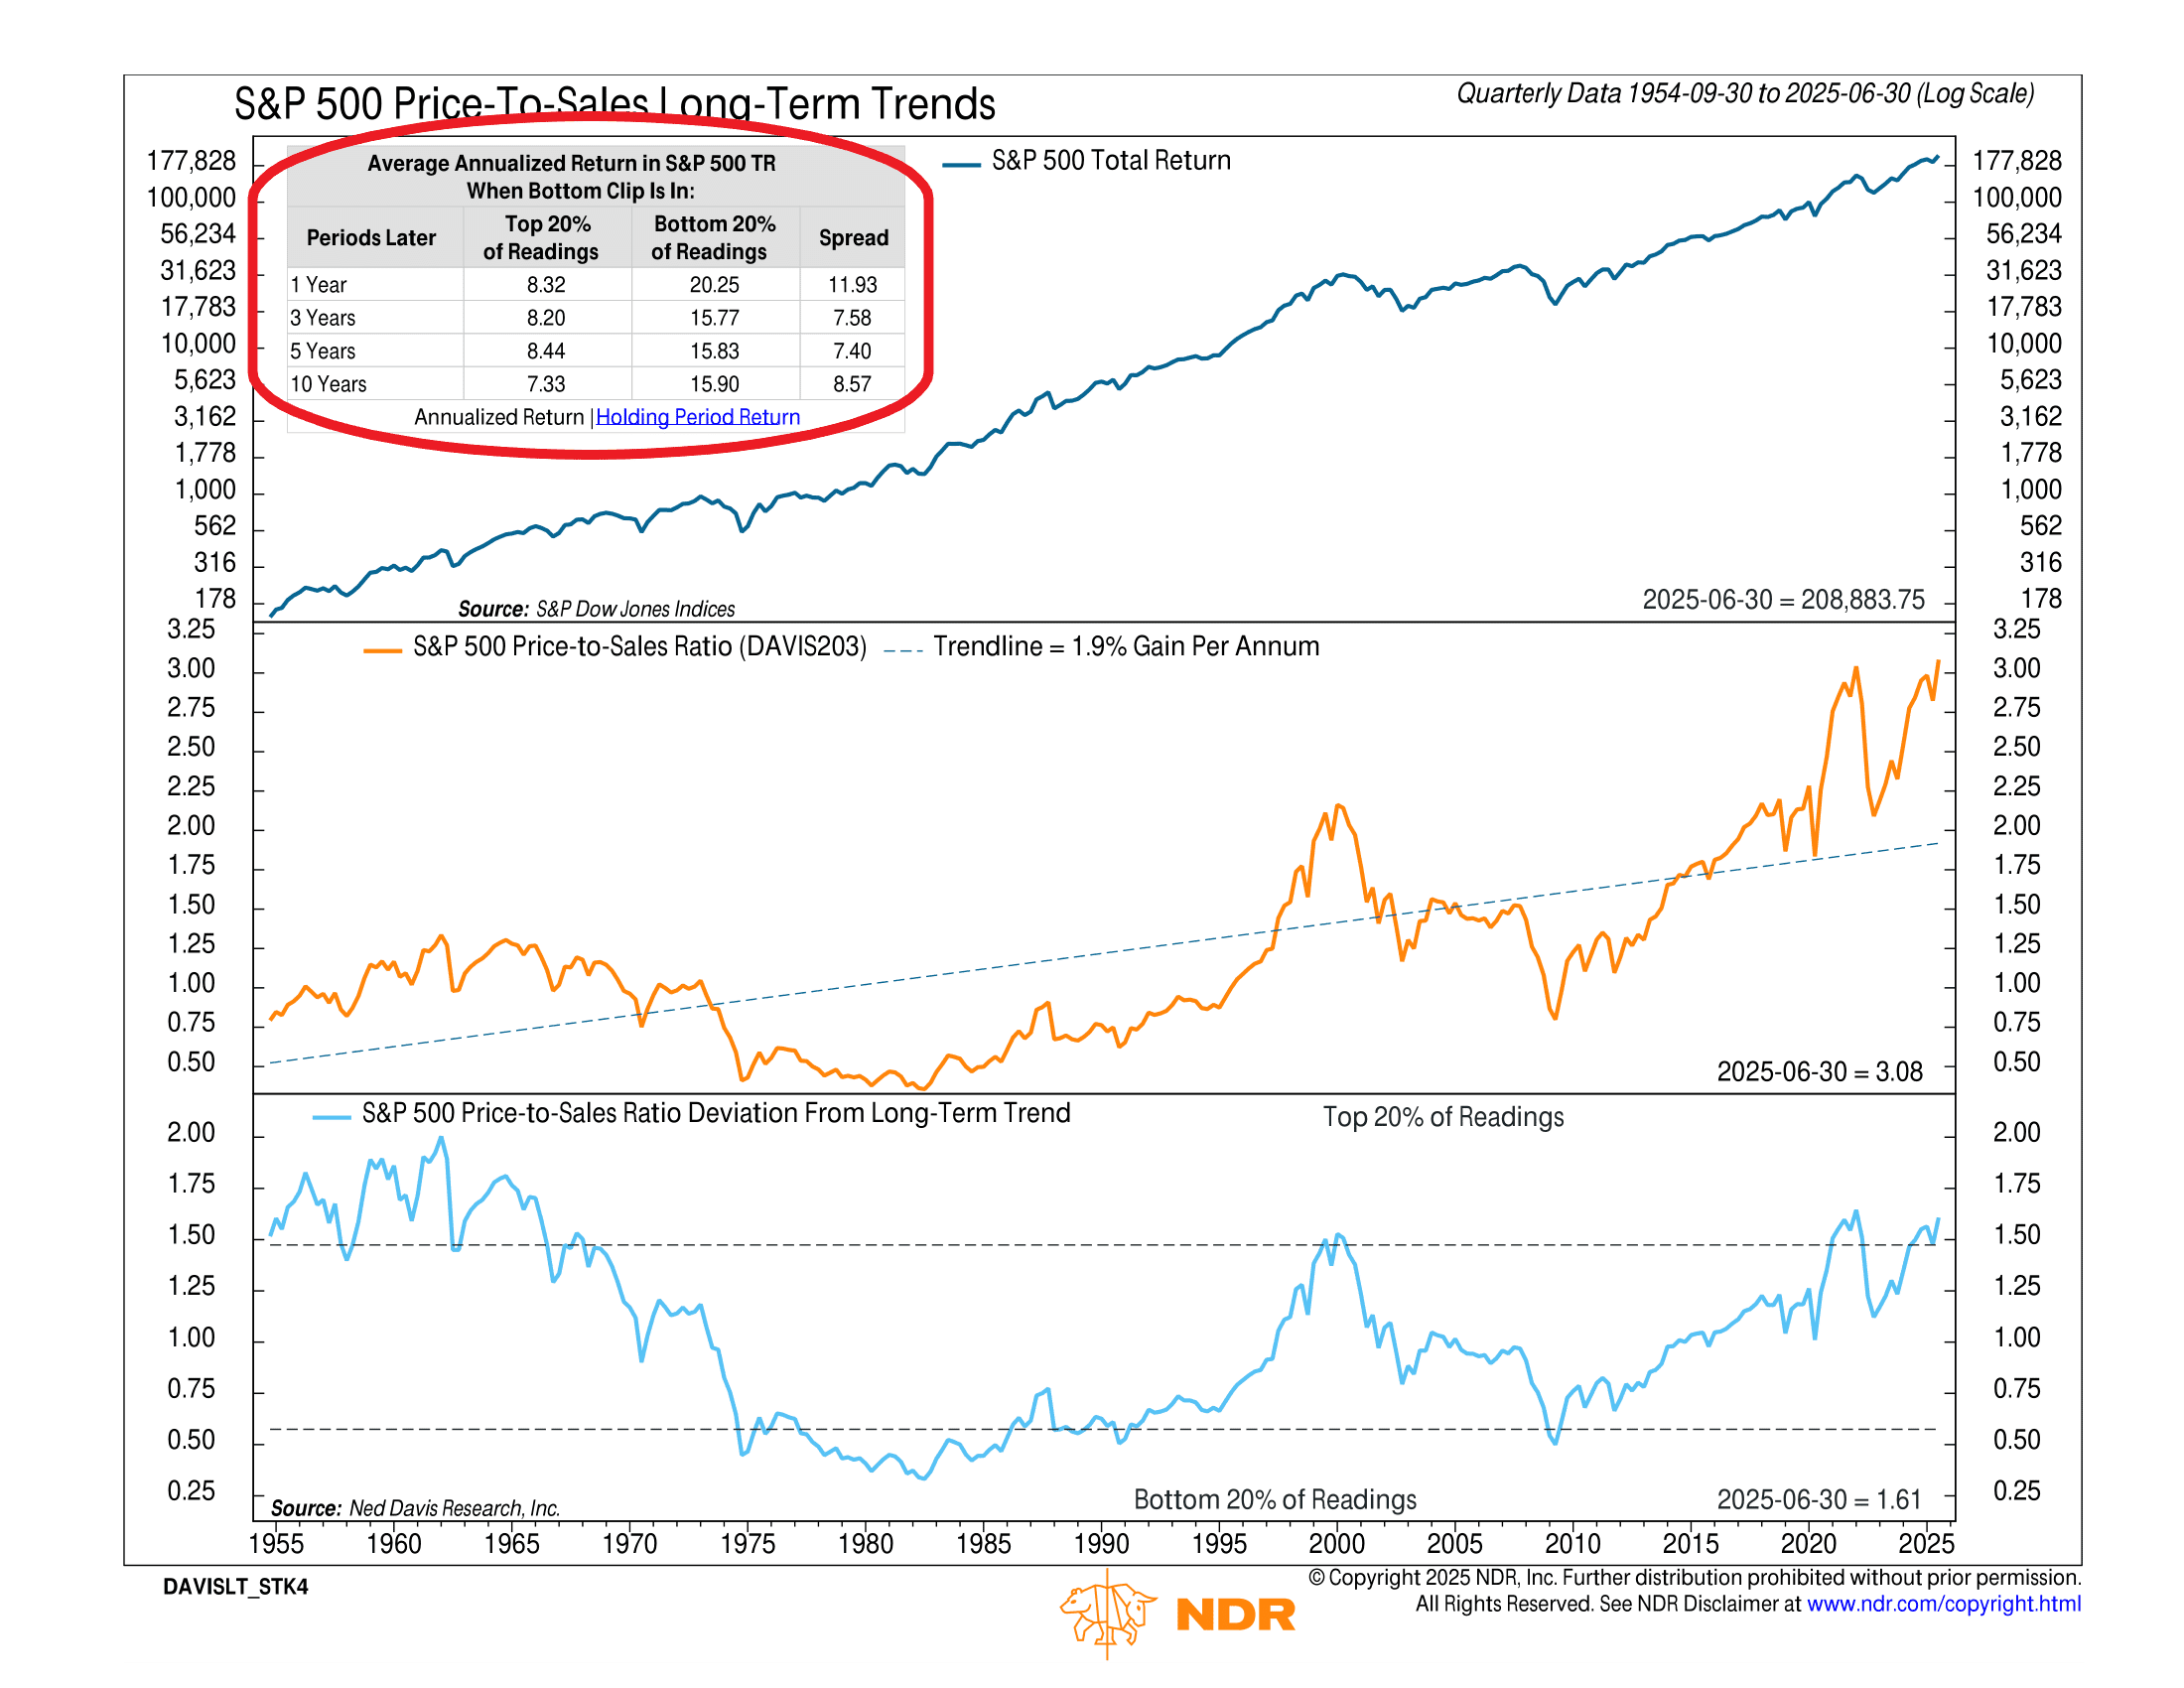
Yet the chart also reveals that returns can still be respectable even when valuations are high. In other words, just because the market is expensive doesn’t mean it’s doomed. Sometimes it stays expensive for years, and investors who step aside risk missing out on meaningful gains.
This is why valuation alone is a tricky timing tool. Markets evolve. Decades ago, the S&P 500 was dominated by banks, manufacturers, and industrial companies. Today, it’s led by technology and service firms with higher margins and faster growth. What looked like a bubble in the past might not be viewed the same way today.
Still, valuations aren’t the only thing worth watching. Beyond prices, we do see some evidence of investor complacency. Implied volatility, as measured by the VIX, is very low. And as this final chart shows, credit spreads—the extra yield investors demand for holding corporate bonds instead of government bonds—are as tight as they’ve been since 2007.
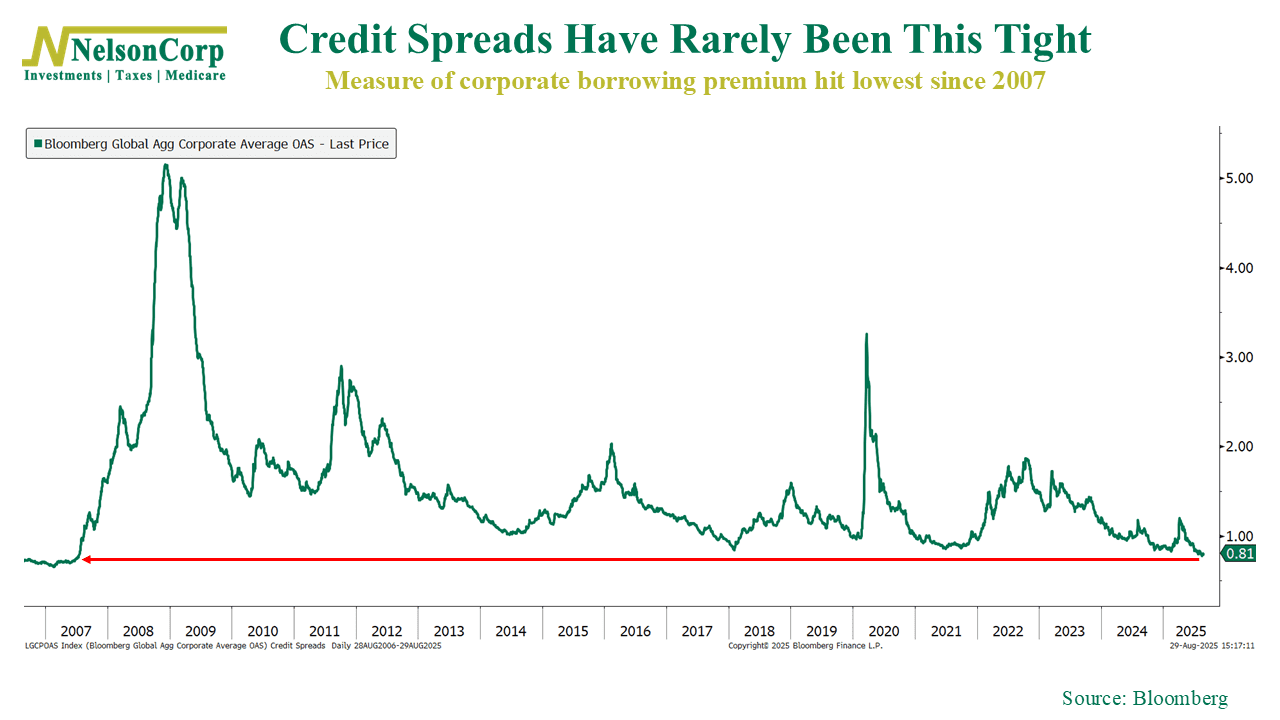
In other words, investors aren’t asking for much cushion against risk. Sure, confidence is high, but that also makes the market more fragile, with little room for disappointment.
So, back to the question: is the market overvalued? Well, yes. By traditional measures, the answer is yes. But history also teaches us that valuations alone don’t drive markets in the short run. We do see a few other yellow flags out there, sentiment-wise, but for investors, the lesson is less about trying to call the exact top and more about staying balanced, disciplined, and prepared.
This is intended for informational purposes only and should not be used as the primary basis for an investment decision. Consult an advisor for your personal situation.
Indices mentioned are unmanaged, do not incur fees, and cannot be invested into directly.
Past performance does not guarantee future results.
The S&P 500 Index, or Standard & Poor’s 500 Index, is a market-capitalization-weighted index of 500 leading publicly traded companies in the U.S.