
OVERVIEW
KEY CONSIDERATIONS
Keeping Score – If you only read the headlines this week, you would think the stock market was in trouble. The Fed raised interest rates for the first time since 2023. The 10-year Treasury yield closed above 5% for the first time since that same year. Oil is back above $100 a barrel. And the S&P 500 slipped to a one-month low on Wednesday.
But here is what caught my attention. While the headlines got worse, the weight of the evidence got better.
Each week, we run a scorecard on the stock market. It tracks more than 100 indicators covering market action, investor behavior, and the economy, and tallies how many are positive, negative, or on the fence. Two weeks ago, the tally was about as close as it gets: 36 indicators positive, 37 negative. It looked like the scorecard might tip negative.
Instead, it went the other way. As of the latest update, 39 indicators are positive and 33 are negative, and the overall reading is comfortably back in positive territory. I think it’s worth mentioning two of the indicators that flipped.
The first chart below shows the Citigroup Economic Surprise Index. It measures whether U.S. economic data over the past three months has been beating or missing forecasts. It has climbed to 27, back above the upper band on the chart.

There were a couple of data releases this week that provided this bump. Retail sales came in stronger than expected, and jobless claims fell to 196,000, with continuing claims at their lowest level since January 2024. Since 2003, the S&P 500 has gained about 11% per year when this index was above 22, versus under 7% when it was below -16. Whatever the Fed is doing, the economy is holding up better than forecasters expected.
The second chart is a breadth indicator. It tracks the number of stocks hitting new 30-day highs minus those hitting new 30-day lows, smoothed over time, with a band drawn around its recent range. When the line drops below the lower band and then turns back up, it triggers a buy signal. A washout in participation followed by a reversal usually means the selling has run its course.
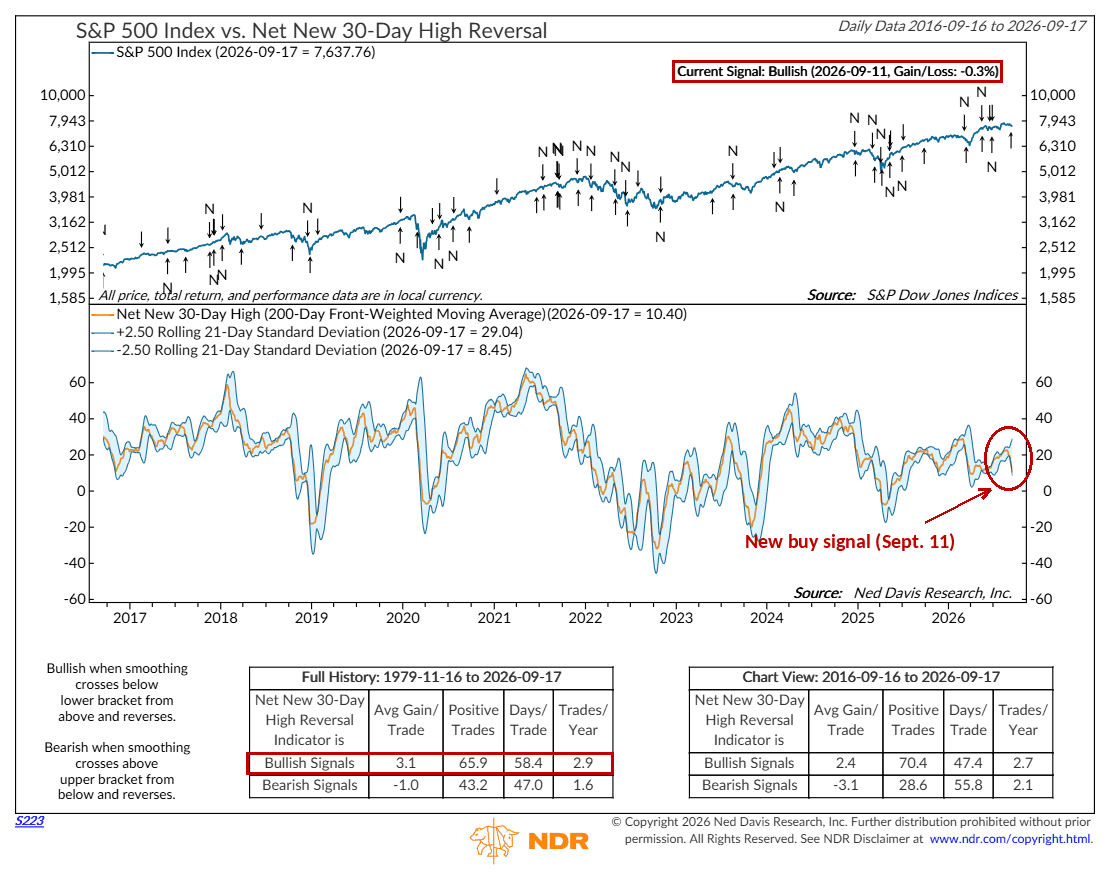
That signal fired on September 11. Since 1979, these buy signals have produced an average gain of 3.1%, and about two-thirds of them have been profitable. Not every signal works. But it suggests individual stocks are finding their footing, even as the index chops around.
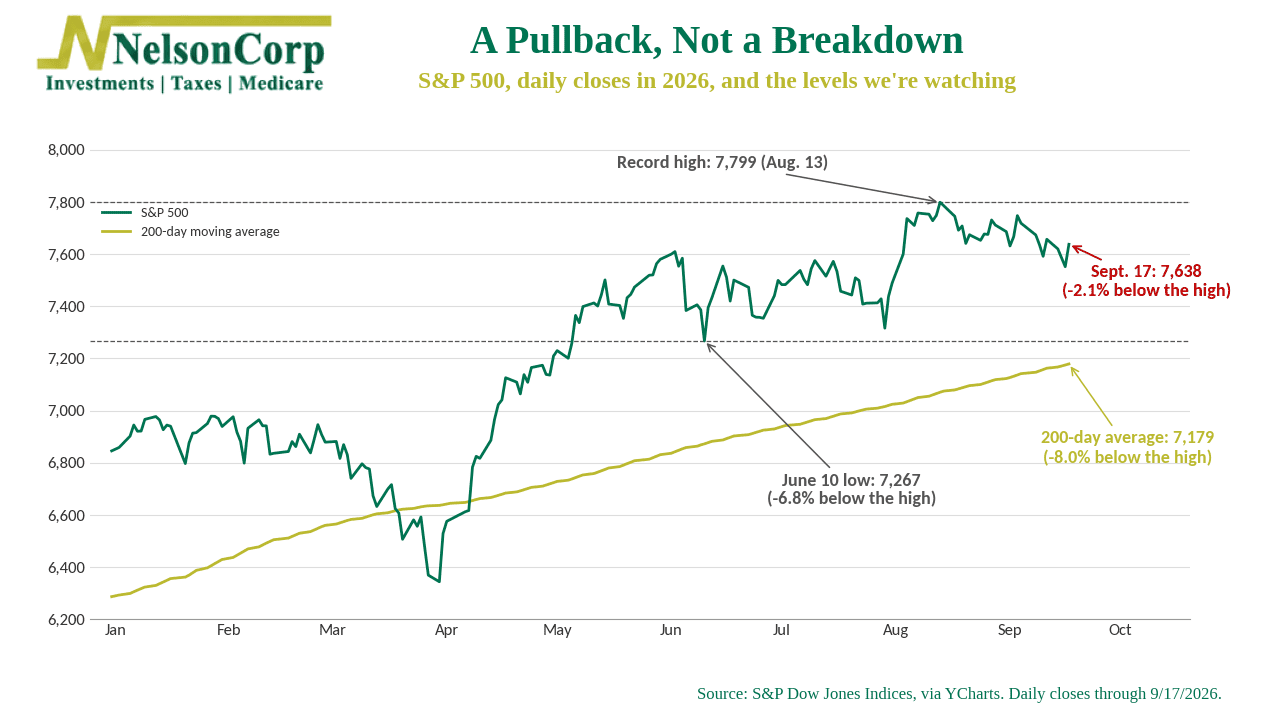
Now, none of this means the pullback is over, though. This third chart shows where the S&P 500 stands: about 2% below its August 13 record high as of Thursday’s close. The June low (6.8% below the high) and the 200-day moving average (about 8% below) are the levels I would watch if selling picks up again. As we showed in this week’s Chart of the Week, the S&P 500 has dropped at least 6% at some point in the year after every first Fed hike since 1994. A test of those levels would be normal, not a sign that something is broken.
One more thing. As stocks slid this week, one of the short-term sentiment gauges we follow reached the extreme-pessimism zone. Barely, but it got there. Pessimism is what pullbacks are supposed to produce, and from a contrarian standpoint, that is a plus.
The bottom line? The headlines this week were about the Fed, bond yields, and oil. The indicators were about an economy beating expectations and a market repairing itself under the surface. When the two disagree, I side with the weight of the evidence. It says this is a pullback within an uptrend, with a few more bumps likely ahead. For now, the score favors patience over panic.
This is intended for informational purposes only and should not be used as the primary basis for an investment decision. Consult an advisor for your personal situation.
Indices mentioned are unmanaged, do not incur fees, and cannot be invested into directly.
Past performance does not guarantee future results.
The S&P 500 Index, or Standard & Poor’s 500 Index, is a market-capitalization-weighted index of 500 leading publicly traded companies in the U.S.
The Dow Jones Industrial Average (DJIA) is a price-weighted index composed of 30 widely traded blue-chip U.S. common stocks. The Nasdaq 100 Index is a basket of the 100 largest, most actively traded U.S. companies listed on the Nasdaq stock exchange. The index includes companies from various industries except for the financial industry, like commercial and investment banks. The Russell 3000 Index is a capitalization-weighted stock market index that seeks to be a benchmark of the entire U.S. stock market. The S&P MidCap 400 is designed to measure the performance of 400 mid-sized companies, reflecting the distinctive risk and return characteristics of this market segment. S&P 600 Index measures the small-cap segment of the U.S. equity market. The index is designed to track companies that meet specific inclusion criteria to ensure that they are liquid and financially viable. The S&P 100 index is a capitalization-weighted index based on 100 highly capitalized stocks for which options are listed on the CBOE (Chicago Board of Exchange). The MSCI EAFE Index is an equity index which captures large and mid cap representation across 21 Developed Markets countries* around the world, excluding the US and Canada.
The Bloomberg U.S. Corporate Bond Index measures the investment grade, fixed-rate, taxable corporate bond market. The Bloomberg U.S. Corporate High Yield Index is comprised of domestic and corporate bonds rated Ba and below with a minimum outstanding amount of $150 million. The Bloomberg U.S. Municipal Index covers the USD-denominated long-term tax exempt bond market. The index has four main sectors: state and local general obligation bonds, revenue bonds, insured bonds and prerefunded bonds.