OVERVIEW
KEY CONSIDERATIONS
Last Man Standing – Our stock market risk model is built on three pillars: Price Movement, Investor Behavior, and Economic Data. Think of it like a three-legged stool. When all three are pointing in the same direction, the signal is stable. But when they diverge, things get interesting.
Right now is one of those interesting (unstable) times. That’s because two of the three legs are broken—and the third is doing its best to hold everything up.
Let’s start with Investor Behavior, because the picture there is about as lopsided as we’ve seen a while. In fact, it’s unprecedented, because every single sub-composite within our Investor Behavior model is currently on a “sell” signal—Surveys, Investor Positioning, Absolute Valuation, Relative Valuation, Volatility, and Overbought/Oversold. All of them. That’s never happened before.
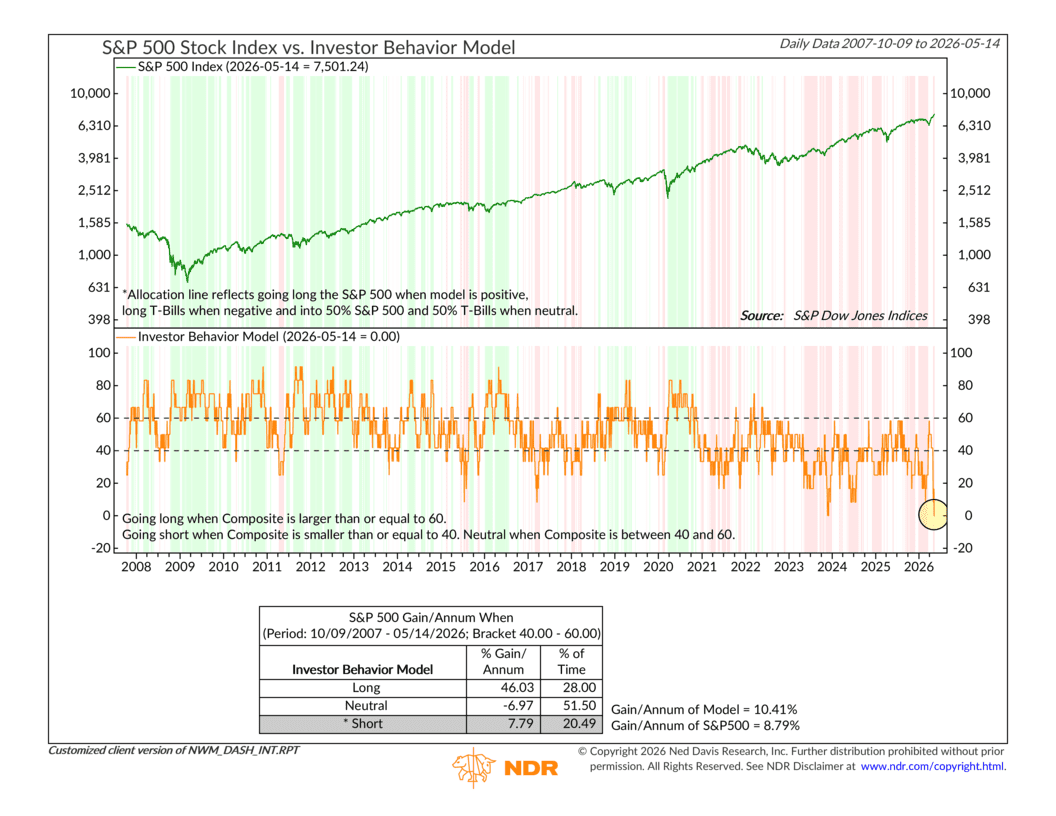
That’s a clean sweep—in a bad way. What it’s telling us is that from a behavioral standpoint, the setup for stocks is not particularly favorable right now. Investors have gotten too optimistic too quickly, valuations remain stretched by historical standards, and volatility is elevated enough to act as a headwind on sustained gains.
Now, as for the other broken leg, the Economic Data side of the model isn’t much better. Interest rates remain a headwind, financial liquidity conditions are tight, and our Inflation Composite—shown below—has continued to weaken.
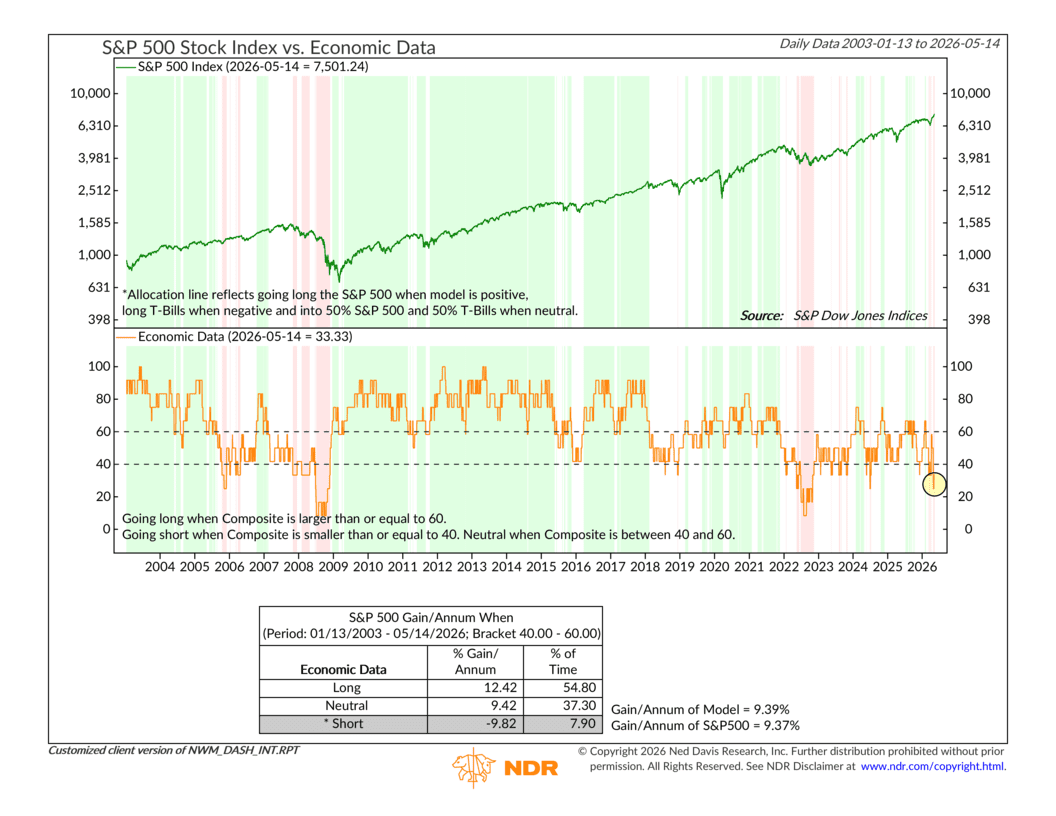
The one exception is our Economic Activity Composite, which is still holding a “buy” signal. The underlying economy hasn’t rolled over. But that lone bright spot isn’t enough to swing the broader Economic Data composite, which still sits on a sell.
So what’s keeping the overall model on a “buy” signal?
Price Movement—and really, price movement alone. One component of this, our Trend Composite, shown below, has been on a buy signal since June of 2025. Momentum is positive. Volume and flows are constructive. Relative strength and breadth indicators are holding up.
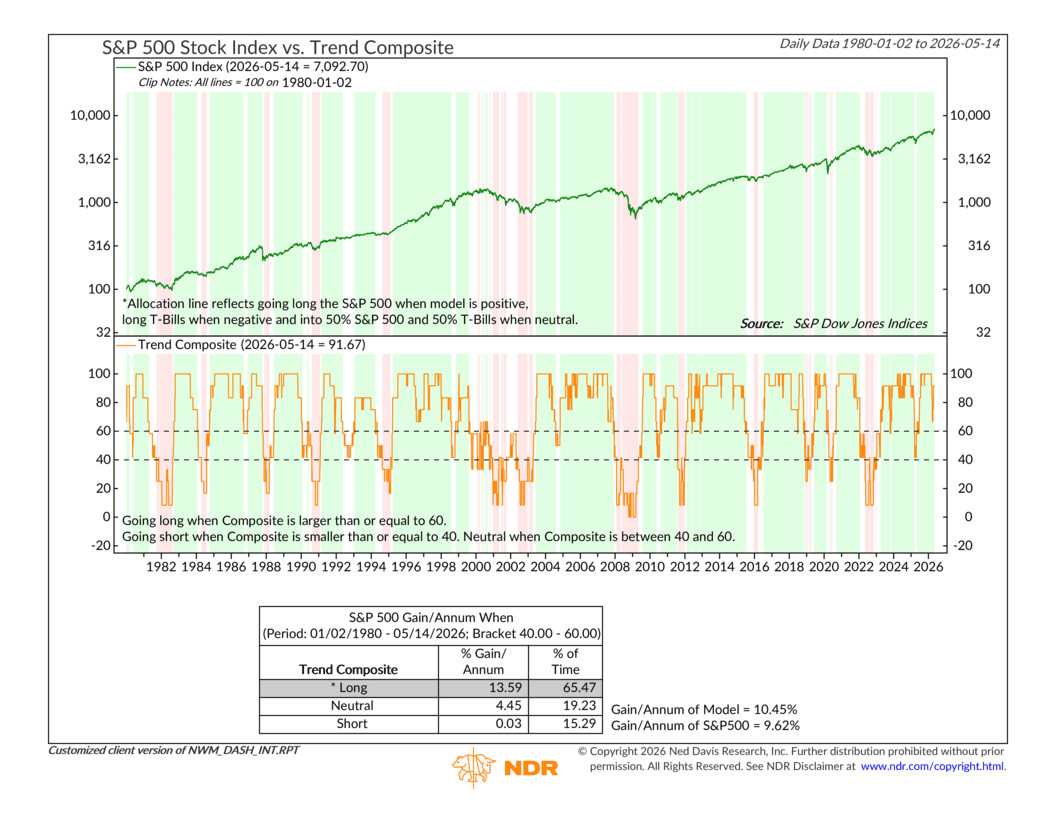
In other words, Price Movement is, at this point, the last man standing.
The next question that raises is: how long can it last?
Well, history shows that price can stay disconnected from fundamentals and sentiment for longer than most people expect. The trend, once established, tends to be pretty darn stubborn.
But when price is the only thing holding the bullish case together, that gets us concerned from a risk standpoint. It makes the margin for error that much smaller. The tiniest shift in the price action can send everything lower in a heartbeat.
The bottom line? Our model is still on a buy, and we respect that signal. We don’t like to fight “the trend.” But with investor behavior and economic data both in the red, the weight of the evidence outside of price action has turned against us. If the tape starts to crack, there won’t be much else standing behind it.
We recommended staying the course for now—but to be aware of the current risk landscape.
This is intended for informational purposes only and should not be used as the primary basis for an investment decision. Consult an advisor for your personal situation.
Indices mentioned are unmanaged, do not incur fees, and cannot be invested into directly.
Past performance does not guarantee future results.
The S&P 500 Index, or Standard & Poor’s 500 Index, is a market-capitalization-weighted index of 500 leading publicly traded companies in the U.S.
The Dow Jones Industrial Average (DJIA) is a price-weighted index composed of 30 widely traded blue-chip U.S. common stocks. The Nasdaq 100 Index is a basket of the 100 largest, most actively traded U.S. companies listed on the Nasdaq stock exchange. The index includes companies from various industries except for the financial industry, like commercial and investment banks. The Russell 3000 Index is a capitalization-weighted stock market index that seeks to be a benchmark of the entire U.S. stock market. The S&P MidCap 400 is designed to measure the performance of 400 mid-sized companies, reflecting the distinctive risk and return characteristics of this market segment. S&P 600 Index measures the small-cap segment of the U.S. equity market. The index is designed to track companies that meet specific inclusion criteria to ensure that they are liquid and financially viable. The S&P 100 index is a capitalization-weighted index based on 100 highly capitalized stocks for which options are listed on the CBOE (Chicago Board of Exchange). The MSCI EAFE Index is an equity index which captures large and mid cap representation across 21 Developed Markets countries* around the world, excluding the US and Canada.
The Bloomberg U.S. Corporate Bond Index measures the investment grade, fixed-rate, taxable corporate bond market. The Bloomberg U.S. Corporate High Yield Index is comprised of domestic and corporate bonds rated Ba and below with a minimum outstanding amount of $150 million. The Bloomberg U.S. Municipal Index covers the USD-denominated long-term tax exempt bond market. The index has four main sectors: state and local general obligation bonds, revenue bonds, insured bonds and prerefunded bonds.