OVERVIEW
KEY CONSIDERATIONS
Mo Better – If you read our commentary from a few weeks ago, you might remember a piece we called “Mo Problems.” At the time, an indicator we track called the Big Mo Multi-Cap Tape Composite had fallen below a historically meaningful threshold—a level that has historically been associated with negative returns for stocks. Things, in short, were not looking great.
Well, a lot can change in a few weeks. And in this case, it’s changed for the better.
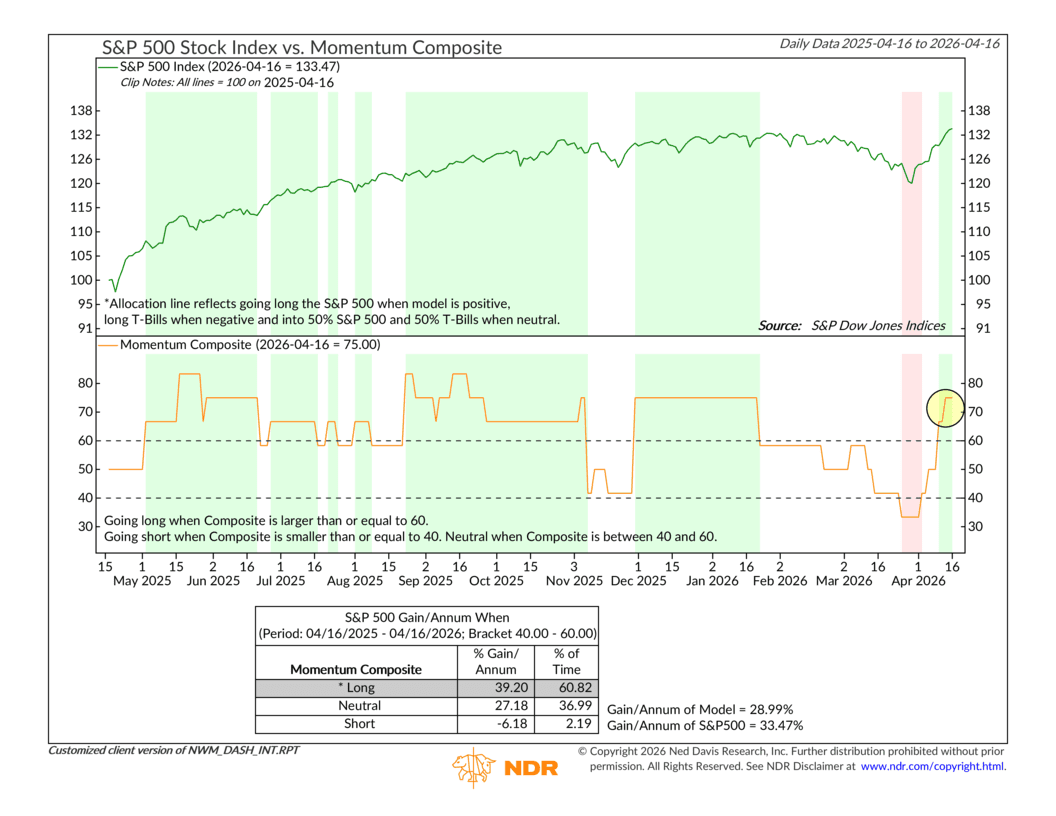
The market’s recovery since then—sparked in large part by the U.S.-Iran ceasefire we discussed last week—has had a meaningful effect on our indicators. One of the most encouraging developments has been the recovery in market momentum. The Momentum Composite in our model, which had moved to a Sell signal in late March, has since flipped back to a Buy. And it’s not just the signal that improved—the reading itself has moved sharply higher.
One measure worth highlighting here is something called the Value Line Geometric Average 26-Week Rate of Change. It sounds technical, but the concept is fairly simple: it measures how the “average” stock—not just the big household names at the top of the market—has performed over the past six months. When this number is positive and rising, it tells you that the broader market is gaining momentum, not just a handful of mega-cap companies doing the heavy lifting.
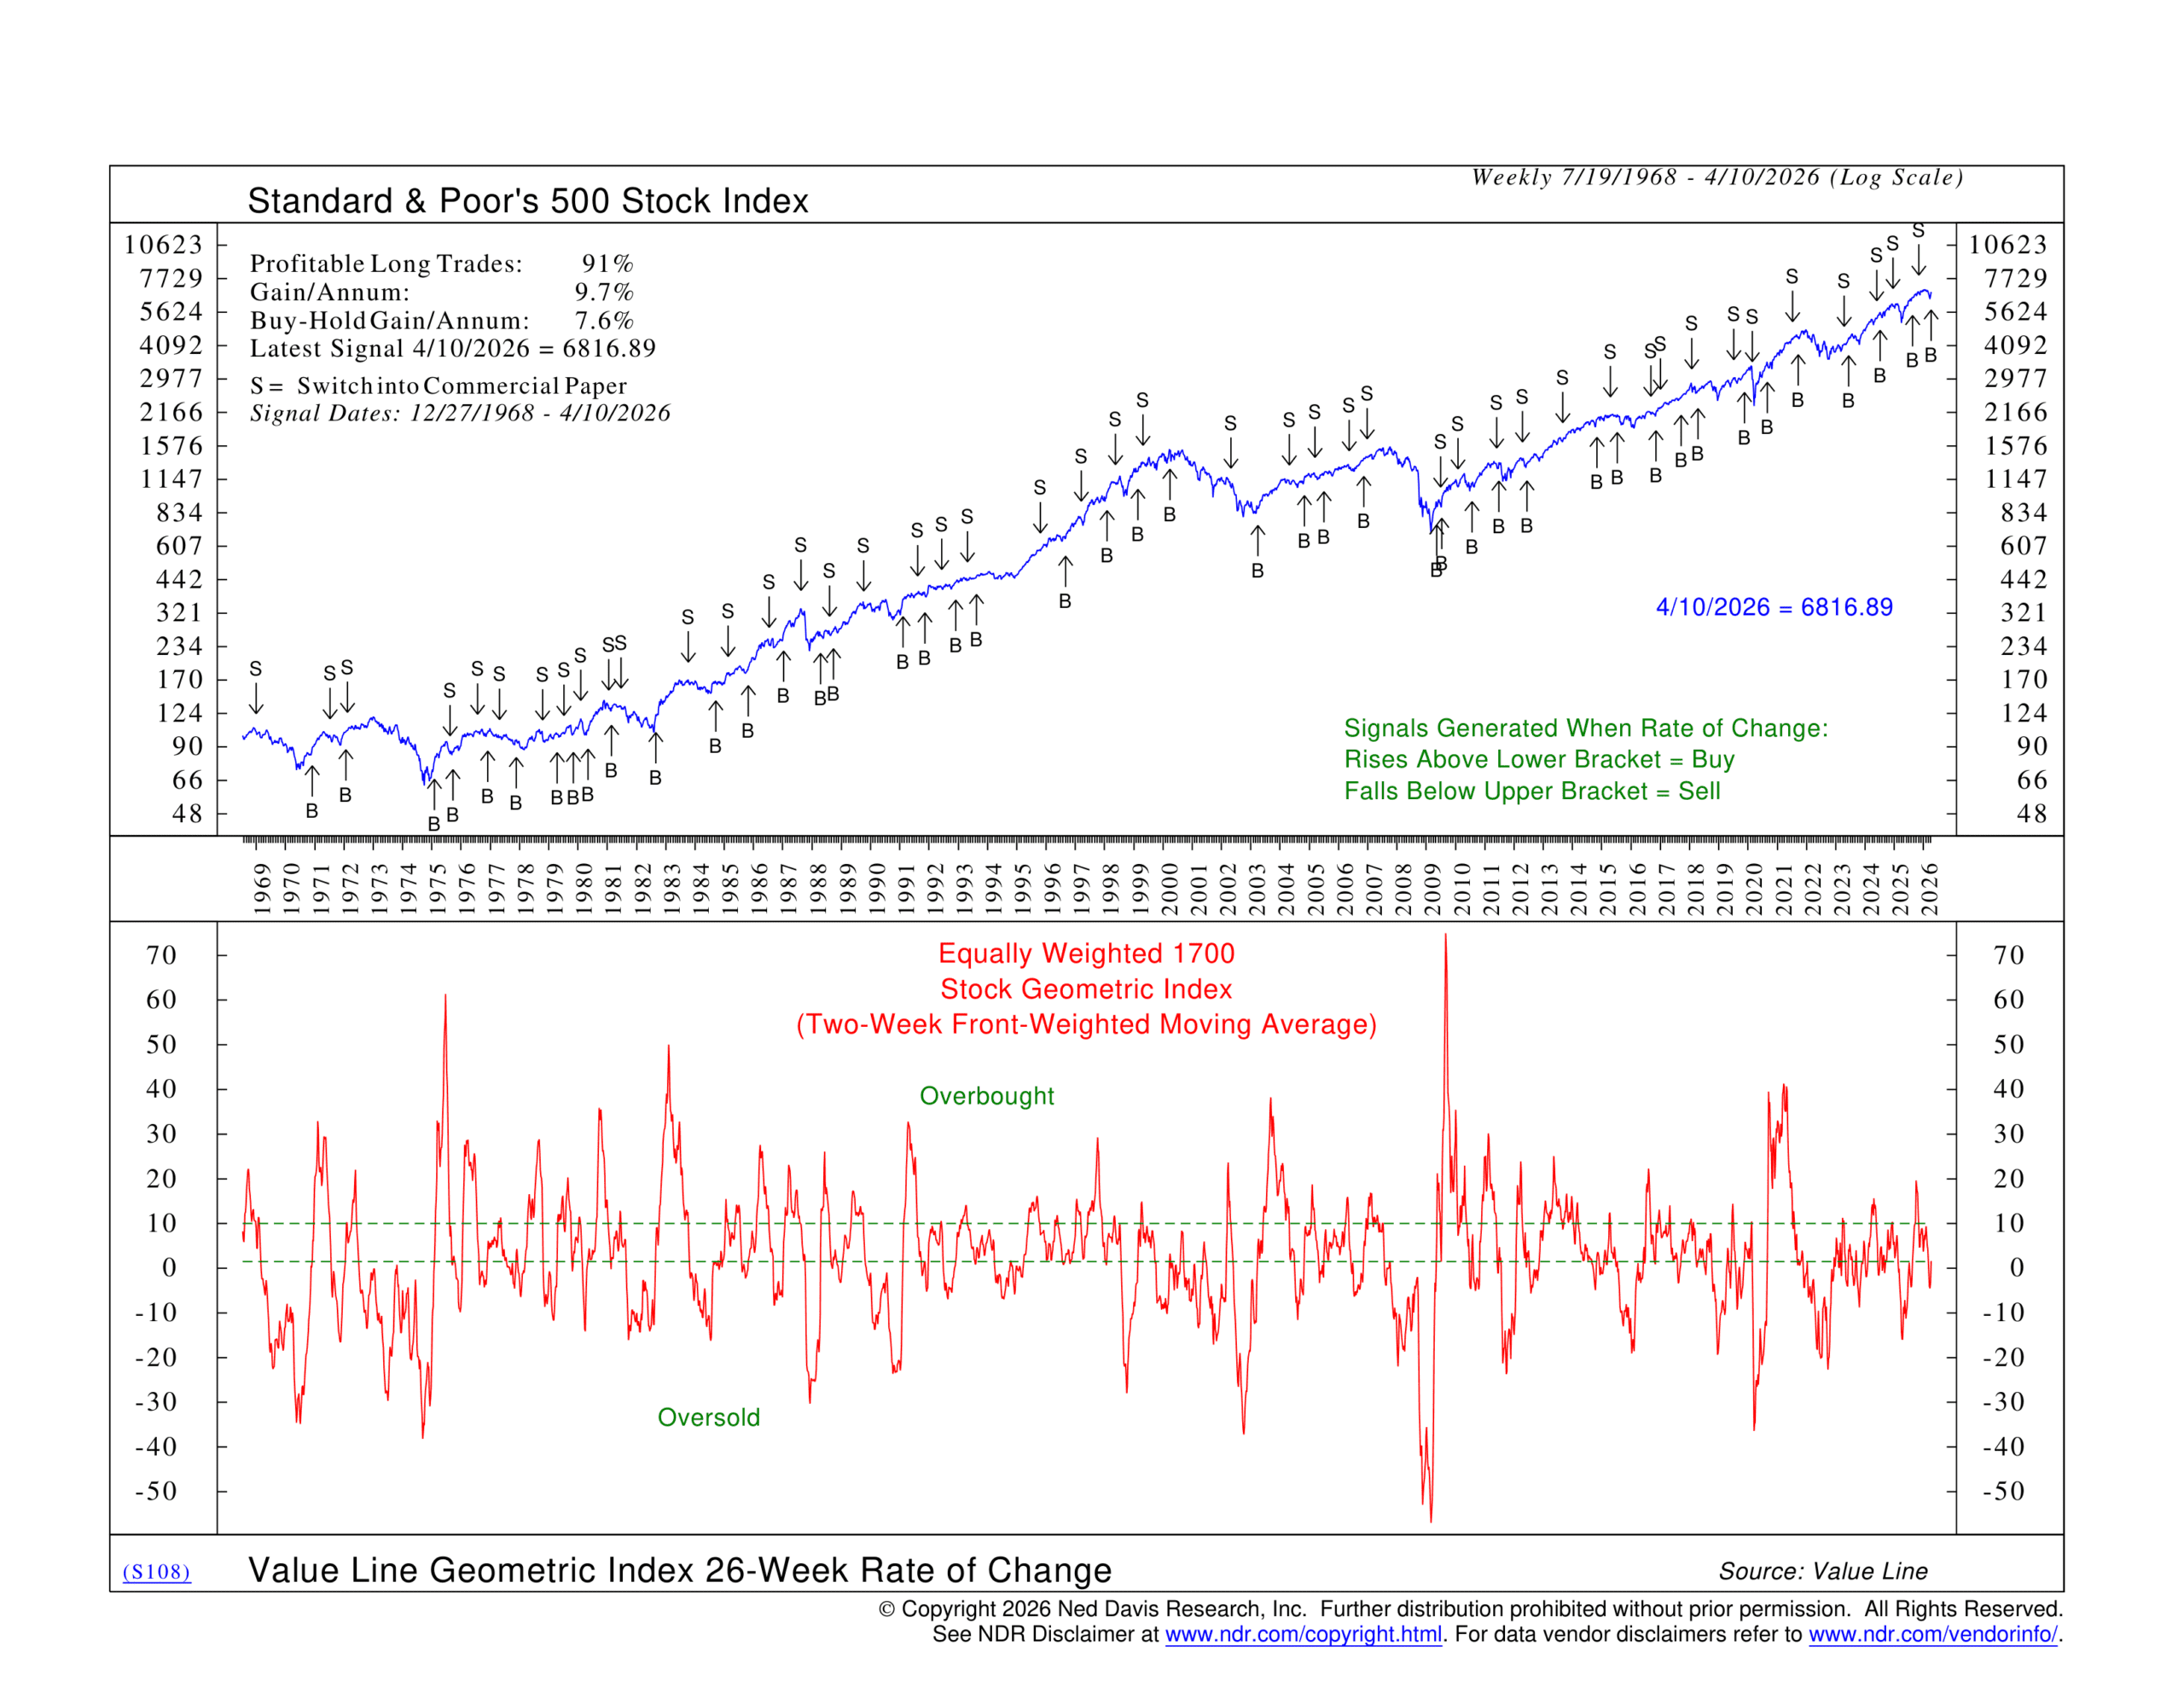
As shown above, that measure just turned positive and moved to a Buy signal earlier this week. That’s an encouraging sign that the recovery is starting to broaden out.
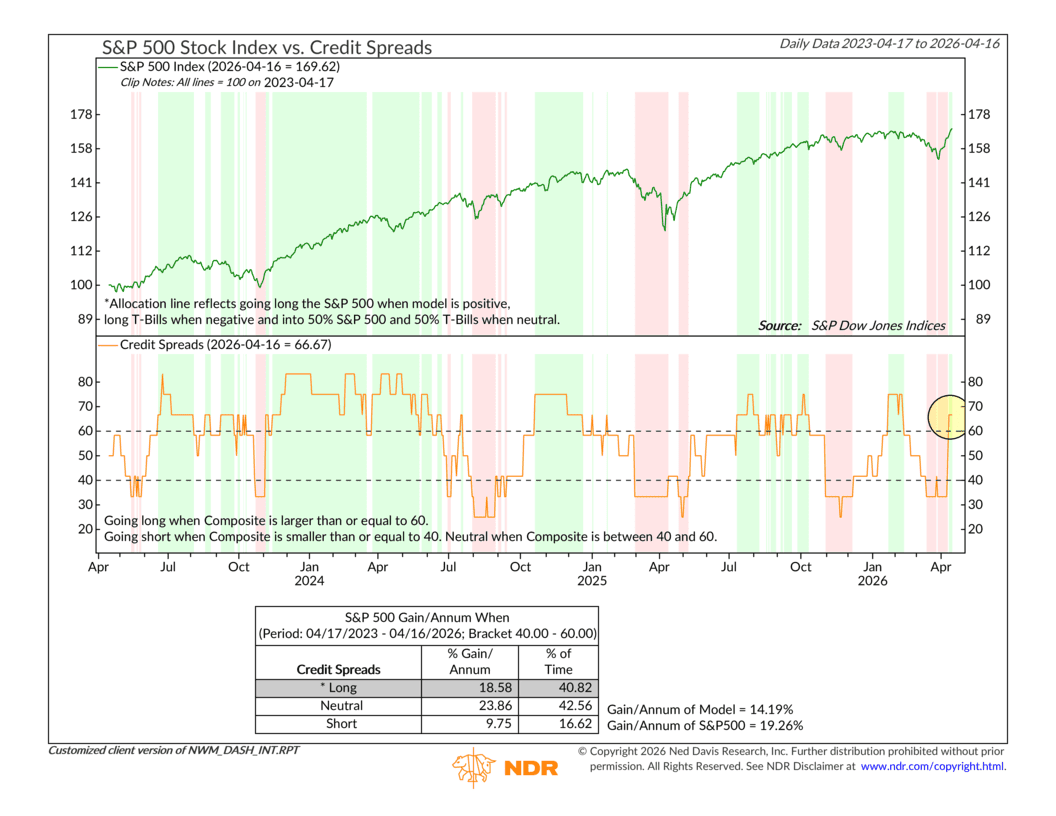
Another area showing meaningful improvement is credit spreads. You might recall that we flagged widening credit spreads as a concern back in mid-March. To put it in plain terms, credit spreads measure the extra yield that riskier bonds have to pay compared to safe U.S. Treasuries. When spreads widen, it’s a sign that investors are growing nervous about the health of the economy and credit markets. When they tighten back in, it signals that confidence is returning.
After several weeks of concern, the Credit Spreads Composite in our model has now moved back to a Buy signal. As shown below, that’s a welcome sign that financial conditions haven’t tightened to the point of causing serious stress—one less thing to worry about.
Now, it would be easy to get carried away here. Not everything is pointing in the same direction. Valuations remain stretched, and our valuation indicators have been on Sell signals for well over a year now. That hasn’t changed. Interest rates also remain a headwind. These aren’t signals to dismiss, and they act as a kind of ceiling on our enthusiasm.
But taken together, the picture is genuinely improving. Momentum is recovering. Credit conditions are stabilizing. The trend—both in the U.S. and globally—remains intact. And on a contrarian basis, investors are still positioned fairly defensively, meaning there’s still plenty of potential buying power sitting on the sidelines.
The bottom line? The data are getting “Mo Better.” Not perfect—but better. After a rough stretch in March, the weight of the evidence has shifted back toward the constructive side. We’re leaning cautiously optimistic, and we’ll continue to let the indicators guide the next move.
This is intended for informational purposes only and should not be used as the primary basis for an investment decision. Consult an advisor for your personal situation.
Indices mentioned are unmanaged, do not incur fees, and cannot be invested into directly.
Past performance does not guarantee future results.
The S&P 500 Index, or Standard & Poor’s 500 Index, is a market-capitalization-weighted index of 500 leading publicly traded companies in the U.S.
The Dow Jones Industrial Average (DJIA) is a price-weighted index composed of 30 widely traded blue-chip U.S. common stocks. The Nasdaq 100 Index is a basket of the 100 largest, most actively traded U.S. companies listed on the Nasdaq stock exchange. The index includes companies from various industries except for the financial industry, like commercial and investment banks. The Russell 3000 Index is a capitalization-weighted stock market index that seeks to be a benchmark of the entire U.S. stock market. The S&P MidCap 400 is designed to measure the performance of 400 mid-sized companies, reflecting the distinctive risk and return characteristics of this market segment. S&P 600 Index measures the small-cap segment of the U.S. equity market. The index is designed to track companies that meet specific inclusion criteria to ensure that they are liquid and financially viable. The S&P 100 index is a capitalization-weighted index based on 100 highly capitalized stocks for which options are listed on the CBOE (Chicago Board of Exchange). The MSCI EAFE Index is an equity index which captures large and mid cap representation across 21 Developed Markets countries* around the world, excluding the US and Canada.
The Bloomberg U.S. Corporate Bond Index measures the investment grade, fixed-rate, taxable corporate bond market. The Bloomberg U.S. Corporate High Yield Index is comprised of domestic and corporate bonds rated Ba and below with a minimum outstanding amount of $150 million. The Bloomberg U.S. Municipal Index covers the USD-denominated long-term tax exempt bond market. The index has four main sectors: state and local general obligation bonds, revenue bonds, insured bonds and prerefunded bonds.