OVERVIEW
Markets continued to drift lower last week, with broad weakness across most major equity benchmarks. The S&P 500 declined 2.12%, the Dow Jones Industrials fell 0.90%, and the NASDAQ led to the downside with a 3.23% drop. Large-cap stocks were under pressure as well, with the S&P 100 down 2.64% on the week. Year to date, losses have deepened, with the S&P 500 now down 6.96% in 2026 and the NASDAQ trailing at -9.87%.
Under the surface, the divide between value and growth remains a defining theme. The Russell 3000 fell 1.87% for the week. Growth stocks continued to struggle, dropping 3.33% and now down 12.40% year to date. Value stocks held up much better, slipping just 0.41% on the week and still managing a slight gain of 0.45% for the year. Mid- and small-cap stocks showed relative strength, with the S&P 400 rising 0.44% and the S&P 600 gaining 1.14%. Both indexes are modestly positive year to date, a notable contrast to large caps.
International markets were mixed. Developed markets (EAFE) were essentially flat, down just 0.05% for the week and now off 1.85% in 2026. Emerging markets pulled back 1.78% but continue to outperform on a relative basis, holding a 2.34% gain for the year.
Fixed income was relatively steady, though returns were still mixed. Short-term Treasuries edged higher by 0.08% and are now up 0.81% year to date. Intermediate and long-term Treasuries declined slightly, down 0.07% and 0.25%, respectively. Credit markets also softened, with investment-grade bonds falling 0.23% and high yield down 0.47%. Most bond sectors remain modestly negative on the year, but have provided some stability compared to equities.
Real assets continue to show divergence. Commodities were flat on the week, up 0.05%, but remain strong with a 22.32% gain year to date. Oil continued to surge, rising 2.28% and now up nearly 80% in 2026. MLPs were again a standout, gaining 1.31% and advancing to 17.19% on the year. Real estate struggled, falling 1.97% and now slightly negative year to date. Gold pulled back 1.85% but remains up 4.22%, while corn is also higher on the year despite a weekly decline.
Volatility moved higher again, with the VIX jumping 15.94% on the week and now up over 100% year to date, reflecting continued uncertainty in the market. The U.S. dollar strengthened modestly, rising 0.58% for the week and now up 3.00% in 2026.
KEY CONSIDERATIONS
Mo Problems– The old Notorious B.I.G. lyric goes “mo money, mo problems.” This week, the stock market is working through its own version of that sentiment. Only instead of money, it’s momentum that’s creating headaches.
The indicator in focus this week is one we call the Big Mo Multi-Cap Tape Composite. In simple terms, it measures how many stocks across the market are trending in a positive direction. Think of it as a broad pulse check on how widely momentum is being sustained across the market.
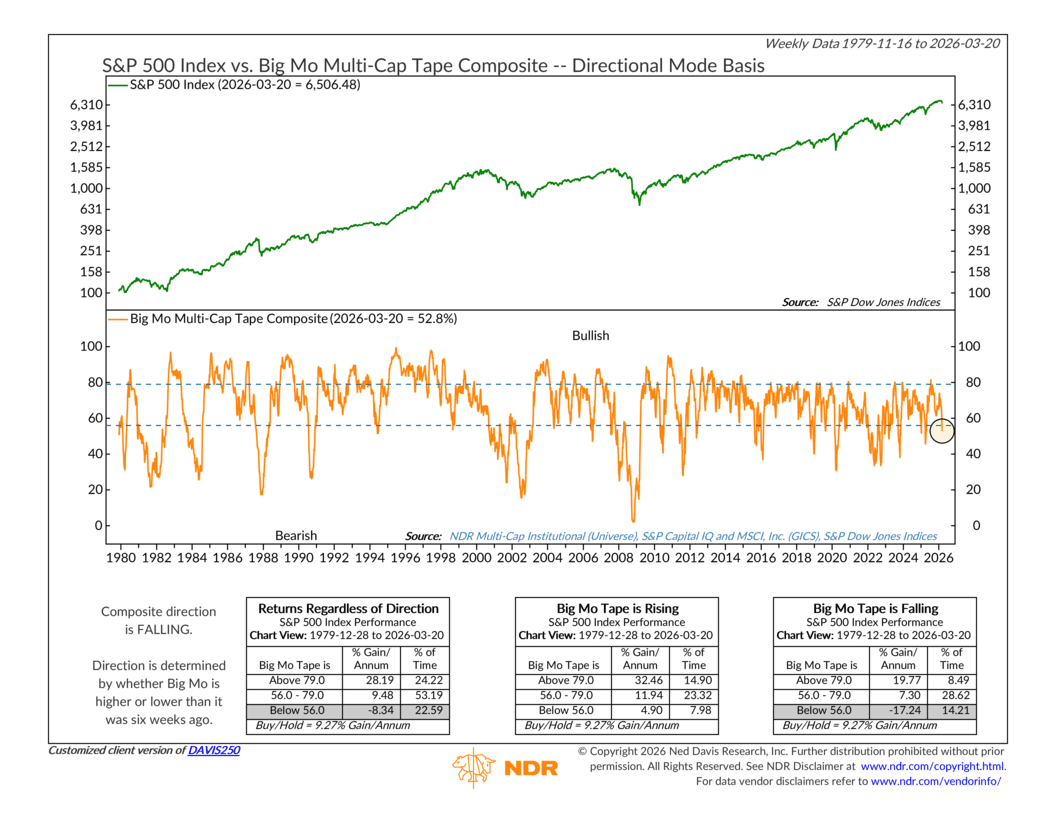
As of the most recent reading, “Big Mo” sits at 52.8%. What does that mean? Well, this indicator has well-defined historical zones. Readings above 79 have been the sweet spot, producing nearly 28% annualized gains for the S&P 500 going back to 1979. The middle range, between 56 and 79, is more average, generating a return of around 9.5% per year. But readings below 56? That’s where historical returns turn negative, averaging a loss of 8.34% per year.
Again, we are currently below 56. Not good.
But here’s what makes this reading even more significant. The composite’s direction is falling — meaning the reading is lower today than it was six weeks ago. That matters quite a bit. When “Big Mo” is both below 56 and falling at the same time, the S&P 500 has historically averaged a loss of 17.24% per year. That covers roughly 14% of all time periods in the data going back to 1979. It’s not a perfect signal, but it is something worth taking seriously.
This also fits neatly with the broader picture from our Primary Stock Market Risk Model. The Momentum Composite, which is where “Big Mo” lives, moved to a Sell signal just this past Tuesday, making it the most recently triggered signal in the entire model.
To be fair, though, not everything is pointing in the same direction. Investor surveys and positioning have both flipped to Buy signals in recent weeks. That’s a contrarian indicator — when sentiment gets pessimistic enough, it can sometimes set the stage for a snapback. Economic activity measures are also still holding positive readings, suggesting the underlying economy hasn’t buckled under the pressure just yet.
So, the bottom line is that the picture is mixed, but the momentum evidence is hard to dismiss. The Big Mo has broken below a historically meaningful threshold, its direction is falling, and the broader model is straining to hold its ground. The contrarian signals offer some hope that the floor may hold, but they’re not a “charge back in” kind of signal. For now, the data continues to support a more defensive posture. But we’ll keep watching the indicators closely for any sign that momentum is beginning to stabilize.
This is intended for informational purposes only and should not be used as the primary basis for an investment decision. Consult an advisor for your personal situation.
Indices mentioned are unmanaged, do not incur fees, and cannot be invested into directly.
Past performance does not guarantee future results.
The S&P 500 Index, or Standard & Poor’s 500 Index, is a market-capitalization-weighted index of 500 leading publicly traded companies in the U.S.
The Dow Jones Industrial Average (DJIA) is a price-weighted index composed of 30 widely traded blue-chip U.S. common stocks. The Nasdaq 100 Index is a basket of the 100 largest, most actively traded U.S. companies listed on the Nasdaq stock exchange. The index includes companies from various industries except for the financial industry, like commercial and investment banks. The Russell 3000 Index is a capitalization-weighted stock market index that seeks to be a benchmark of the entire U.S. stock market. The S&P MidCap 400 is designed to measure the performance of 400 mid-sized companies, reflecting the distinctive risk and return characteristics of this market segment. S&P 600 Index measures the small-cap segment of the U.S. equity market. The index is designed to track companies that meet specific inclusion criteria to ensure that they are liquid and financially viable. The S&P 100 index is a capitalization-weighted index based on 100 highly capitalized stocks for which options are listed on the CBOE (Chicago Board of Exchange). The MSCI EAFE Index is an equity index which captures large and mid cap representation across 21 Developed Markets countries* around the world, excluding the US and Canada.
The Bloomberg U.S. Corporate Bond Index measures the investment grade, fixed-rate, taxable corporate bond market. The Bloomberg U.S. Corporate High Yield Index is comprised of domestic and corporate bonds rated Ba and below with a minimum outstanding amount of $150 million. The Bloomberg U.S. Municipal Index covers the USD-denominated long-term tax exempt bond market. The index has four main sectors: state and local general obligation bonds, revenue bonds, insured bonds and prerefunded bonds.