
OVERVIEW
KEY CONSIDERATIONS
More Than Meets the Index – The stock market came under a little more pressure this past week. Nothing too concerning, but we have seen some interesting changes beneath the surface in recent weeks.
Let’s start with this first chart. It shows the Nasdaq Composite relative to the S&P 500. Think of this as comparing “big tech” to the broader market.
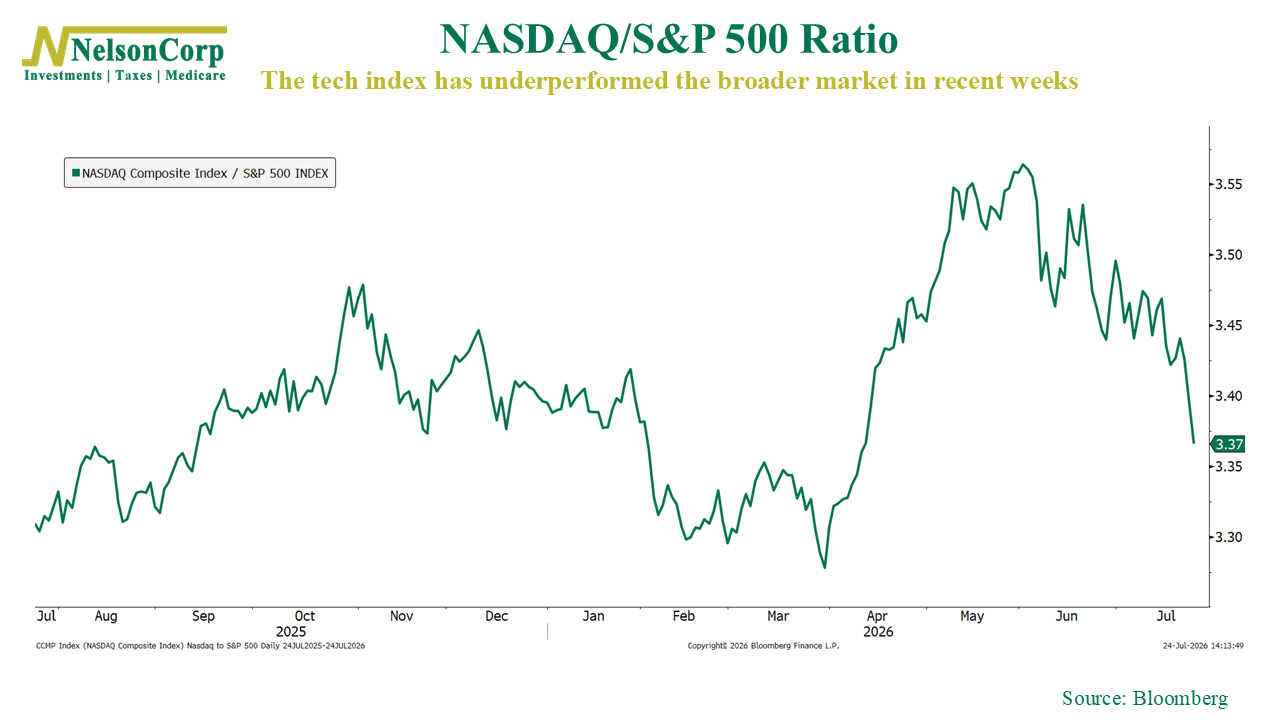
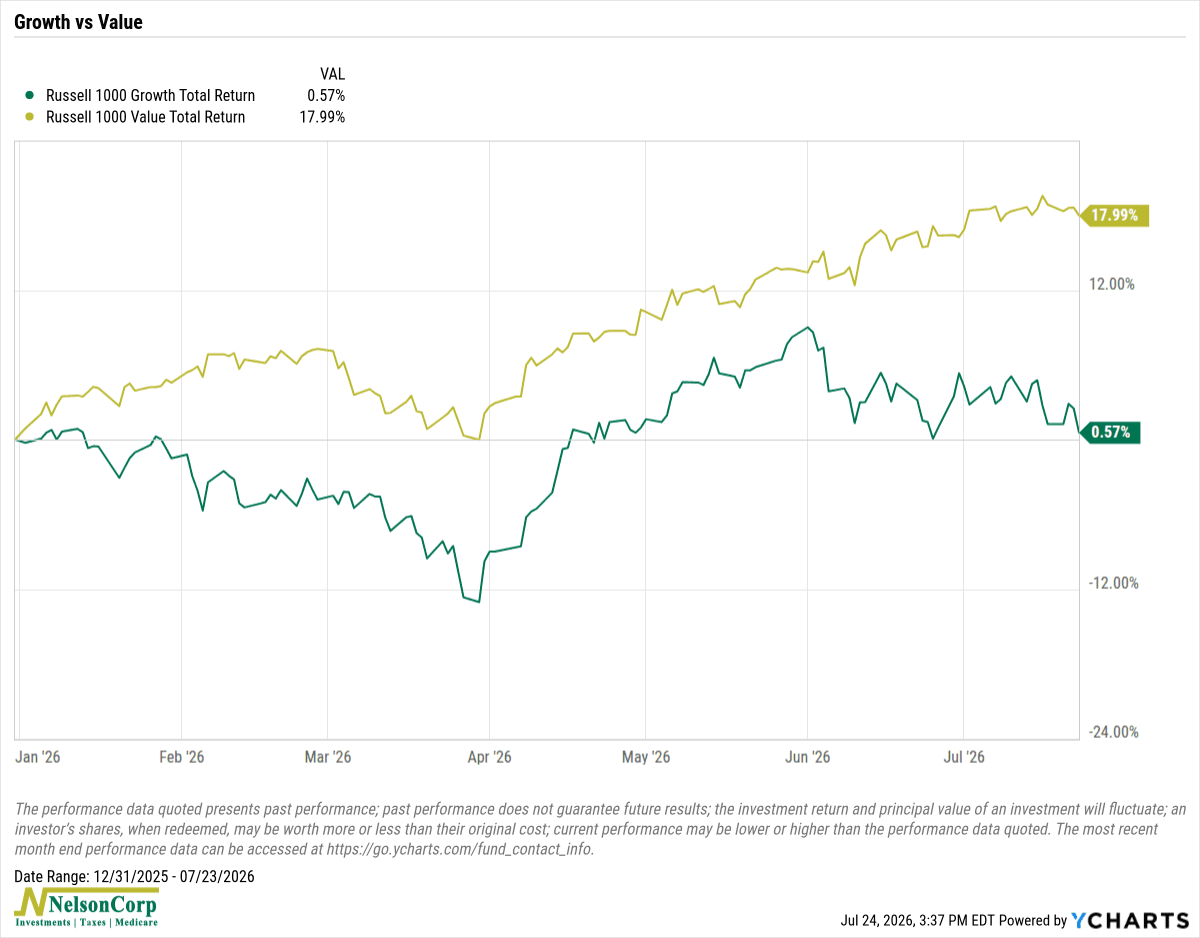
Clearly, the trend has turned in favor of the broader market. In fact, under the surface, what’s really been happening is growth stocks have cooled off since their spring rally, while value stocks have continued to push ahead.
Is leadership changing? Time will tell. But another trend has also stood out. The second chart shows we’ve seen one of the highest numbers of trading days on record where the S&P 500 moved in one direction while the average stock moved in the other.
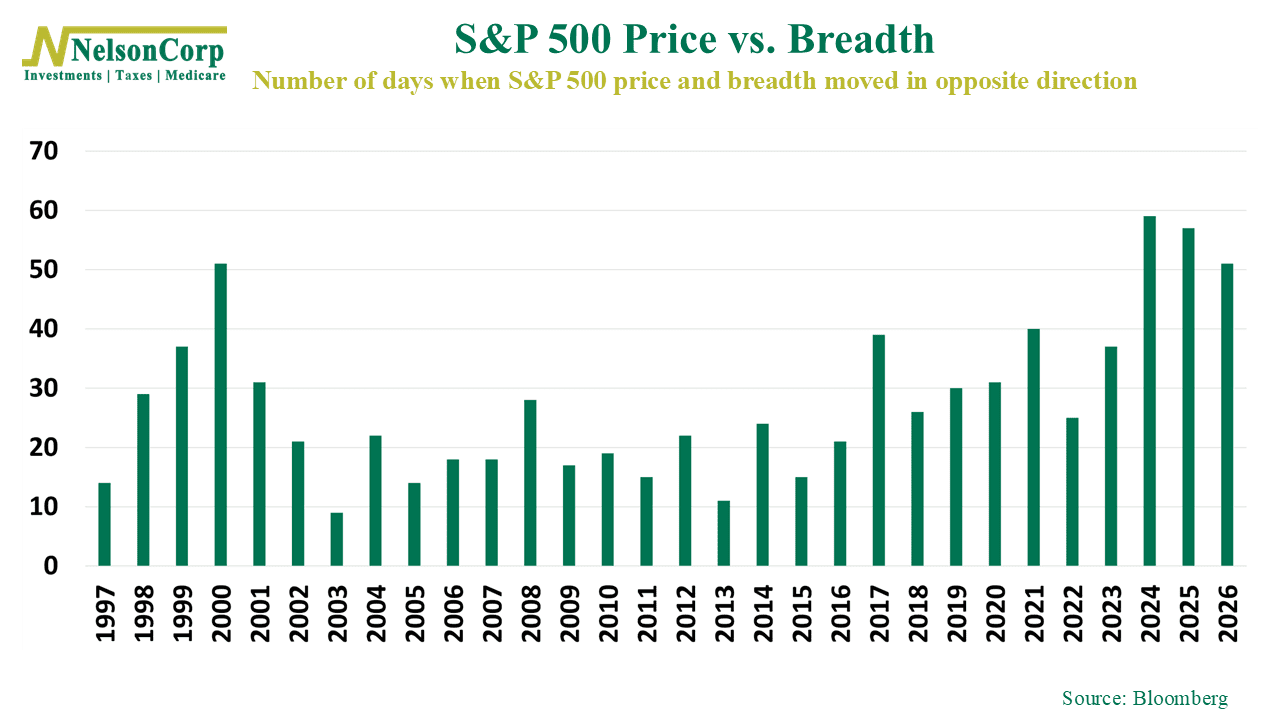
We call this divergence. It can be good or bad. The context matters. It can be the hallmark of a rally when a new industry—like AI—is taking over the market baton. But it can also preview broader market trouble. The question now is what happens when this divergence begins to narrow. Does the rest of the market “catch down” to the recent pullback in AI-related stocks, or do those stocks eventually catch back up with the broader market?
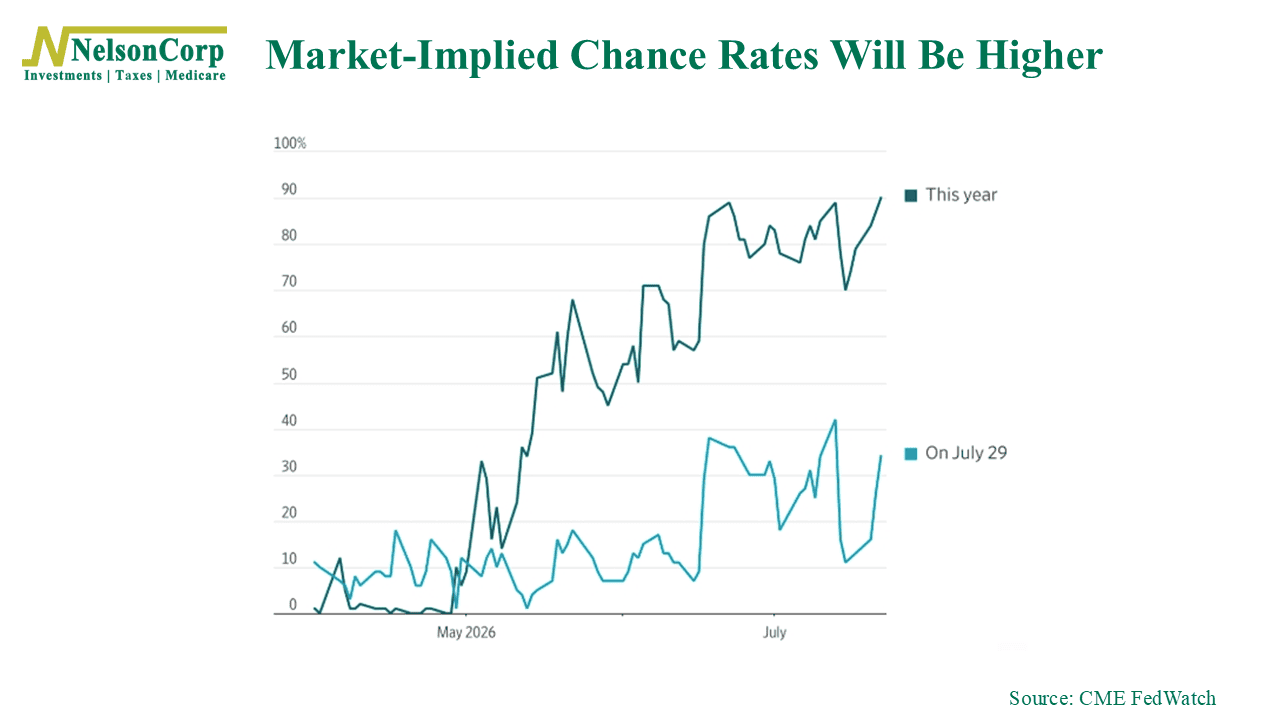
Nonetheless, investors continue to grapple with all of this in an environment of monetary uncertainty. What is the Fed going to do next?
This final chart shows investors have steadily increased the odds of another rate hike later this year. Next week’s meeting is still widely expected to end with no change, but inflation has proven stubborn enough that investors aren’t completely ruling out another move before year-end.
The bottom line? None of the recent market movements are necessarily unusual, especially after a strong rally. Markets don’t move in straight lines, and leadership rarely stays the same forever. Right now, it looks like the market appears to be passing the baton back and forth, rather than dropping it completely. Even so, investors will continue to work through questions surrounding interest rates, inflation, and earnings in the months ahead.
This is intended for informational purposes only and should not be used as the primary basis for an investment decision. Consult an advisor for your personal situation.
Indices mentioned are unmanaged, do not incur fees, and cannot be invested into directly.
Past performance does not guarantee future results.
The S&P 500 Index, or Standard & Poor’s 500 Index, is a market-capitalization-weighted index of 500 leading publicly traded companies in the U.S.
The Dow Jones Industrial Average (DJIA) is a price-weighted index composed of 30 widely traded blue-chip U.S. common stocks. The Nasdaq 100 Index is a basket of the 100 largest, most actively traded U.S. companies listed on the Nasdaq stock exchange. The index includes companies from various industries except for the financial industry, like commercial and investment banks. The Russell 3000 Index is a capitalization-weighted stock market index that seeks to be a benchmark of the entire U.S. stock market. The S&P MidCap 400 is designed to measure the performance of 400 mid-sized companies, reflecting the distinctive risk and return characteristics of this market segment. S&P 600 Index measures the small-cap segment of the U.S. equity market. The index is designed to track companies that meet specific inclusion criteria to ensure that they are liquid and financially viable. The S&P 100 index is a capitalization-weighted index based on 100 highly capitalized stocks for which options are listed on the CBOE (Chicago Board of Exchange). The MSCI EAFE Index is an equity index which captures large and mid cap representation across 21 Developed Markets countries* around the world, excluding the US and Canada.
The Bloomberg U.S. Corporate Bond Index measures the investment grade, fixed-rate, taxable corporate bond market. The Bloomberg U.S. Corporate High Yield Index is comprised of domestic and corporate bonds rated Ba and below with a minimum outstanding amount of $150 million. The Bloomberg U.S. Municipal Index covers the USD-denominated long-term tax exempt bond market. The index has four main sectors: state and local general obligation bonds, revenue bonds, insured bonds and prerefunded bonds.