
OVERVIEW
KEY CONSIDERATIONS
Never Short a Dull Tape – There’s an old Wall Street saying: “Never short a dull tape.”
A dull tape? What is that?
Well, in market terms, a “dull tape” simply means a quiet market. There’s not much volatility; not much excitement. Stocks are just sort of grinding along.
I think that pretty much describes the market over the past few weeks. Stocks keep pushing higher, even though the day-to-day action has been relatively uneventful. There hasn’t really been one major catalyst driving the move. Mostly, the market has simply continued to find enough reasons to move higher and, perhaps more importantly, not enough reasons to move lower.
One of the pretty obvious reasons has been the changing outlook for interest rates.
Earlier this year, stronger inflation and economic data raised the possibility that the Federal Reserve might need to start tightening monetary policy (raising rates) again. More recently, however, softer economic data has taken some of that pressure off.
Sure enough, we’ve seen that show up in Fed Fund futures data. Earlier this year, markets were pricing in a greater chance of higher rates. Today, expectations have backed away from an imminent rate hike. The latest reading is equivalent to about 16 basis points of tightening over the next three months, below the 25-basis-point threshold that would actually signal an expected rate hike.
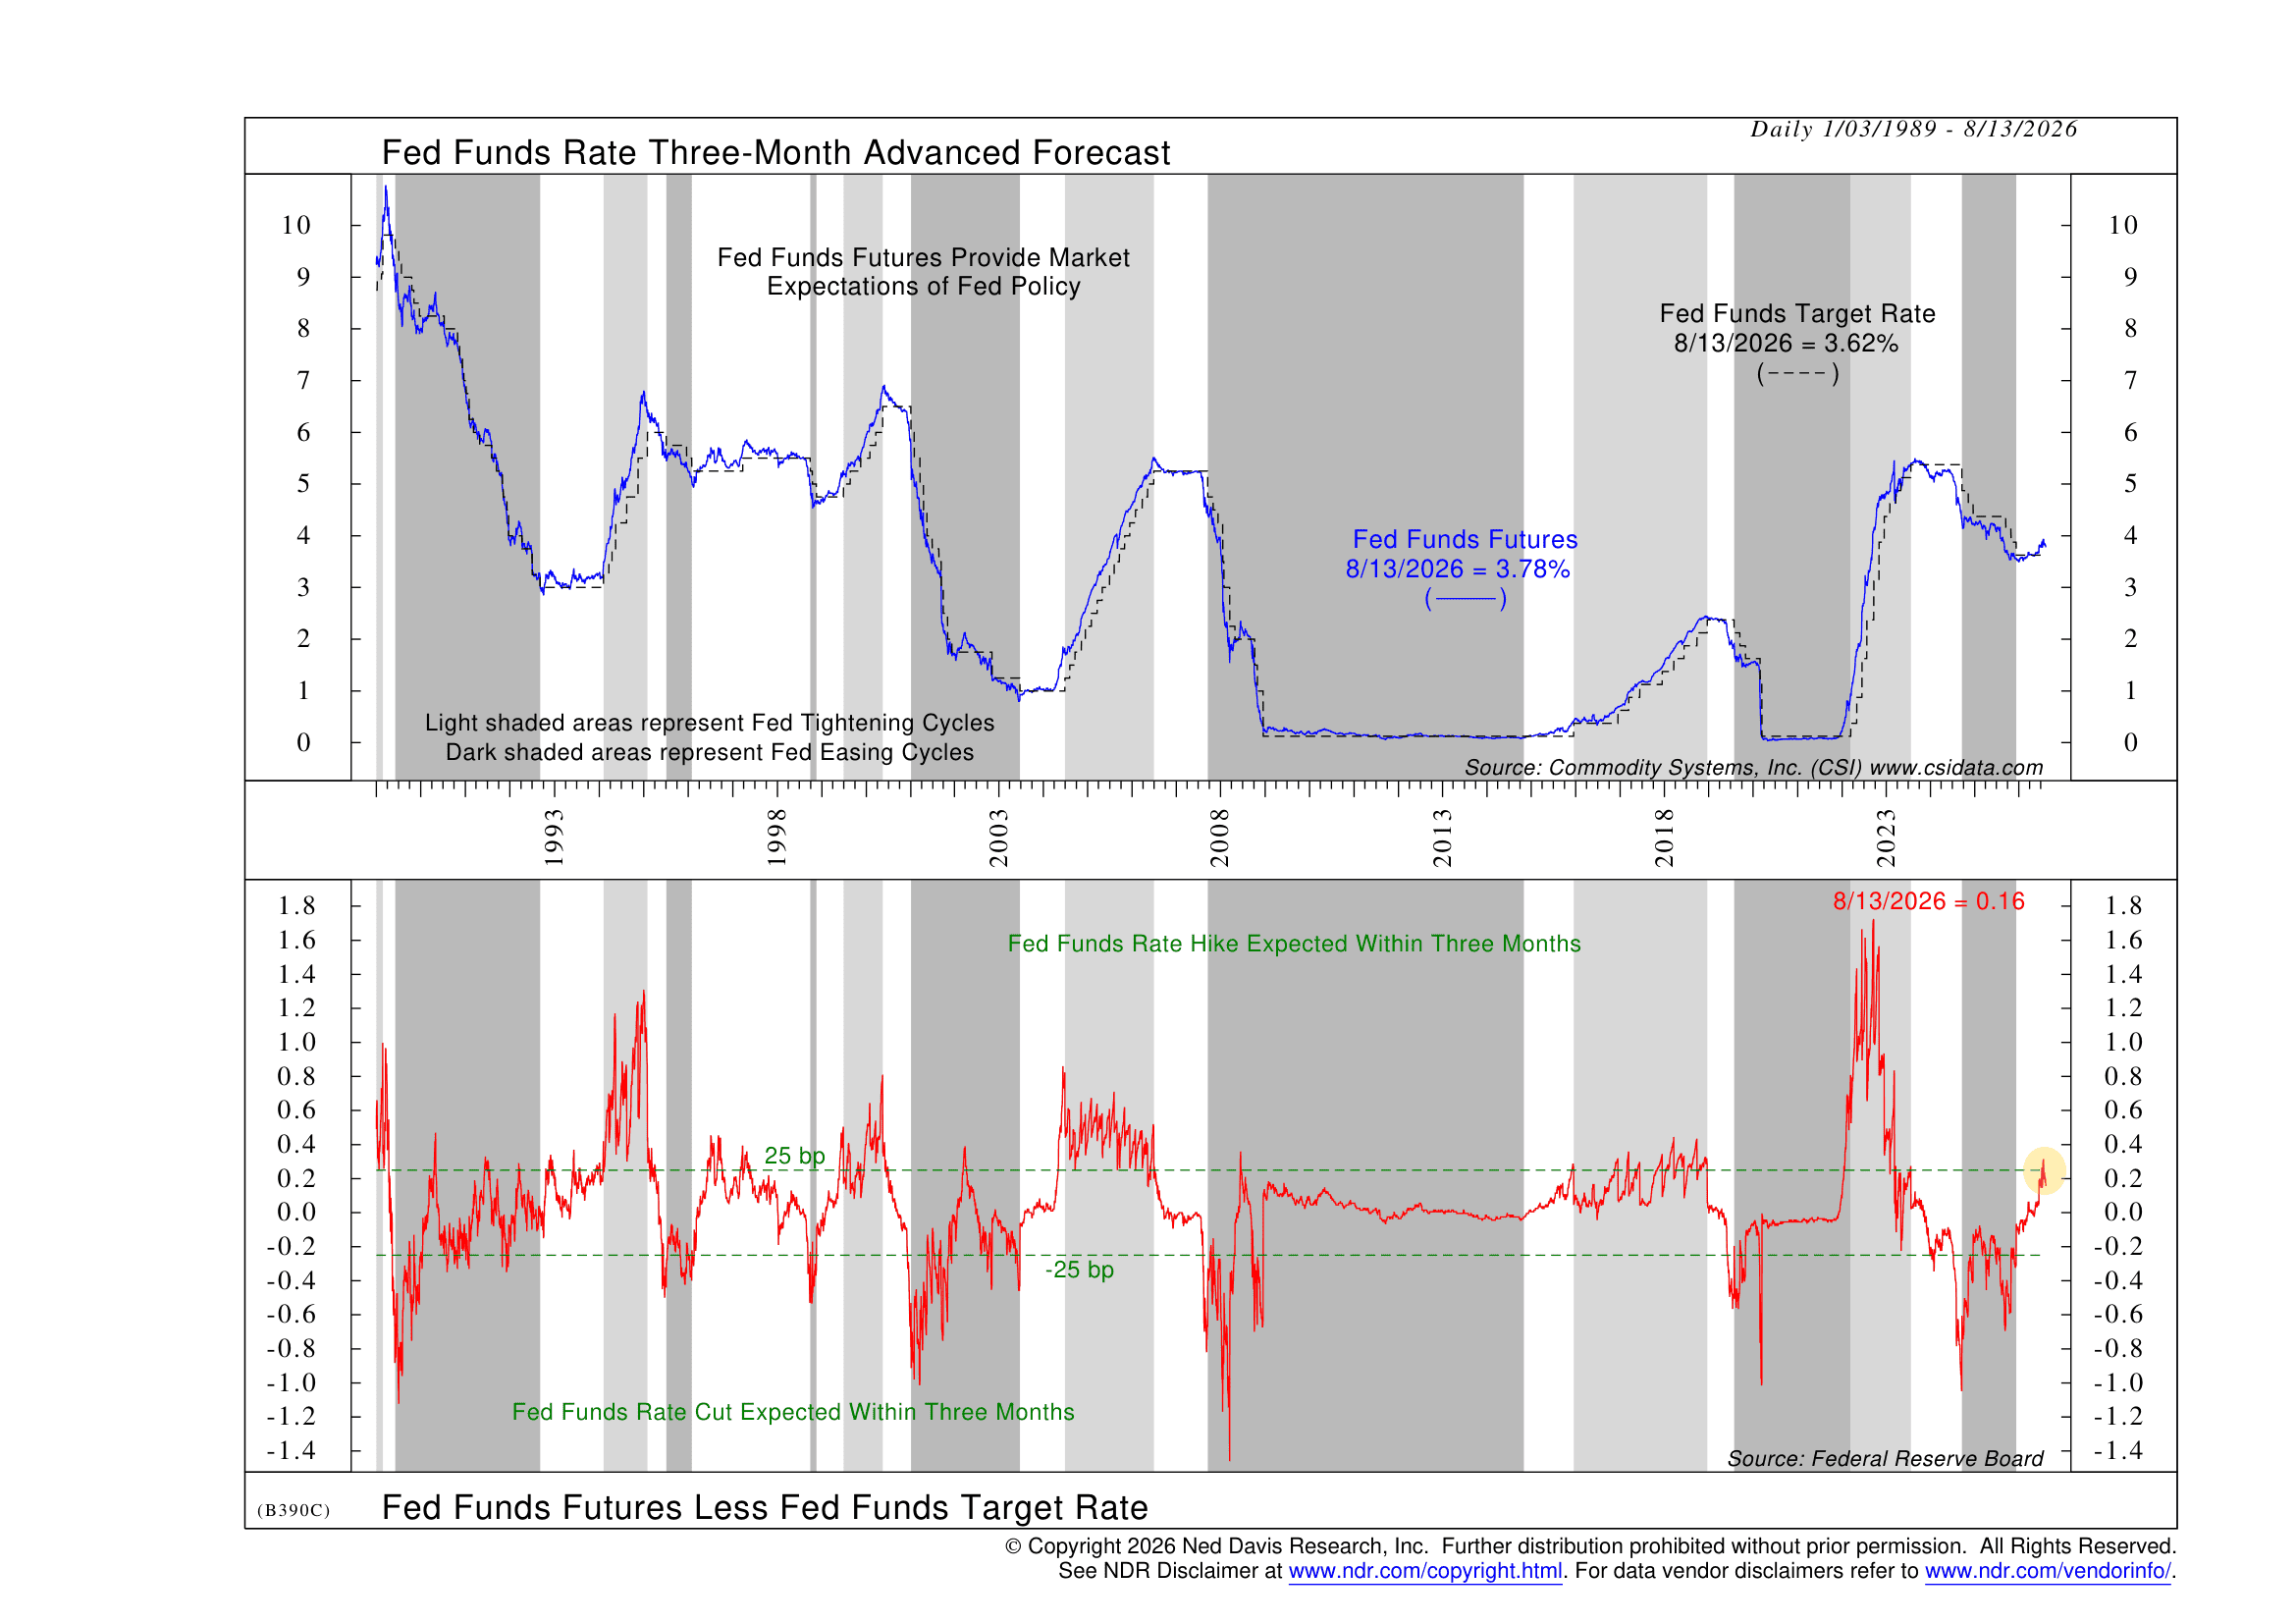
Now, that doesn’t necessarily mean rate cuts are right around the corner. But from the stock market’s perspective, simply removing some of the threat of tighter monetary policy can be helpful.
We can see that in our indicators as well.
One of the key measures we follow looks at the momentum of short-term Treasury bill yields. Historically, falling short-term rate momentum has been a favorable environment for stocks. When the indicator has been on a buy signal, the S&P 500 has gained 12.1% per year on average, compared with a 4.6% annualized decline during sell signals.
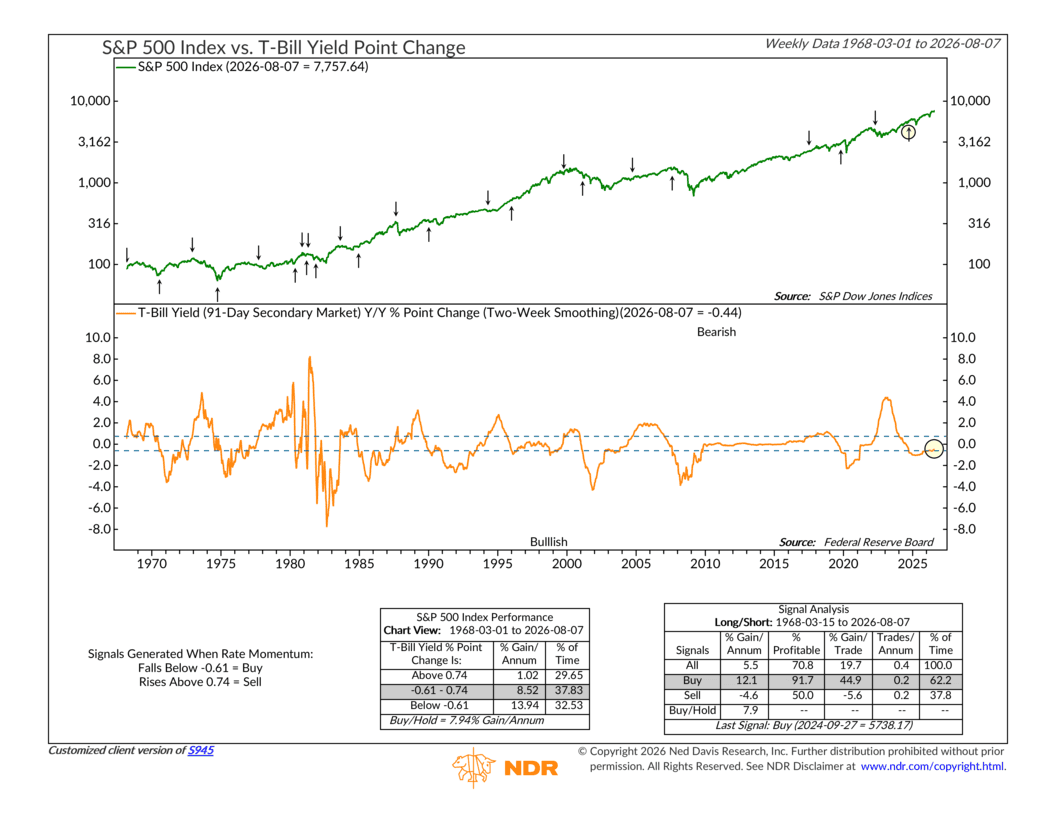
The indicator remains on a buy signal today.
Of course, none of this means the market can’t experience a pullback. There are still plenty of risks worth watching, and quiet markets don’t stay quiet forever.
But for now, the trend remains positive, short-term interest-rate momentum remains supportive, and expectations for aggressive Fed tightening have eased. In other words, there simply hasn’t been enough bad news to knock the market off course.
The tape may be dull. But as the old Wall Street saying reminds us, sometimes a quiet market is one you don’t want to bet against.
This is intended for informational purposes only and should not be used as the primary basis for an investment decision. Consult an advisor for your personal situation.
Indices mentioned are unmanaged, do not incur fees, and cannot be invested into directly.
Past performance does not guarantee future results.
The S&P 500 Index, or Standard & Poor’s 500 Index, is a market-capitalization-weighted index of 500 leading publicly traded companies in the U.S.
The Dow Jones Industrial Average (DJIA) is a price-weighted index composed of 30 widely traded blue-chip U.S. common stocks. The Nasdaq 100 Index is a basket of the 100 largest, most actively traded U.S. companies listed on the Nasdaq stock exchange. The index includes companies from various industries except for the financial industry, like commercial and investment banks. The Russell 3000 Index is a capitalization-weighted stock market index that seeks to be a benchmark of the entire U.S. stock market. The S&P MidCap 400 is designed to measure the performance of 400 mid-sized companies, reflecting the distinctive risk and return characteristics of this market segment. S&P 600 Index measures the small-cap segment of the U.S. equity market. The index is designed to track companies that meet specific inclusion criteria to ensure that they are liquid and financially viable. The S&P 100 index is a capitalization-weighted index based on 100 highly capitalized stocks for which options are listed on the CBOE (Chicago Board of Exchange). The MSCI EAFE Index is an equity index which captures large and mid cap representation across 21 Developed Markets countries* around the world, excluding the US and Canada.
The Bloomberg U.S. Corporate Bond Index measures the investment grade, fixed-rate, taxable corporate bond market. The Bloomberg U.S. Corporate High Yield Index is comprised of domestic and corporate bonds rated Ba and below with a minimum outstanding amount of $150 million. The Bloomberg U.S. Municipal Index covers the USD-denominated long-term tax exempt bond market. The index has four main sectors: state and local general obligation bonds, revenue bonds, insured bonds and prerefunded bonds.