OVERVIEW
Markets finished the holiday-shortened week on a constructive note, with broad-based gains across most major asset classes. U.S. equities moved higher, led by large-cap stocks. The S&P 500 rose 1.40% on the week, while the NASDAQ added 1.22%. The Dow Jones Industrial Average gained 1.20%, and the S&P 100 climbed 1.48%.
Participation broadened beneath the surface. Small- and mid-cap stocks both advanced, with the S&P 400 up 0.69% and the S&P 600 gaining 0.53%. The Russell 3000 rose 1.31%, with growth stocks modestly outpacing value, as Russell 3000 Growth gained 1.43% versus a 1.17% advance for value.
International markets also contributed. Developed international stocks were higher, with EAFE up 1.20%, while emerging markets led globally, gaining 2.11% on the week. For the year, non-U.S. equities continue to show meaningful leadership.
Fixed income posted modest gains across the board. Treasury returns were positive along the curve, and both investment-grade and high-yield bonds finished higher. Inflation-protected securities and municipal bonds also edged up, reflecting a relatively supportive environment for bonds despite elevated yields.
Commodities stood out as one of the strongest areas. Broad commodities jumped 3.37%, led by a sharp move higher in gold, which gained 3.77% on the week. Oil prices rose 0.66%. At the same time, the U.S. dollar weakened meaningfully, falling 3.92%, which provided an additional tailwind for commodity prices.
Volatility remained subdued. The VIX ended the week at 13.6, a level consistent with calm market conditions as the year draws to a close.
KEY CONSIDERATIONS
Not Overly Excited – When I look at the weight of the evidence across our risk models, the trend certainly feels bullish. It feels like the model wants to turn all the way bullish but just needs a small nudge to get over the proverbial hump.
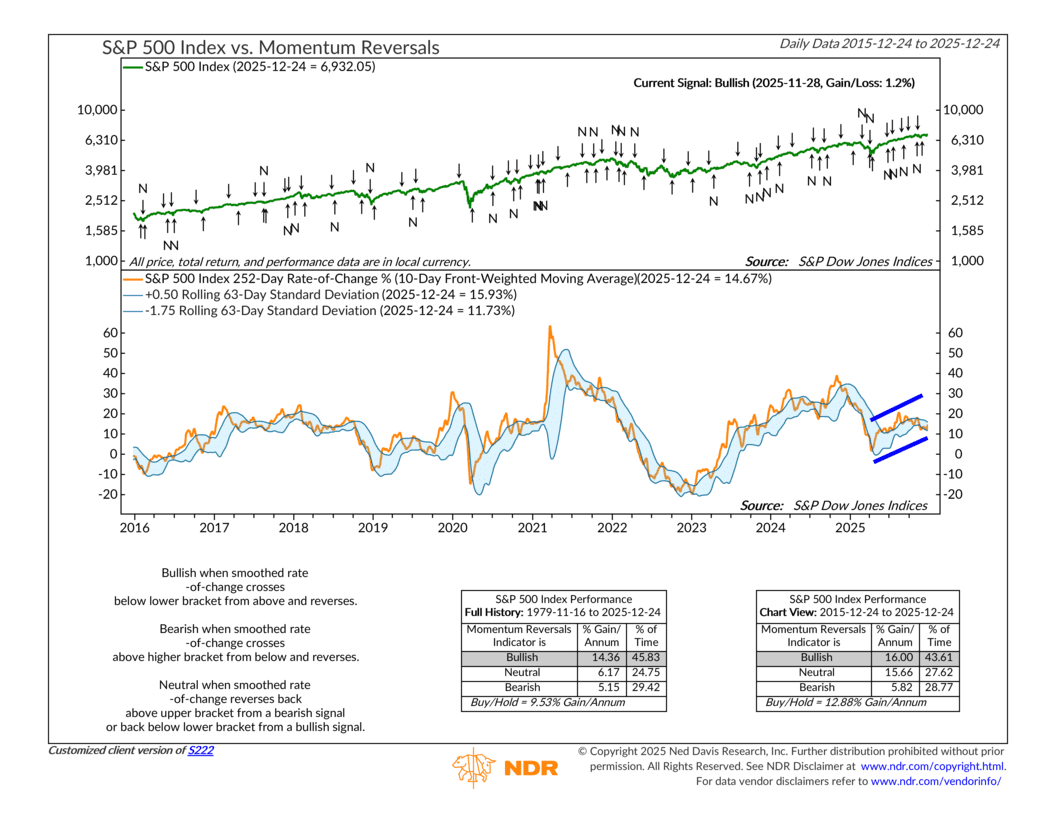
For example, from a price-based standpoint, we see things like momentum staying strong. As shown below, the 252-day rate of change for the S&P 500 continues to trend higher. And even after a brief slowdown, the indicator has turned back up, suggesting the longer-term trend remains on solid footing.
But with that said, not every part of the model is sending the same signal. Investor Behavior has been softer lately. One reason is the drop in volatility. When volatility compresses, some short-term bullish signals lose their effectiveness compared to a few weeks ago.
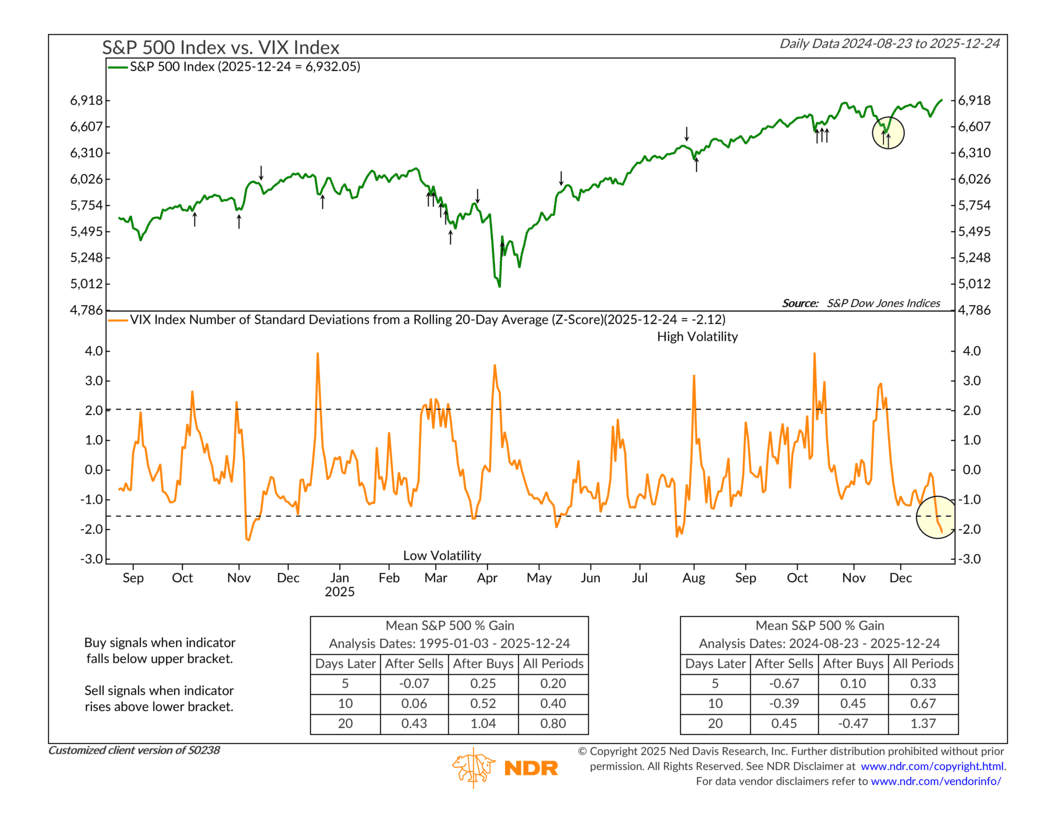
Take the volatility signal shown below. This indicator generates a bullish signal for stocks that lasts 20 trading days following a high but declining VIX reading. The most recent signal from late November has now expired, which leaves the volatility component sitting in a low-neutral position rather than actively supportive.
But what’s really missing most right now is urgency.
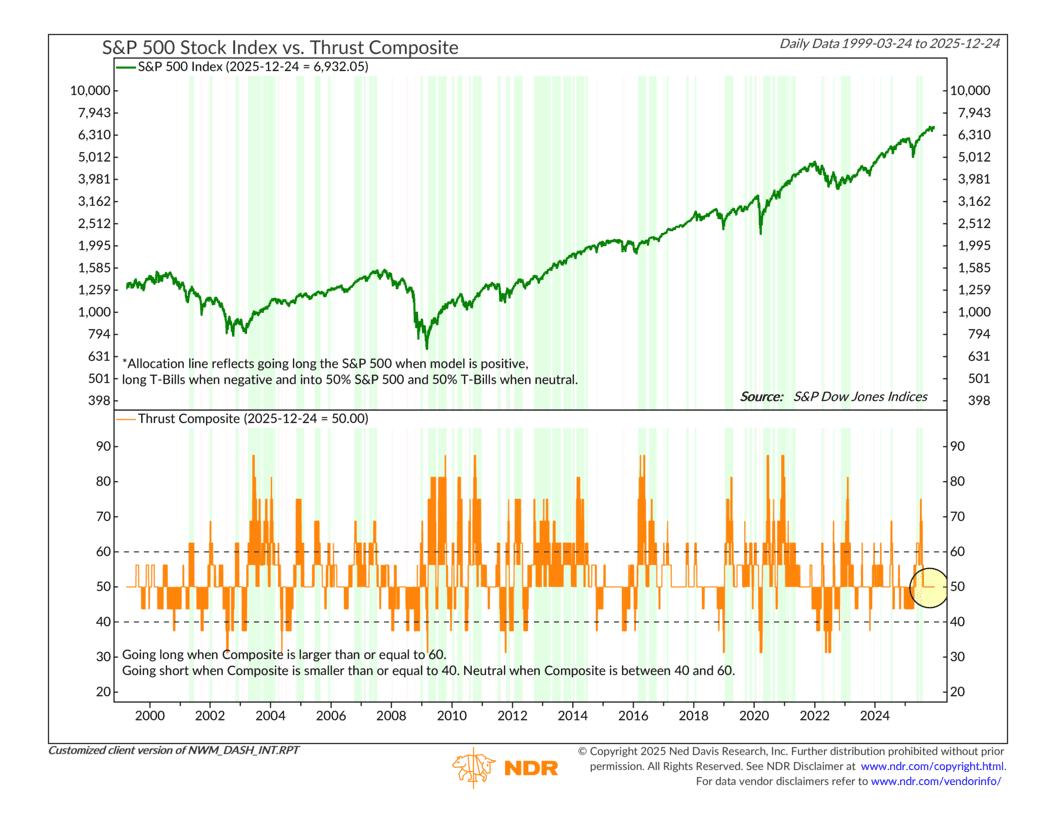
That shows up in thrust indicators. These signals tend to fire when the market accelerates sharply over a short period of time. But as the Thrust Composite below shows, these indicators have been stuck in neutral for a couple of months now. Sure, stocks are grinding higher, but they’re doing it quietly, taking one step at a time.
So, the bottom line is that this looks like a market that’s comfortable but not overly excited. Trends like this can last longer than people expect. But they also tend to rely on patience rather than momentum. Until we see a burst of participation or a change in investor behavior, the model stays cautiously optimistic.
In other words, it’s leaning bullish, just without the adrenaline.
This is intended for informational purposes only and should not be used as the primary basis for an investment decision. Consult an advisor for your personal situation.
Indices mentioned are unmanaged, do not incur fees, and cannot be invested into directly.
Past performance does not guarantee future results.
The S&P 500 Index, or Standard & Poor’s 500 Index, is a market-capitalization-weighted index of 500 leading publicly traded companies in the U.S.
The Dow Jones Industrial Average (DJIA) is a price-weighted index composed of 30 widely traded blue-chip U.S. common stocks. The Nasdaq 100 Index is a basket of the 100 largest, most actively traded U.S. companies listed on the Nasdaq stock exchange. The index includes companies from various industries except for the financial industry, like commercial and investment banks. The Russell 3000 Index is a capitalization-weighted stock market index that seeks to be a benchmark of the entire U.S. stock market. The S&P MidCap 400 is designed to measure the performance of 400 mid-sized companies, reflecting the distinctive risk and return characteristics of this market segment. S&P 600 Index measures the small-cap segment of the U.S. equity market. The index is designed to track companies that meet specific inclusion criteria to ensure that they are liquid and financially viable. The S&P 100 index is a capitalization-weighted index based on 100 highly capitalized stocks for which options are listed on the CBOE (Chicago Board of Exchange). The MSCI EAFE Index is an equity index which captures large and mid cap representation across 21 Developed Markets countries* around the world, excluding the US and Canada.
The Bloomberg U.S. Corporate Bond Index measures the investment grade, fixed-rate, taxable corporate bond market. The Bloomberg U.S. Corporate High Yield Index is comprised of domestic and corporate bonds rated Ba and below with a minimum outstanding amount of $150 million. The Bloomberg U.S. Municipal Index covers the USD-denominated long-term tax exempt bond market. The index has four main sectors: state and local general obligation bonds, revenue bonds, insured bonds and prerefunded bonds.