OVERVIEW
KEY CONSIDERATIONS
Not So Fast – It was another solid week for the U.S. stock market. The S&P 500 held its ground following April’s powerful rally, and our overall stock market risk model continues to point toward higher prices.
So far, so good. But if you look closely at what’s happening under the hood, the picture is getting a bit more complicated—and a few signals are worth paying close attention to right now.
Let’s start with how investors are feeling, because the mood has shifted. Our Surveys Composite—shown below—just moved into “sell” territory this week.
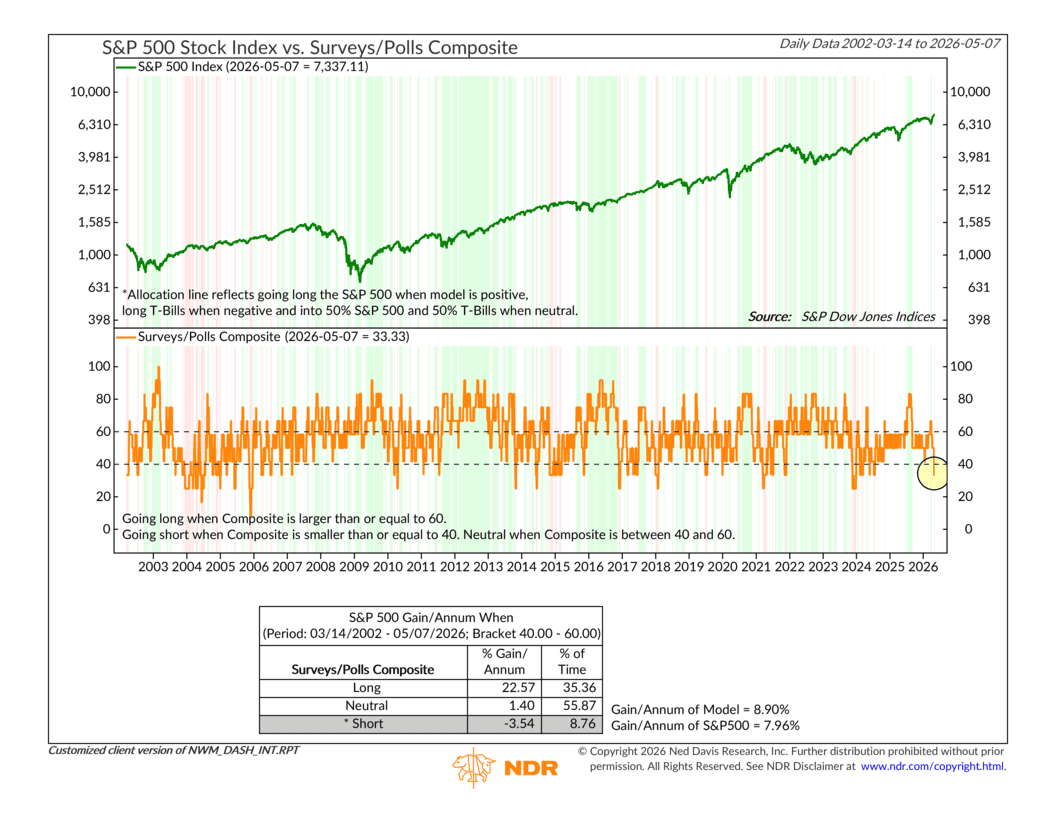
This composite pulls together readings from investor and consumer sentiment surveys to measure whether optimism or pessimism has reached levels historically associated with stronger or weaker stock market returns. And right now, it’s flashing caution, not because investors are fearful, but because optimism has started to become excessive.
That might sound surprising given the headlines still hanging over the market. Inflation remains sticky, geopolitical tensions continue to weigh on the outlook, and many investors say they’re still uneasy about the economy. But sentiment models like this are contrarian by nature. They don’t just focus on what investors say, they focus on how crowded the mood has become.
Following April’s sharp rally, optimism rebounded quickly. Historically, when sentiment swings too far in that direction, future stock market returns tend to become more challenged.
It’s also worth noting that our Volatility Composite moved to “sell” territory this week as well.
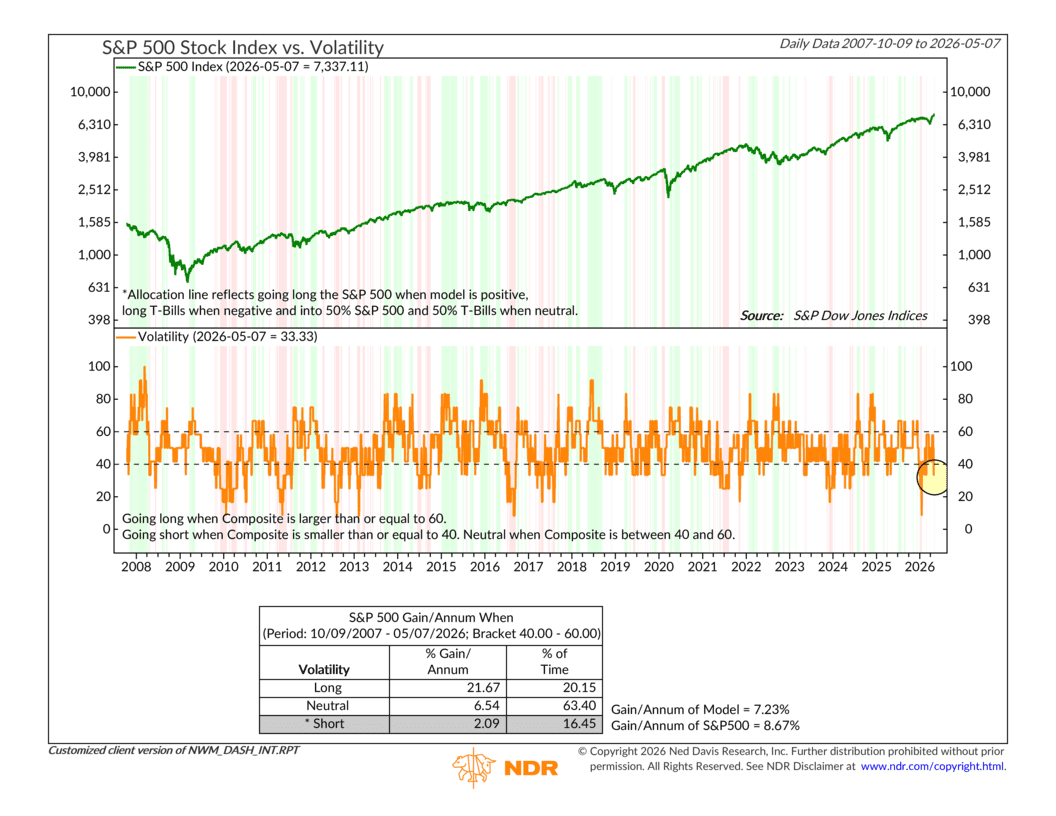
Elevated market volatility isn’t just uncomfortable to watch—it’s historically been a headwind for sustained stock market gains. When volatility is high, uncertainty is high, and uncertainty tends to make investors cautious about committing new money to stocks.
Both of these—the surveys and the volatility reading—are components of our Investor Behavior composite, which has been steadily weakening over the past few weeks.
Oh, and then there’s the cycle composite—shown below. This is one of those big-picture indicators that we don’t highlight every week, but it’s worth revisiting right now.
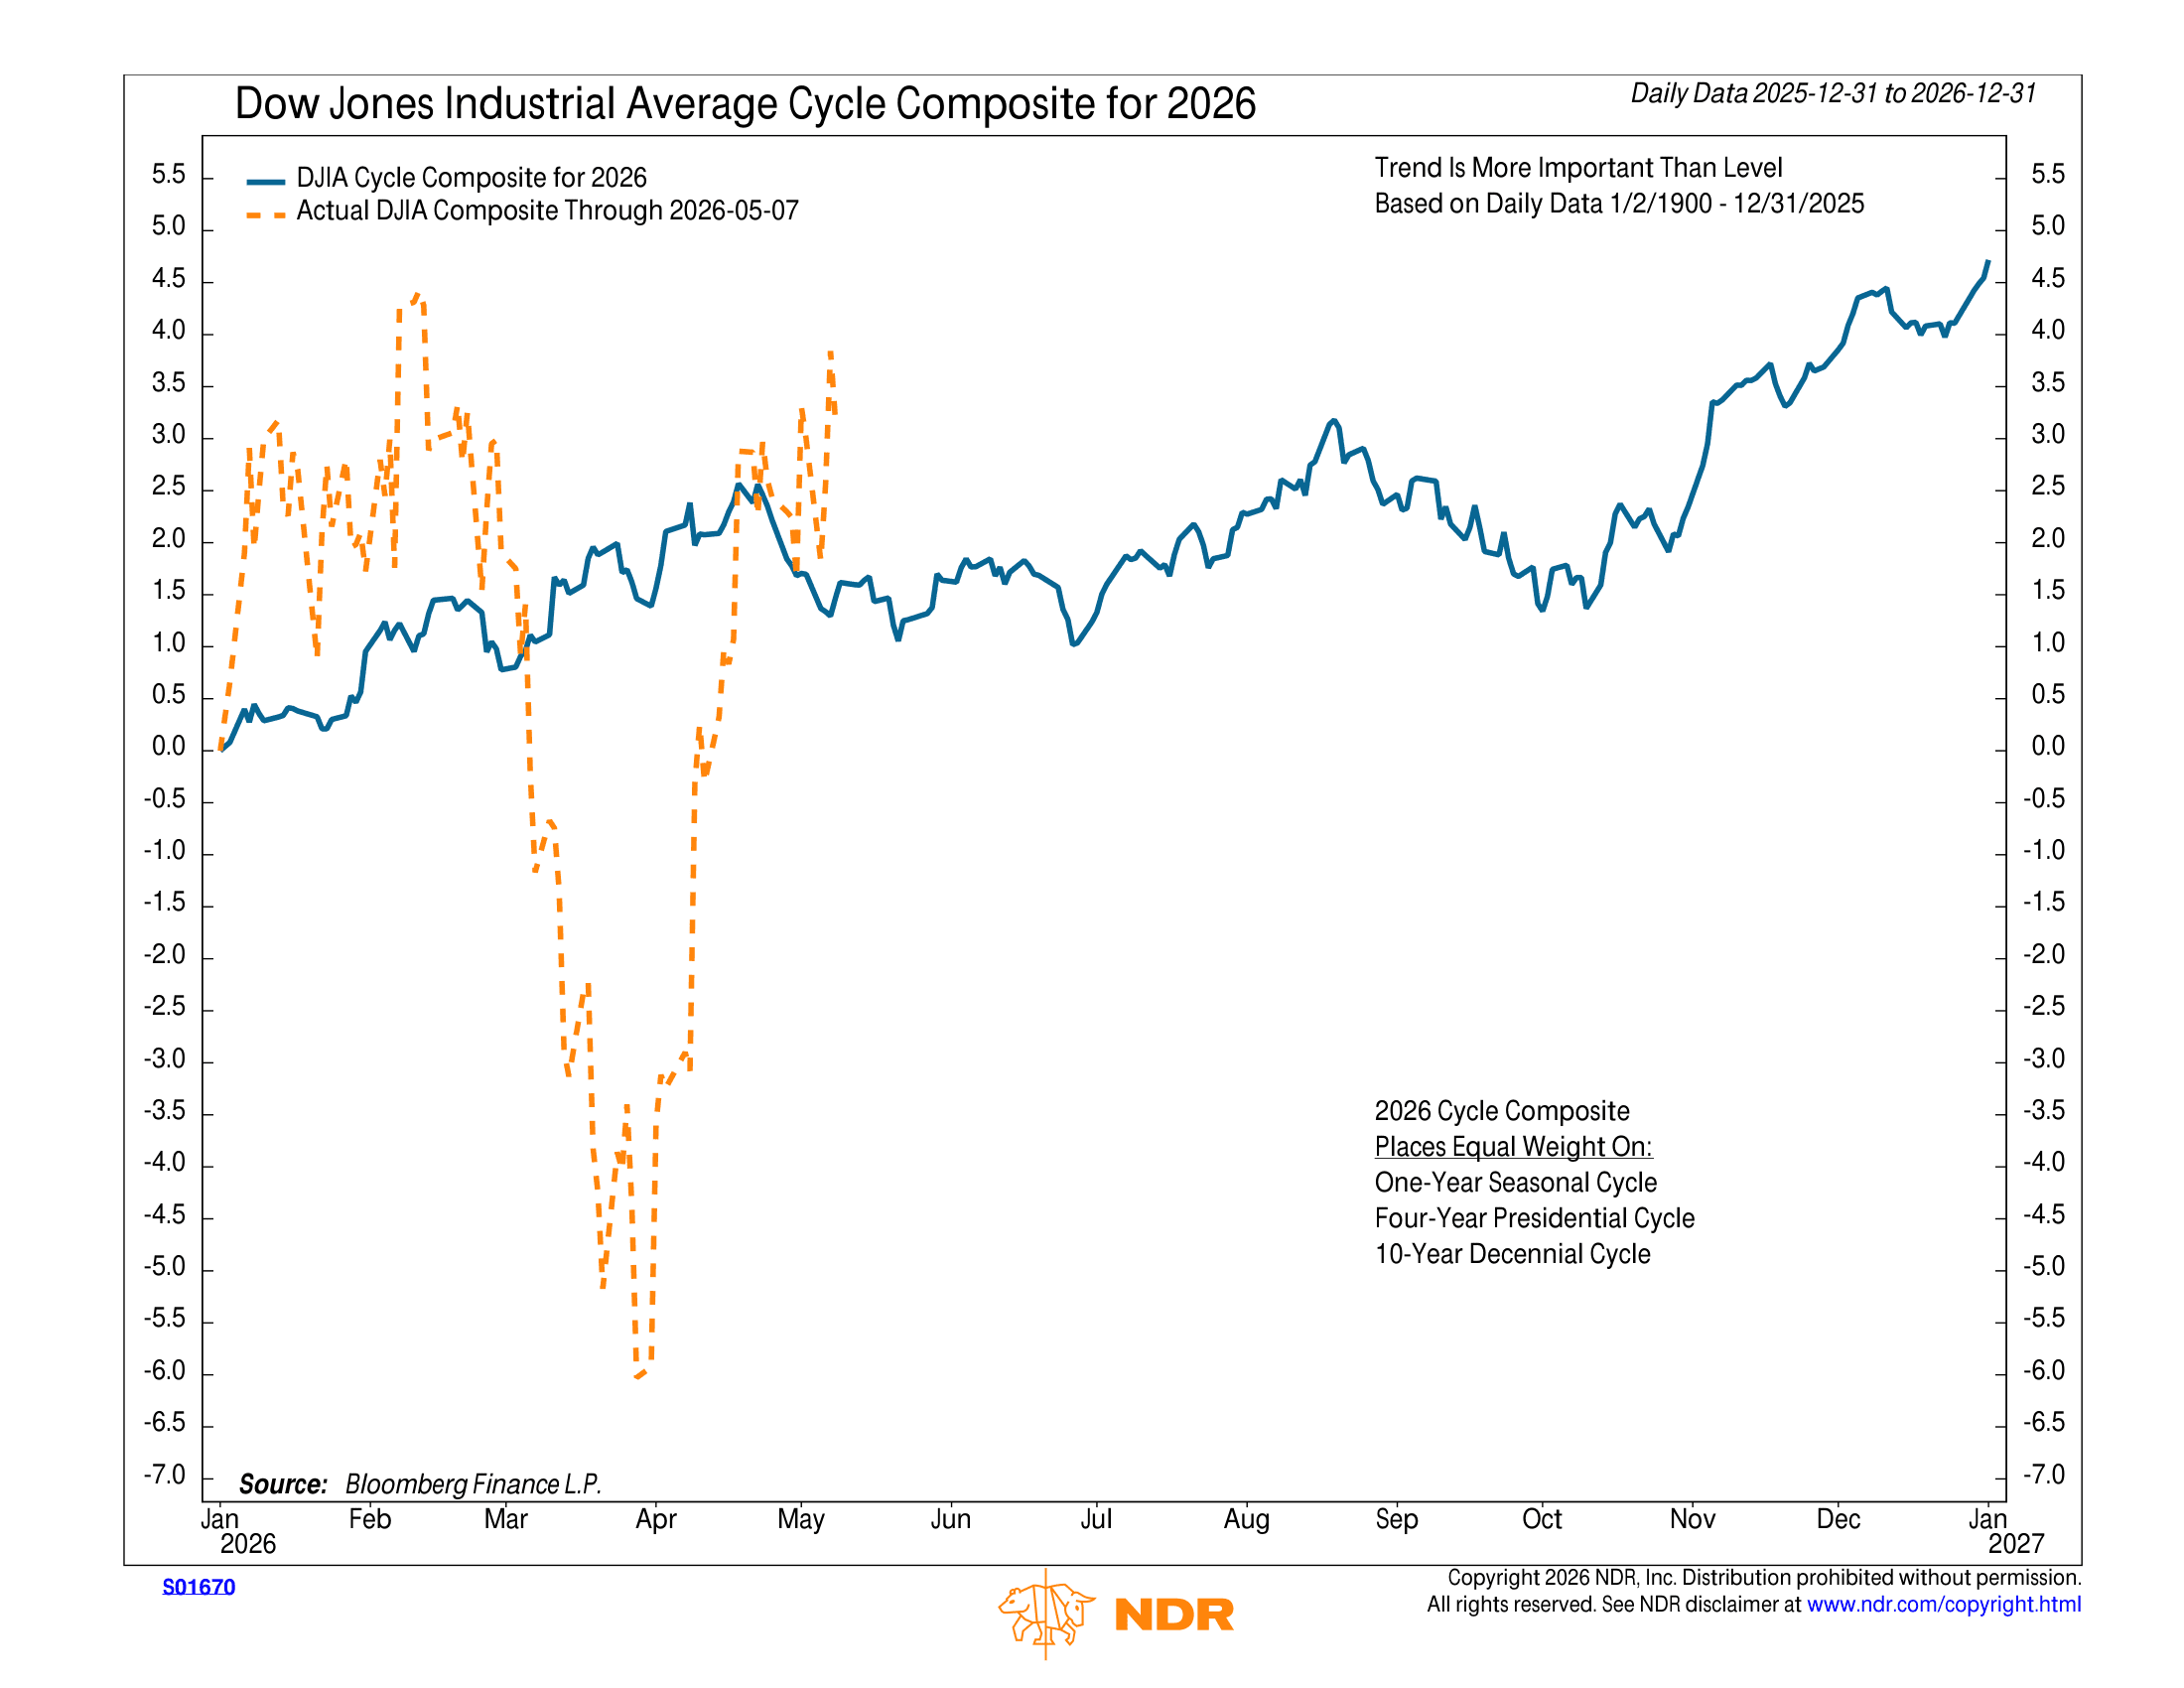
The NDR Cycle Composite blends historical seasonal patterns for the current year into a roadmap of likely market behavior. After the March selloff and the April recovery, the cycle composite is now pointing toward neutral-to-lower conditions from here through roughly October. In other words, the tailwind we got from the bounce off the lows may be fading—and the calendar itself isn’t doing us any favors for the next several months.
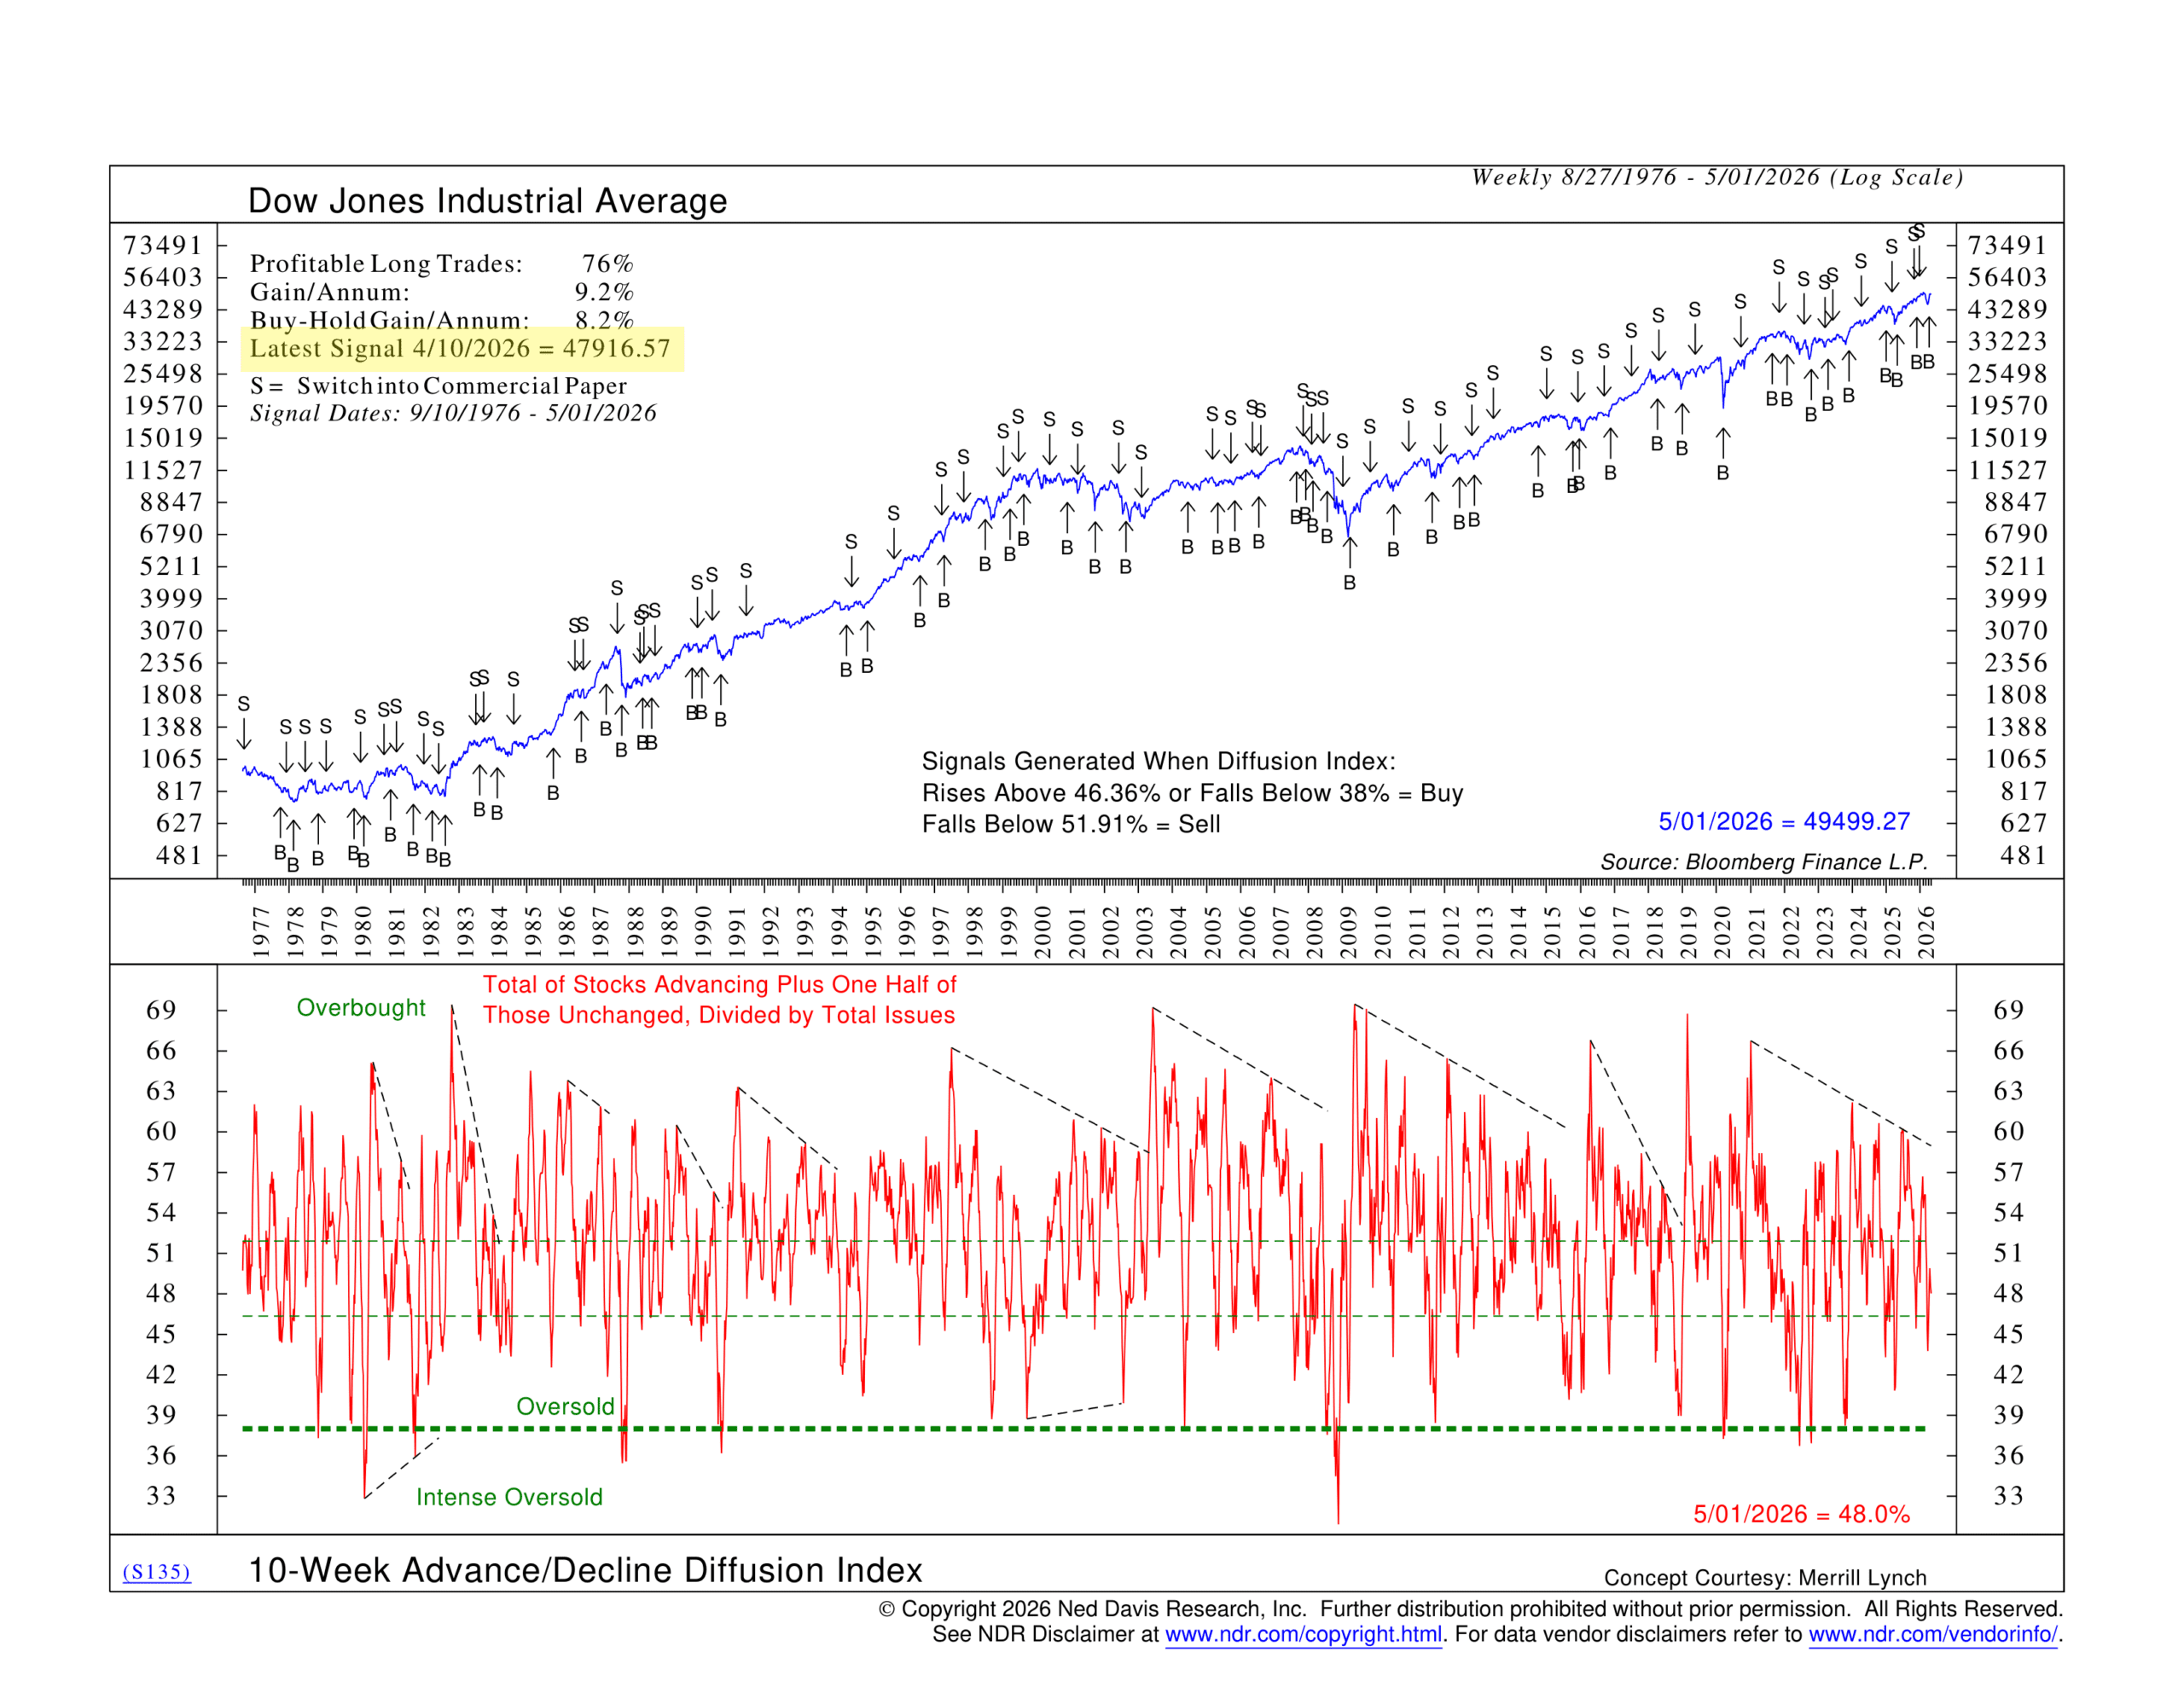
To be clear, there are still reasons to stay constructive. Our overall model remains on a Buy signal, which deserves respect. Price momentum is healthy. And the 10-week Advance/Decline Diffusion Index—a measure of how broadly stocks are participating in the market’s moves—is still on its buy signal from a month ago, which is an encouraging sign of underlying breadth.
As one veteran market observer aptly put it this week: the tape bent, but it didn’t break. And you don’t want to fight a bullish tape.
The bottom line? The model’s Buy signal is intact, and we’re not suggesting you abandon the ship. But the easy gains from the March lows are likely behind us. Sentiment has turned, volatility is elevated, and the seasonal winds are starting to shift. The path higher from here will probably require more patience—and more proof—than the market has had to show in recent weeks. We’d say proceed with cautious optimism.
This is intended for informational purposes only and should not be used as the primary basis for an investment decision. Consult an advisor for your personal situation.
Indices mentioned are unmanaged, do not incur fees, and cannot be invested into directly.
Past performance does not guarantee future results.
The S&P 500 Index, or Standard & Poor’s 500 Index, is a market-capitalization-weighted index of 500 leading publicly traded companies in the U.S.
The Dow Jones Industrial Average (DJIA) is a price-weighted index composed of 30 widely traded blue-chip U.S. common stocks. The Nasdaq 100 Index is a basket of the 100 largest, most actively traded U.S. companies listed on the Nasdaq stock exchange. The index includes companies from various industries except for the financial industry, like commercial and investment banks. The Russell 3000 Index is a capitalization-weighted stock market index that seeks to be a benchmark of the entire U.S. stock market. The S&P MidCap 400 is designed to measure the performance of 400 mid-sized companies, reflecting the distinctive risk and return characteristics of this market segment. S&P 600 Index measures the small-cap segment of the U.S. equity market. The index is designed to track companies that meet specific inclusion criteria to ensure that they are liquid and financially viable. The S&P 100 index is a capitalization-weighted index based on 100 highly capitalized stocks for which options are listed on the CBOE (Chicago Board of Exchange). The MSCI EAFE Index is an equity index which captures large and mid cap representation across 21 Developed Markets countries* around the world, excluding the US and Canada.
The Bloomberg U.S. Corporate Bond Index measures the investment grade, fixed-rate, taxable corporate bond market. The Bloomberg U.S. Corporate High Yield Index is comprised of domestic and corporate bonds rated Ba and below with a minimum outstanding amount of $150 million. The Bloomberg U.S. Municipal Index covers the USD-denominated long-term tax exempt bond market. The index has four main sectors: state and local general obligation bonds, revenue bonds, insured bonds and prerefunded bonds.