
OVERVIEW
KEY CONSIDERATIONS
Outside the Lines – Sometimes I come across a chart that really puts things into perspective. The chart below did that for me this week. It plots the S&P 500 all the way back to 1928 inside a channel that captures roughly a century of market history.
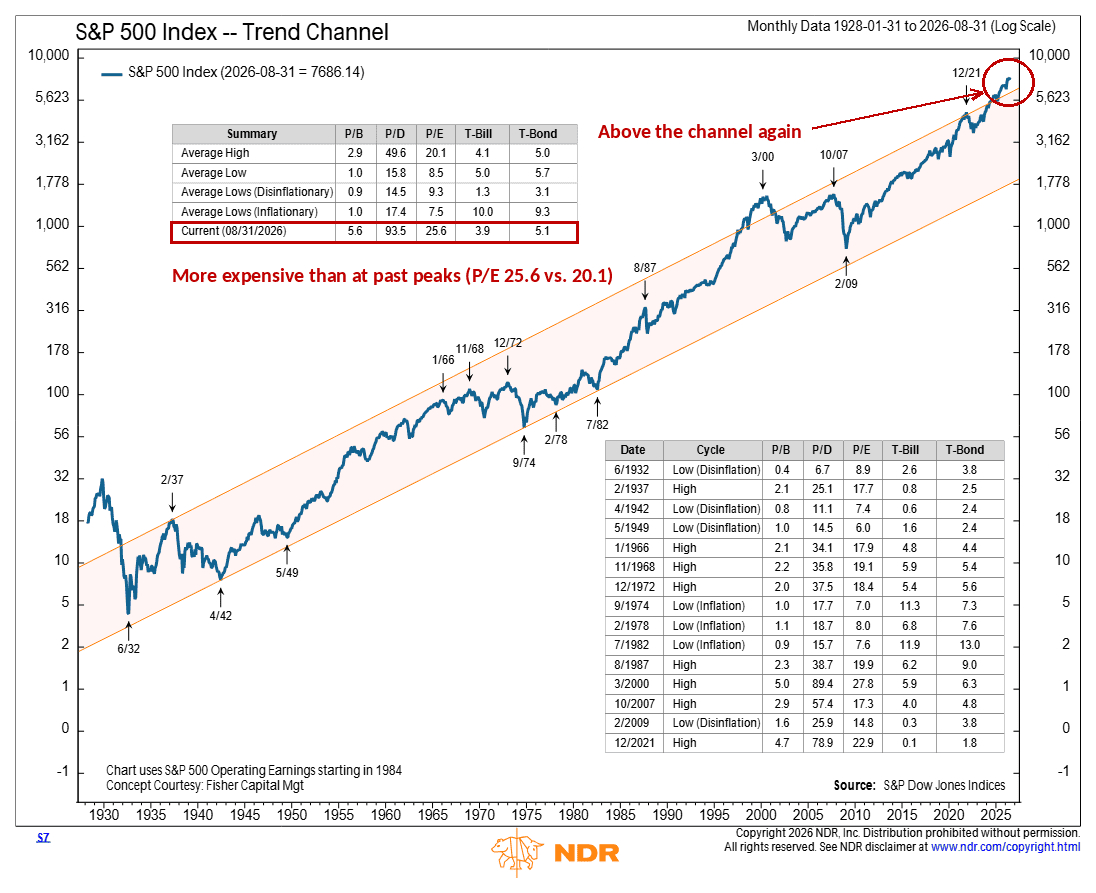
As you can see, most of the time, the index stays inside the lines. Only twice before—in 2000 and 2021—has it pushed clearly above the top of the channel, and it brushed up against the line in 1937 and 2007. Every one of those dates marked a major market peak.
Today, the S&P 500 is above the top of the channel again.
The table on the chart is worth a look, too. At the average past peak, the S&P 500 traded at about 20 times earnings. Today it trades at roughly 26. And long-term Treasury yields are a bit higher now than they were at those prior tops.
That last point matters, because interest rates were a big story of the week.
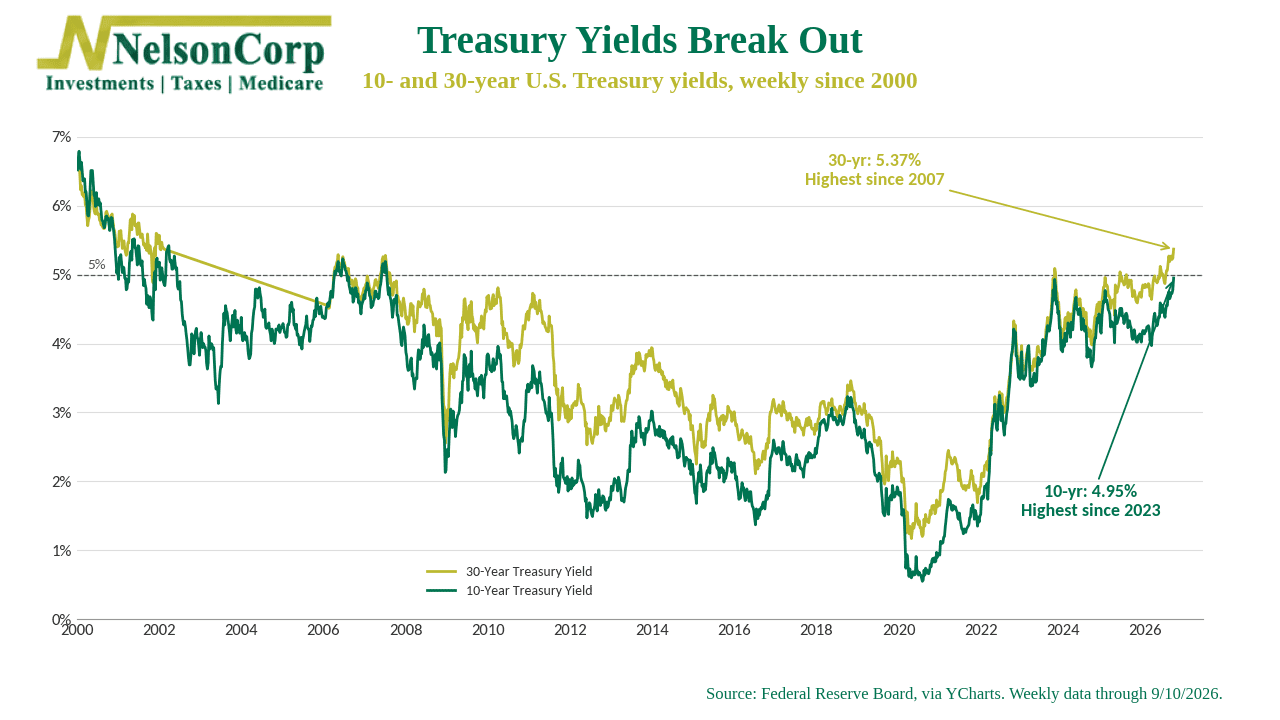
As the second chart shows, the 30-year Treasury yield hit 5.37% on Thursday, its highest level since 2007. The 10-year climbed to 4.95% and brushed up against 5% on Friday. Oil is back above $100 a barrel after an attack on Saudi oil infrastructure, producer prices are up 5.4% over the past year, and Friday’s CPI report showed consumer prices up 3.4%, with gasoline alone accounting for over a third of last month’s increase.
The odds of a Fed rate hike on Wednesday now sit around 70%.
Here’s why that matters for stocks. This next chart compares the S&P 500’s earnings yield (earnings divided by price) with a composite of interest rates. Think of it as how much stocks “pay” you relative to bonds. Today the earnings yield is 3.5% while the interest rate composite is 5.0%, and the ratio between the two has just slipped below its lower band.
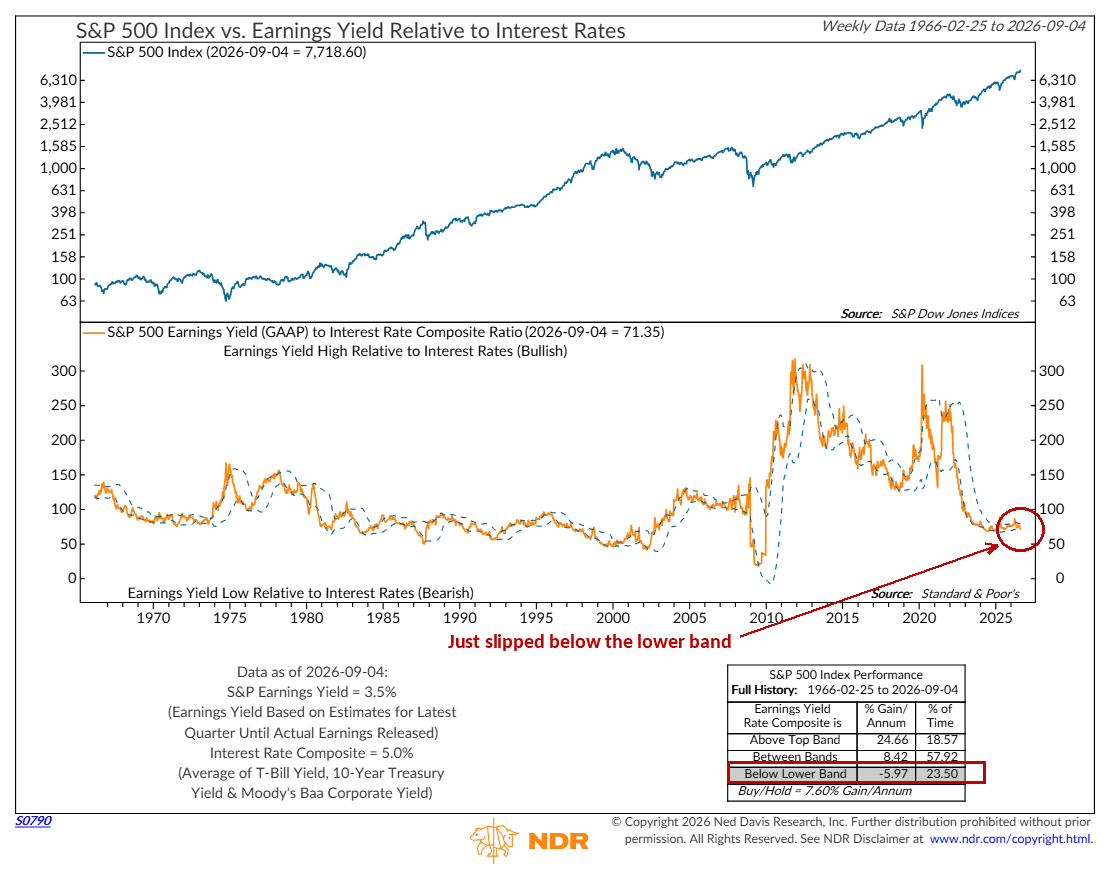
Historically, that hasn’t been a great place to be. Since 1966, the S&P 500 has lost about 6% per year when this ratio was below the band, compared with gains of nearly 25% per year when it was above the top band.
In plain English: for the first time in years, bonds are putting up a real fight for investors’ dollars.
So, is it time to worry? Well, I’d put it differently. These are late-cycle signals, and late-cycle is not the same as end-of-cycle. The trend indicators we follow are still positive. Earnings are still growing, and estimates for the fourth quarter have moved higher, not lower. And the asset allocation models we follow still favor stocks over bonds, even after this week.
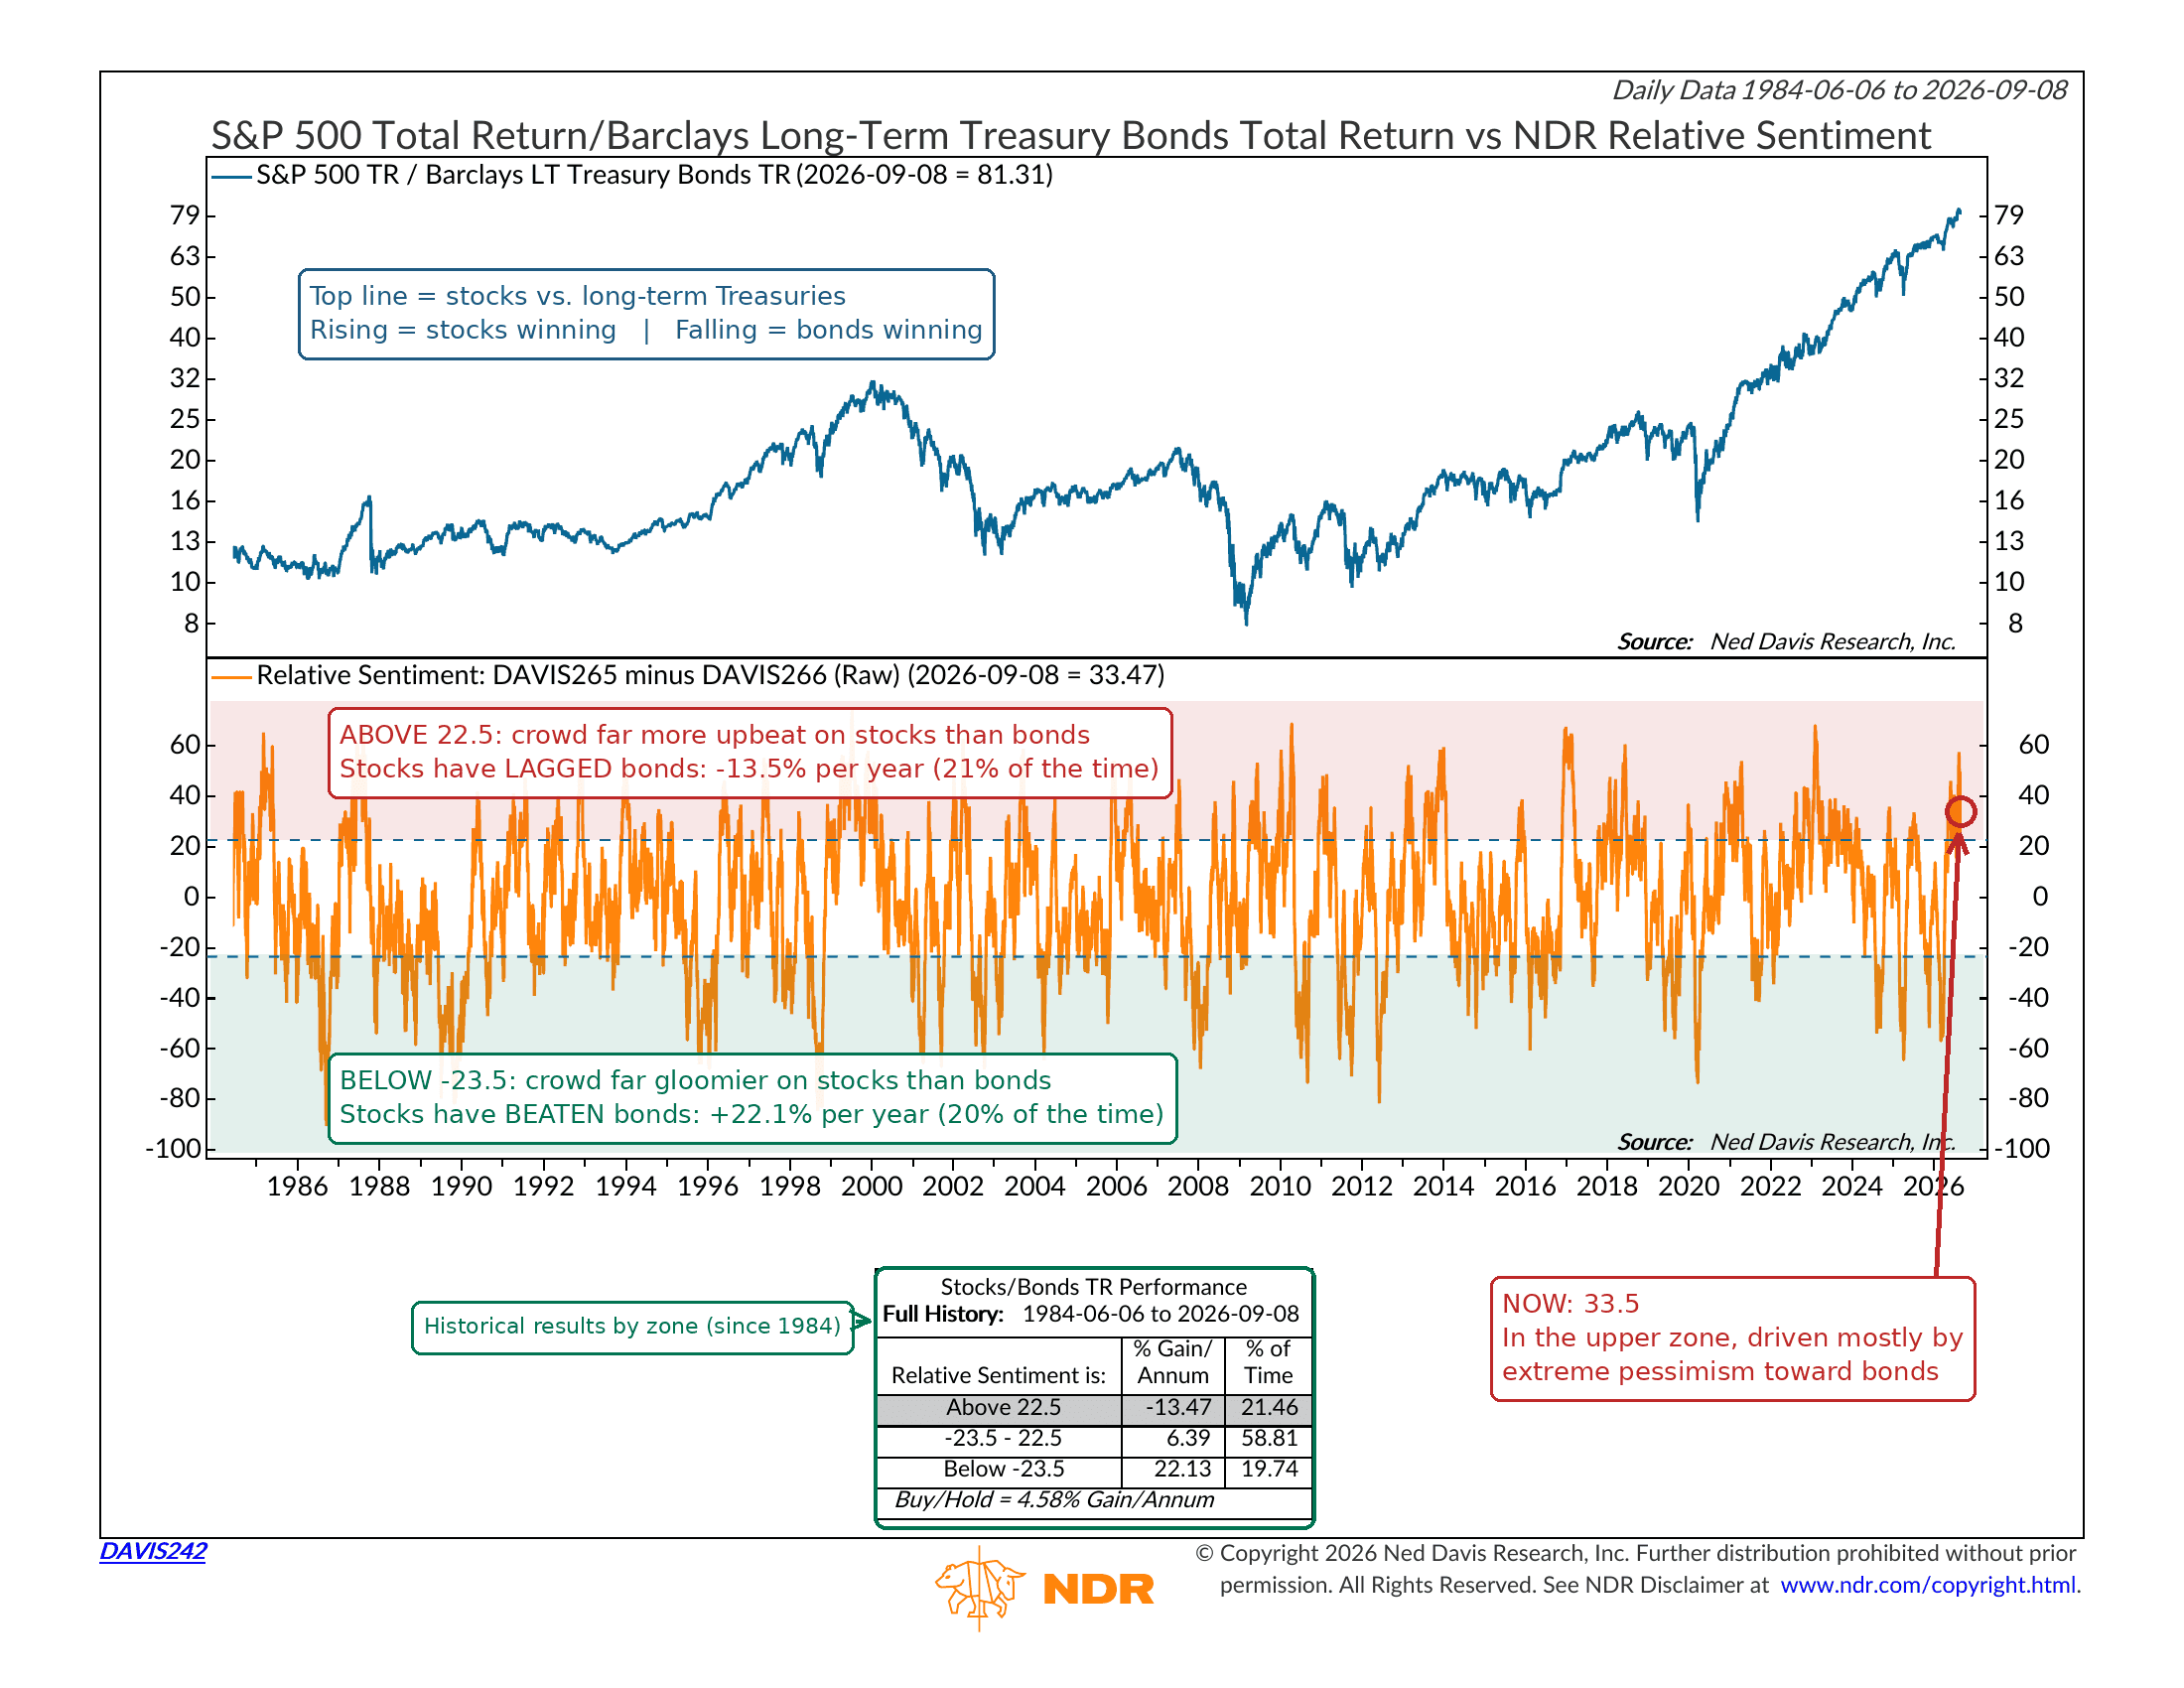
There’s a potential silver lining in the bond market, too. As we discussed in this week’s Indicator Insights, investors have become extremely pessimistic on bonds. Sentiment that lopsided has a way of reversing, and a pause in the rise in yields would take a lot of pressure off stocks heading into the fall.
The bottom line? The market is trading outside the lines. It’s stretched relative to its own history, and higher interest rates are making the competition for capital stiffer than it has been in years. That argues for tempered expectations and some patience over the next couple of months—not for abandoning a trend that is still intact.
The Fed decides on Wednesday. But the bigger test may be whether the 10-year Treasury yield stays below 5%.
This is intended for informational purposes only and should not be used as the primary basis for an investment decision. Consult an advisor for your personal situation.
Indices mentioned are unmanaged, do not incur fees, and cannot be invested into directly.
Past performance does not guarantee future results.
The S&P 500 Index, or Standard & Poor’s 500 Index, is a market-capitalization-weighted index of 500 leading publicly traded companies in the U.S.
The Dow Jones Industrial Average (DJIA) is a price-weighted index composed of 30 widely traded blue-chip U.S. common stocks. The Nasdaq 100 Index is a basket of the 100 largest, most actively traded U.S. companies listed on the Nasdaq stock exchange. The index includes companies from various industries except for the financial industry, like commercial and investment banks. The Russell 3000 Index is a capitalization-weighted stock market index that seeks to be a benchmark of the entire U.S. stock market. The S&P MidCap 400 is designed to measure the performance of 400 mid-sized companies, reflecting the distinctive risk and return characteristics of this market segment. S&P 600 Index measures the small-cap segment of the U.S. equity market. The index is designed to track companies that meet specific inclusion criteria to ensure that they are liquid and financially viable. The S&P 100 index is a capitalization-weighted index based on 100 highly capitalized stocks for which options are listed on the CBOE (Chicago Board of Exchange). The MSCI EAFE Index is an equity index which captures large and mid cap representation across 21 Developed Markets countries* around the world, excluding the US and Canada.
The Bloomberg U.S. Corporate Bond Index measures the investment grade, fixed-rate, taxable corporate bond market. The Bloomberg U.S. Corporate High Yield Index is comprised of domestic and corporate bonds rated Ba and below with a minimum outstanding amount of $150 million. The Bloomberg U.S. Municipal Index covers the USD-denominated long-term tax exempt bond market. The index has four main sectors: state and local general obligation bonds, revenue bonds, insured bonds and prerefunded bonds.