OVERVIEW
Markets finished mostly higher last week, with many major equity indexes posting gains. The S&P 500 rose 0.31%, the Dow added 0.50%, and the NASDAQ climbed 0.91%. Broader U.S. equities also advanced, as the Russell 3000 gained 0.38%. Growth stocks inched up 0.49%, while value stocks rose 0.29%. Large caps were steady, with the S&P 100 up 0.31%. Mid-caps (S&P 400) added 0.35%, and small caps (S&P 600) moved ahead 0.56%.
International equities strengthened as well. Developed markets (EAFE) gained 0.75%, and emerging markets saw a solid 1.36% increase, continuing their strong year-to-date momentum.
Bonds were mixed. Short-term Treasuries edged up 0.12%, while intermediate-term Treasuries slipped 0.76% and long-term Treasuries fell 1.91%. Investment-grade bonds declined 0.47%, and municipal bonds dipped 0.48%. High-yield bonds were a bright spot, gaining 0.12%. TIPS dropped 0.73%. Emerging-market debt was mixed, with USD-denominated bonds down 0.41% and local-currency bonds up 0.17%.
Commodities posted broad gains. The overall complex rose 1.44%, oil climbed 1.20%, and gold eased slightly, down 0.28%. Corn declined 0.67%. Real estate pulled back 1.60%, while MLPs rose 0.51%. The U.S. dollar weakened by 0.46%. Volatility continued to retreat, with the VIX closing the week at 15.41.
KEY CONSIDERATIONS
Regained Footing – Stocks had another positive week last week. After the slipup in November, it appears the major indices are starting to regain their footing. The market is more or less back to new highs.
This hasn’t gone unnoticed in our models. Our price action indicators, which measure the market’s actual price movements, have improved significantly over the past few weeks. Most of this improvement can be attributed to recovering momentum and participation.
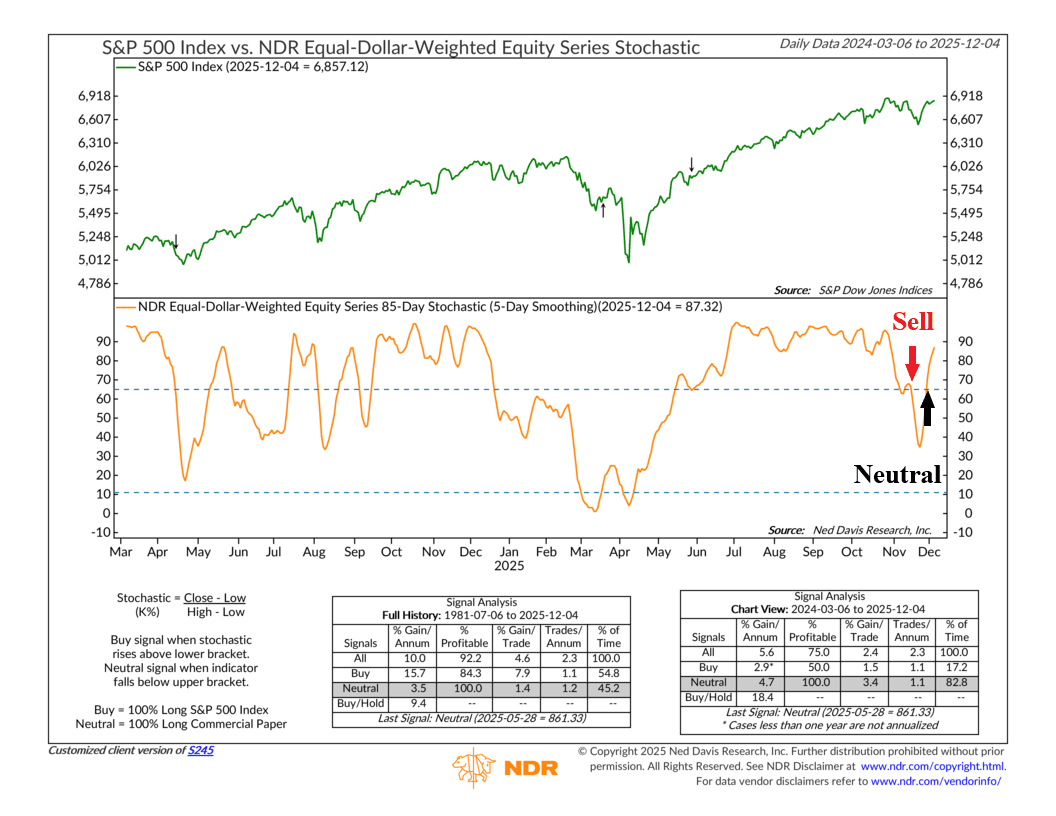
For example, the 85-day stochastic indicator, shown below, triggered a sell signal back near the beginning of November, when the market slipped. But it has since reversed course, recovered, and is now on a neutral signal. That’s good from a momentum standpoint.
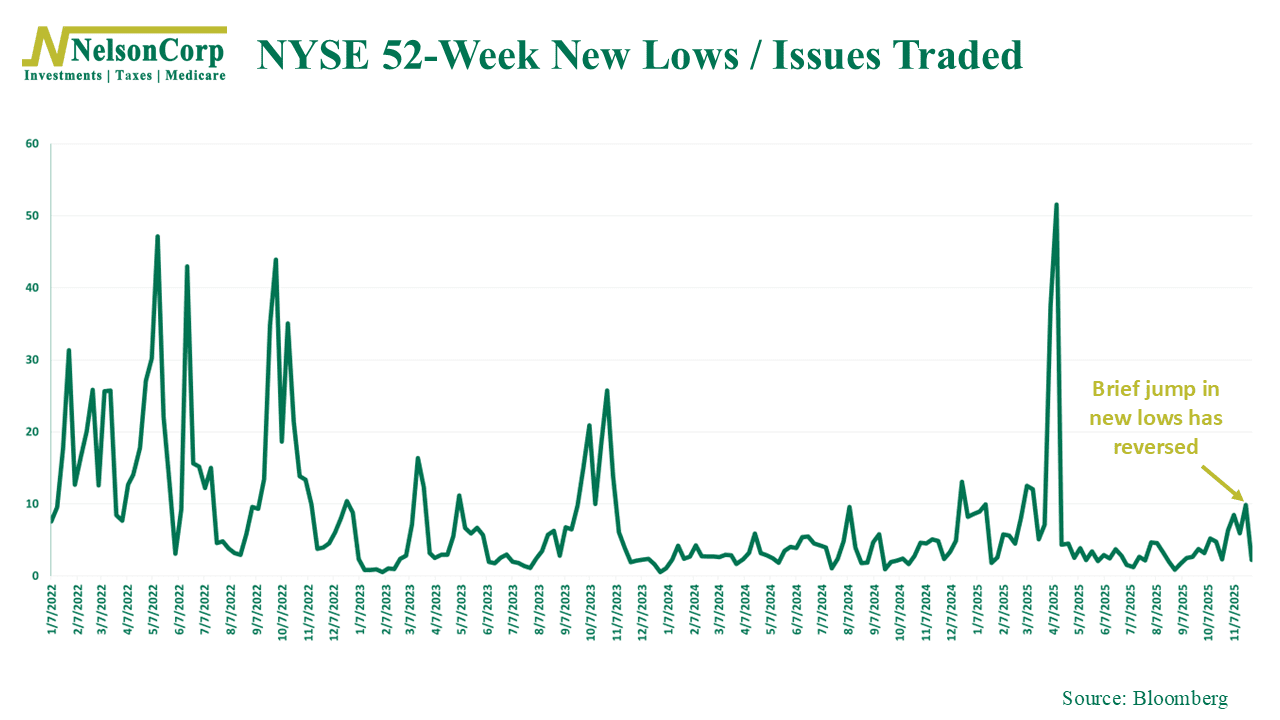
And then there is participation. The following indicator tracks how many stocks on the NYSE are hitting new 52-week (1-year) lows. It also jumped into negative territory back in November but then dropped quickly in recent weeks, a sign that a lot of the selling pressure has subsided.
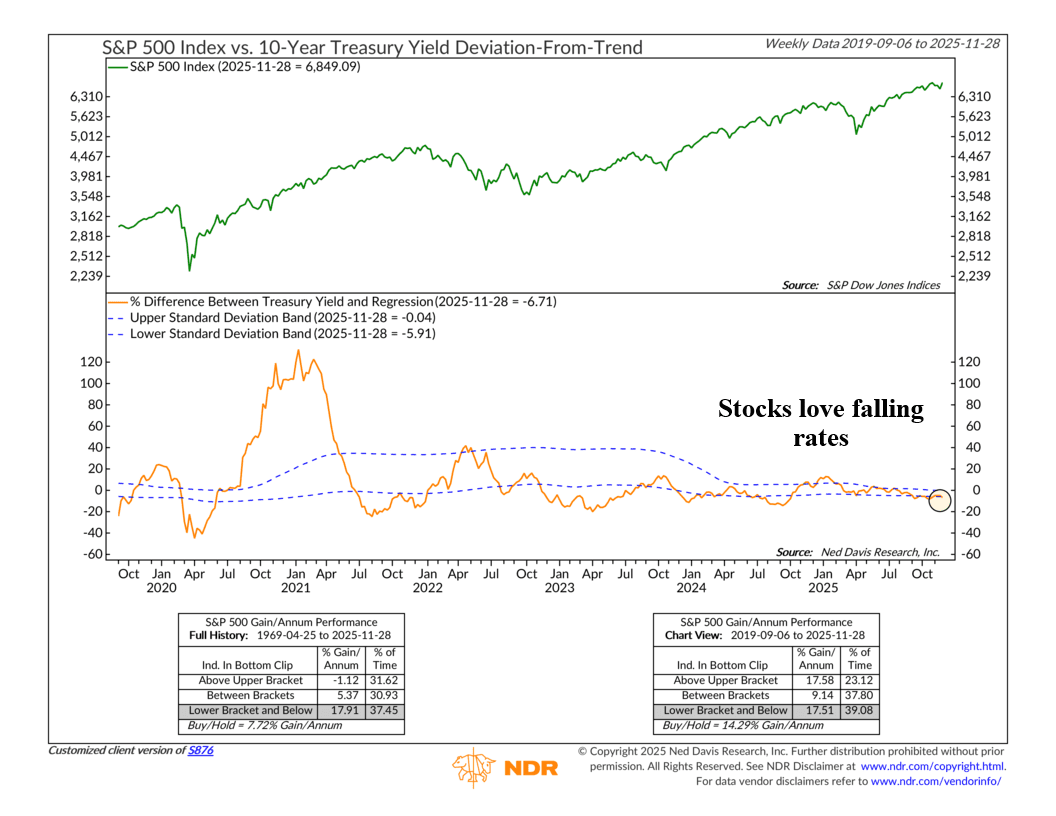
We’ve also seen some slight improvement in the economic arena—interest rates, specifically. The difference between the 10-year Treasury yield and where it should be trading, based on its rolling 70-week linear regression, has fallen into its lowest (bullish) zone. This indicator, shown below, is essentially telling us that interest rates are trending below trend—which reflects an easing in financial pressure—and that has historically been a good thing for equities.
And finally, we’ve also seen some improvement in our investor behavior category of indicators. While this remains the weakest category of indicators, mostly due to stretched stock valuations, it has managed to show some progress in recent weeks.
Specifically, we’ve seen improvements in how investors are positioning themselves. Now remember, many of the indicators in the investor behavior category are contrarian in nature, meaning excessive optimism is bad, and vice versa. So, when we see something like the put/call ratio, shown below, jump into its “extreme pessimism” zone, it tends to be a sign that we’ve reached “peak selling.”
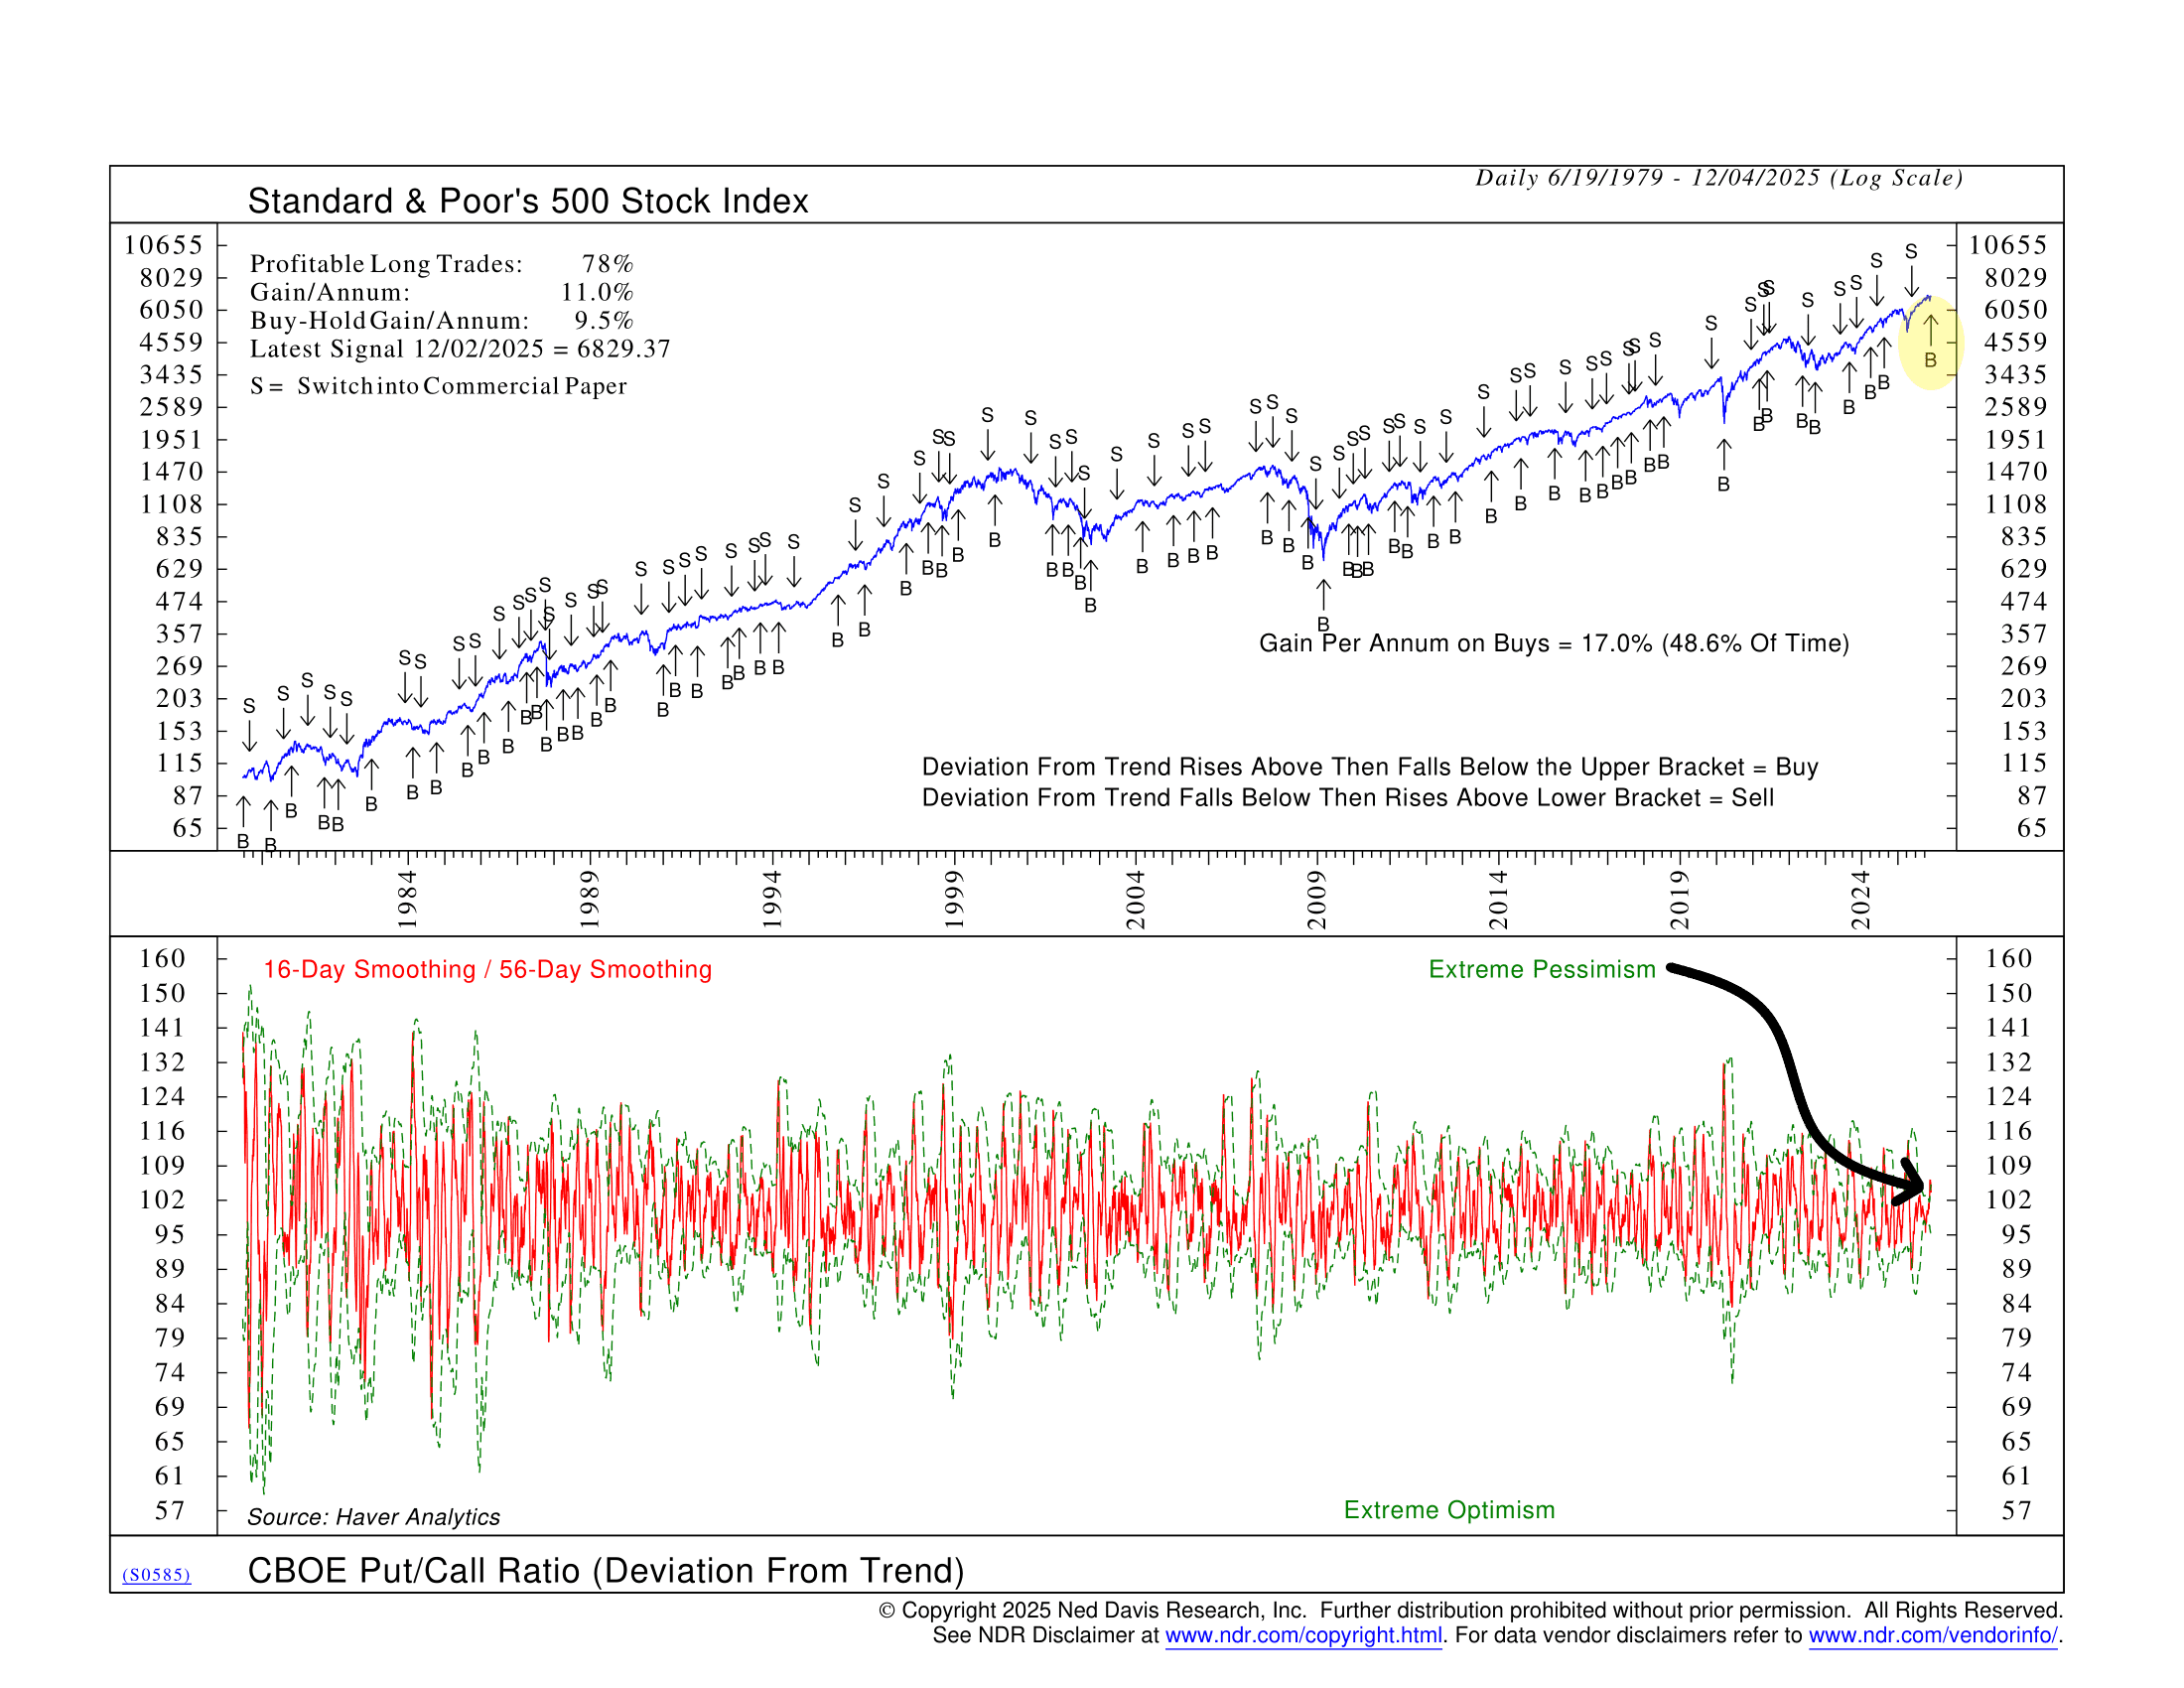
For those unfamiliar, the put-call ratio compares how many put options are being bought versus calls, which makes it a quick way to gauge whether investors are leaning bearish or bullish. When the ratio jumps, it usually means fear is rising because more people are buying downside protection. In contrarian terms, a spike can sometimes signal the market is near a short-term low because sentiment has gotten too pessimistic.
Taken together, these shifts paint a picture of a market that has worked through its recent bout of weakness and is finding steadier ground. Momentum has improved, participation has broadened, interest-rate pressures have eased, and even sentiment has reset in a healthier direction. None of this guarantees what comes next, but it does suggest the market is moving back into a more stable environment—one that’s better supported by price action and less weighed down by fear.
This is intended for informational purposes only and should not be used as the primary basis for an investment decision. Consult an advisor for your personal situation.
Indices mentioned are unmanaged, do not incur fees, and cannot be invested into directly.
Past performance does not guarantee future results.
The S&P 500 Index, or Standard & Poor’s 500 Index, is a market-capitalization-weighted index of 500 leading publicly traded companies in the U.S.
The Dow Jones Industrial Average (DJIA) is a price-weighted index composed of 30 widely traded blue-chip U.S. common stocks. The Nasdaq 100 Index is a basket of the 100 largest, most actively traded U.S. companies listed on the Nasdaq stock exchange. The index includes companies from various industries except for the financial industry, like commercial and investment banks. The Russell 3000 Index is a capitalization-weighted stock market index that seeks to be a benchmark of the entire U.S. stock market. The S&P MidCap 400 is designed to measure the performance of 400 mid-sized companies, reflecting the distinctive risk and return characteristics of this market segment. S&P 600 Index measures the small-cap segment of the U.S. equity market. The index is designed to track companies that meet specific inclusion criteria to ensure that they are liquid and financially viable. The S&P 100 index is a capitalization-weighted index based on 100 highly capitalized stocks for which options are listed on the CBOE (Chicago Board of Exchange). The MSCI EAFE Index is an equity index which captures large and mid cap representation across 21 Developed Markets countries* around the world, excluding the US and Canada.
The Bloomberg U.S. Corporate Bond Index measures the investment grade, fixed-rate, taxable corporate bond market. The Bloomberg U.S. Corporate High Yield Index is comprised of domestic and corporate bonds rated Ba and below with a minimum outstanding amount of $150 million. The Bloomberg U.S. Municipal Index covers the USD-denominated long-term tax exempt bond market. The index has four main sectors: state and local general obligation bonds, revenue bonds, insured bonds and prerefunded bonds.