
OVERVIEW
KEY CONSIDERATIONS
Risk On, Risk Off – In The Karate Kid, Mr. Miyagi makes Daniel wax his cars for multiple days in a row. Wax on, wax off. Daniel thinks it’s pointless. Until he finds out that the whole time, he’s actually been learning how to block a punch.
Wall Street has its own version of that phrase: risk on, risk off. When investors feel good, they reach for the exciting stuff, like technology stocks and junk bonds. That’s risk on. When they get nervous, though, they move to the boring stuff, like the companies that sell toothpaste, prescriptions and electricity. That’s risk off.
So, which one is it right now?
Well, if you only looked at the S&P 500 last week, you’d be somewhat inclined to say risk on. By Thursday, the index had gained about 3% and made back everything it lost the week before. And it did that despite another hot inflation report, a 10-year Treasury yield back above 5%, and the head of the world’s biggest chip company stepping down.
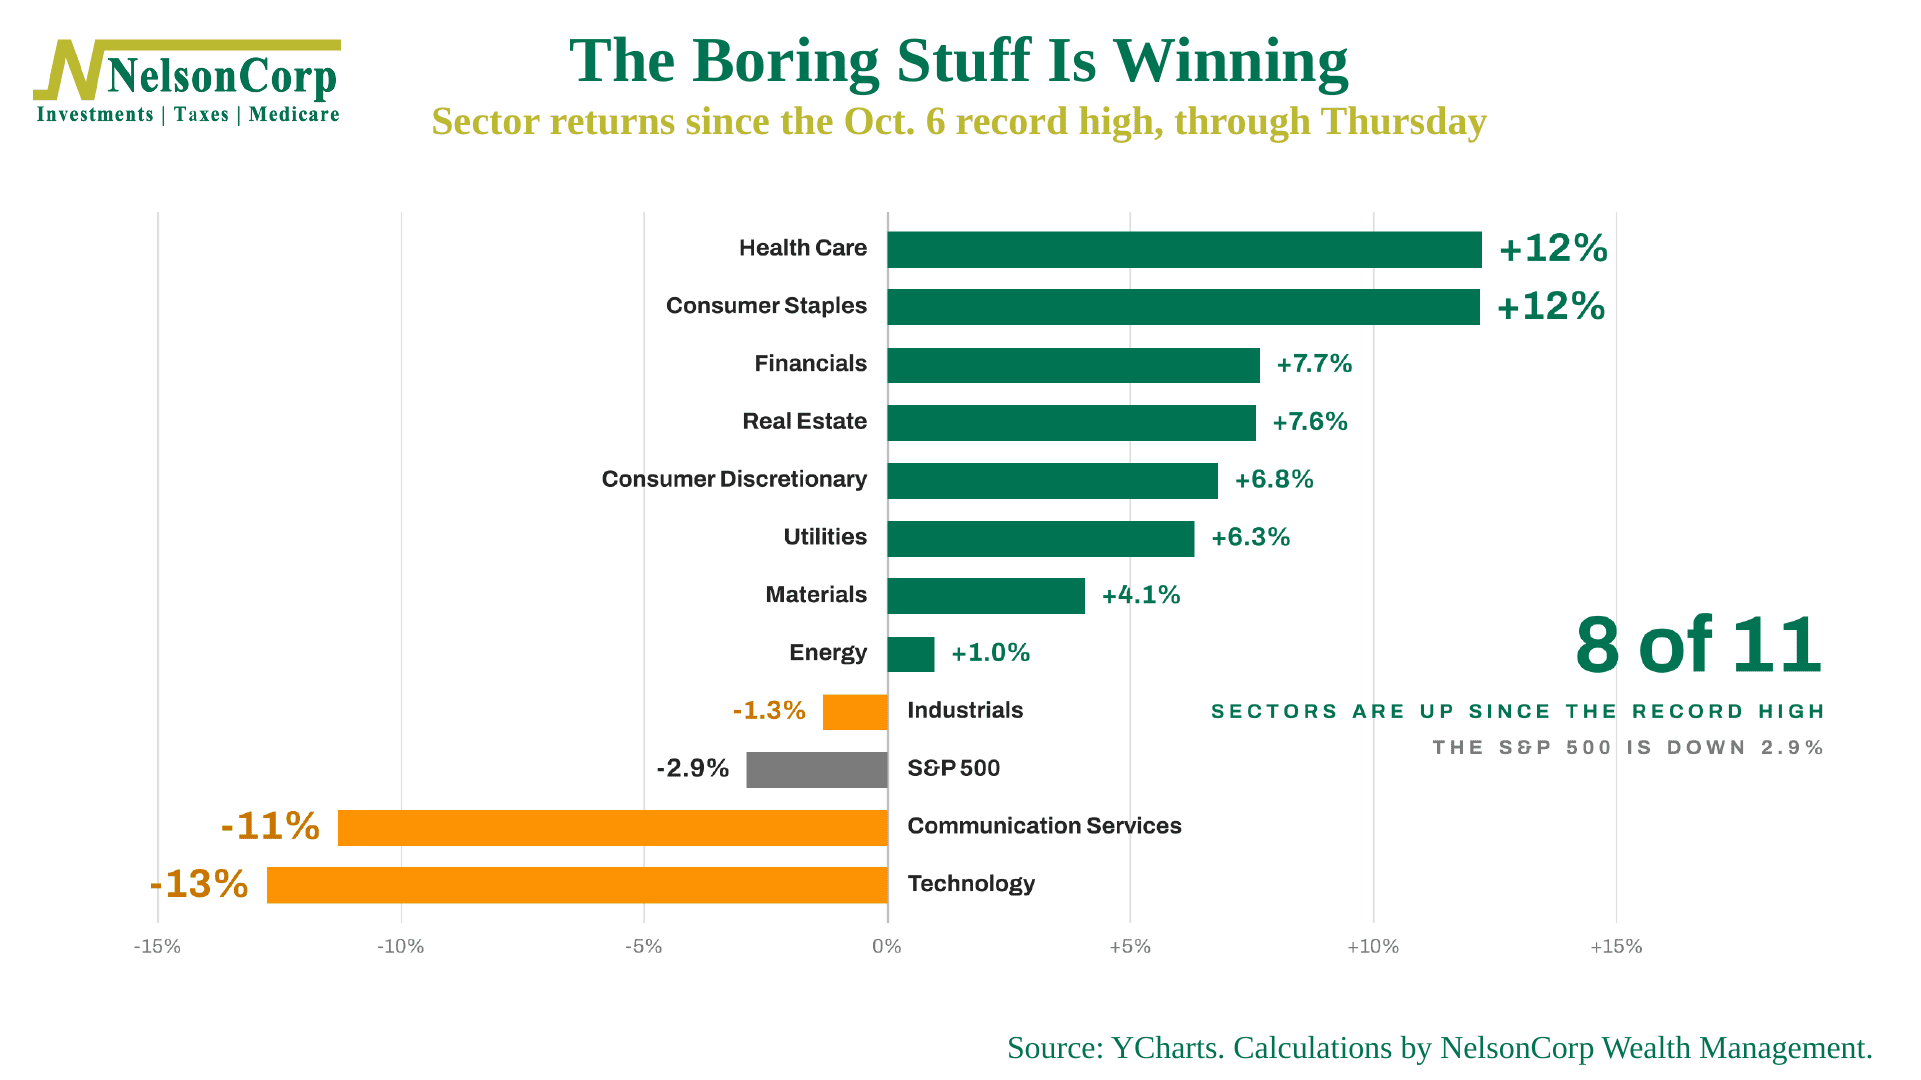
But look underneath, and things look a little different. This first chart shows each sector of the S&P 500 since the index hit its record high on October 6. The index is down about 3%, but eight of its 11 sectors are up. Health care and consumer staples lead the way, both up 12%. Technology and communication services are each down more than 11%. In other words, the boring stuff is winning.
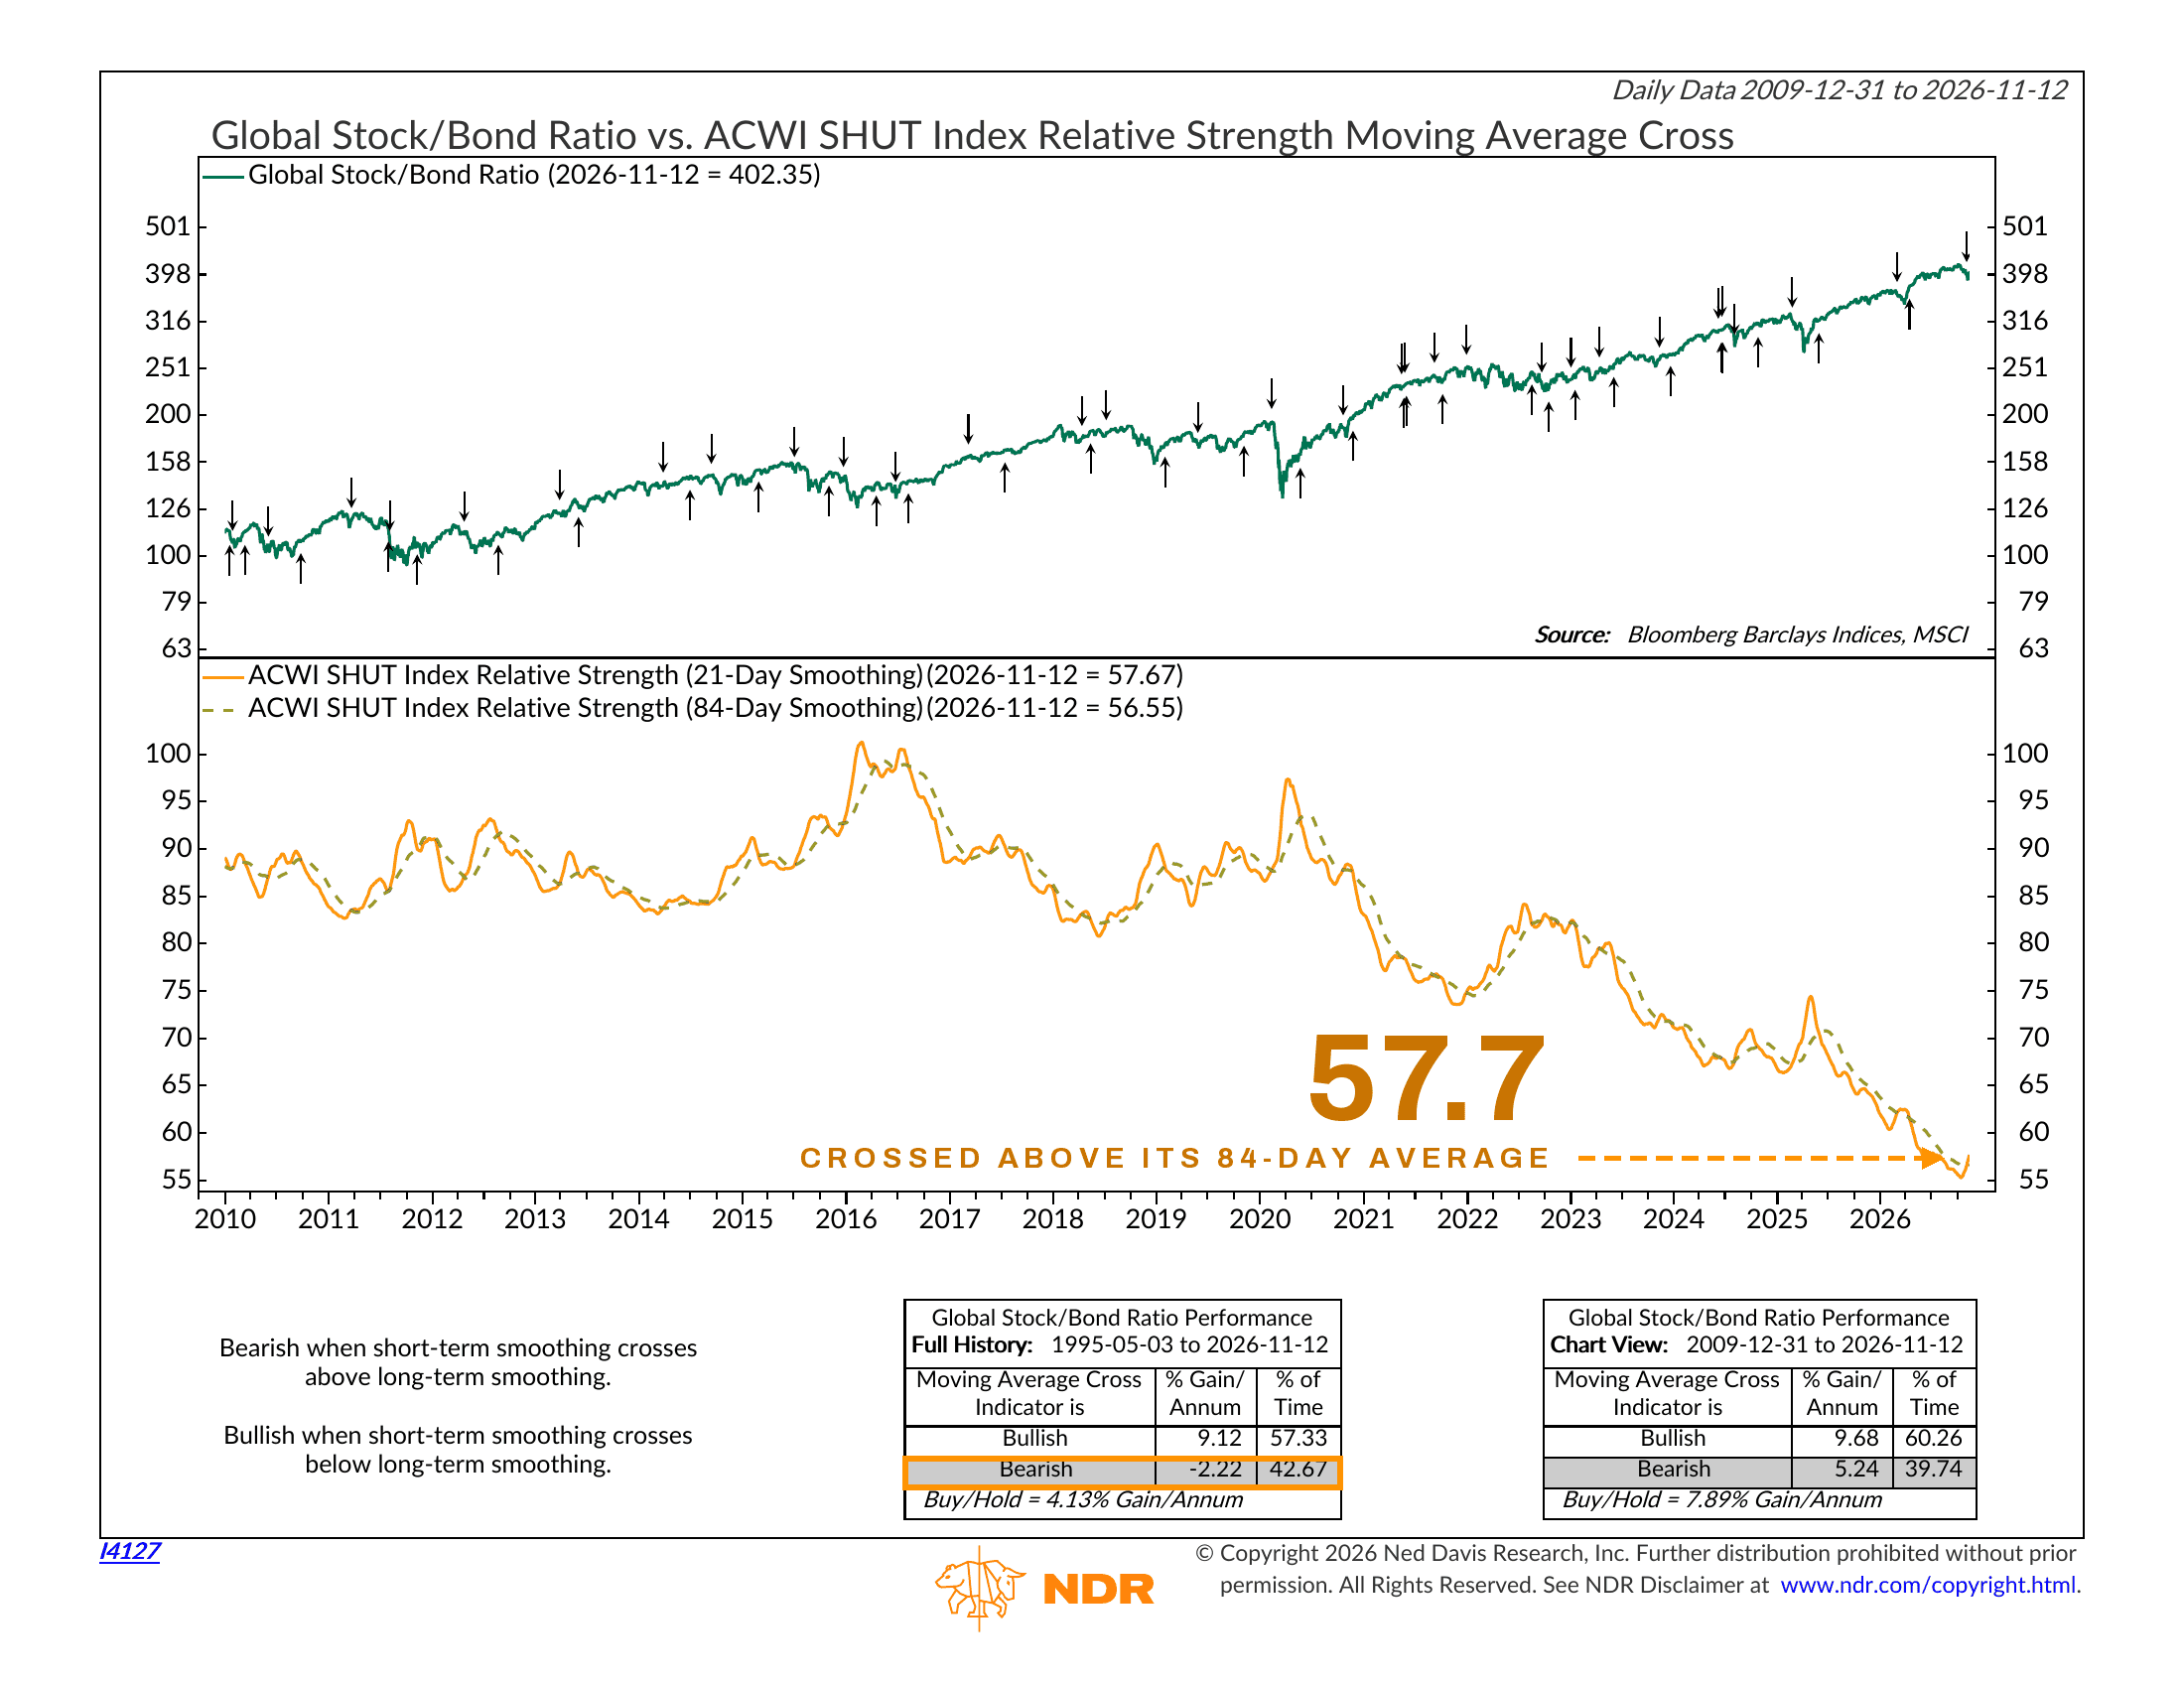
And it isn’t just happening here. The orange line on this next chart tracks defensive stocks around the world (staples, health care, utilities and telecom) against the world market as a whole. After falling for most of the past four years, it turned up earlier this month and crossed above its longer-term average. Since 1995, when that has been the case, global stocks have lost about 2% a year to bonds (the top panel). Otherwise, they’ve beaten bonds by about 9% a year.
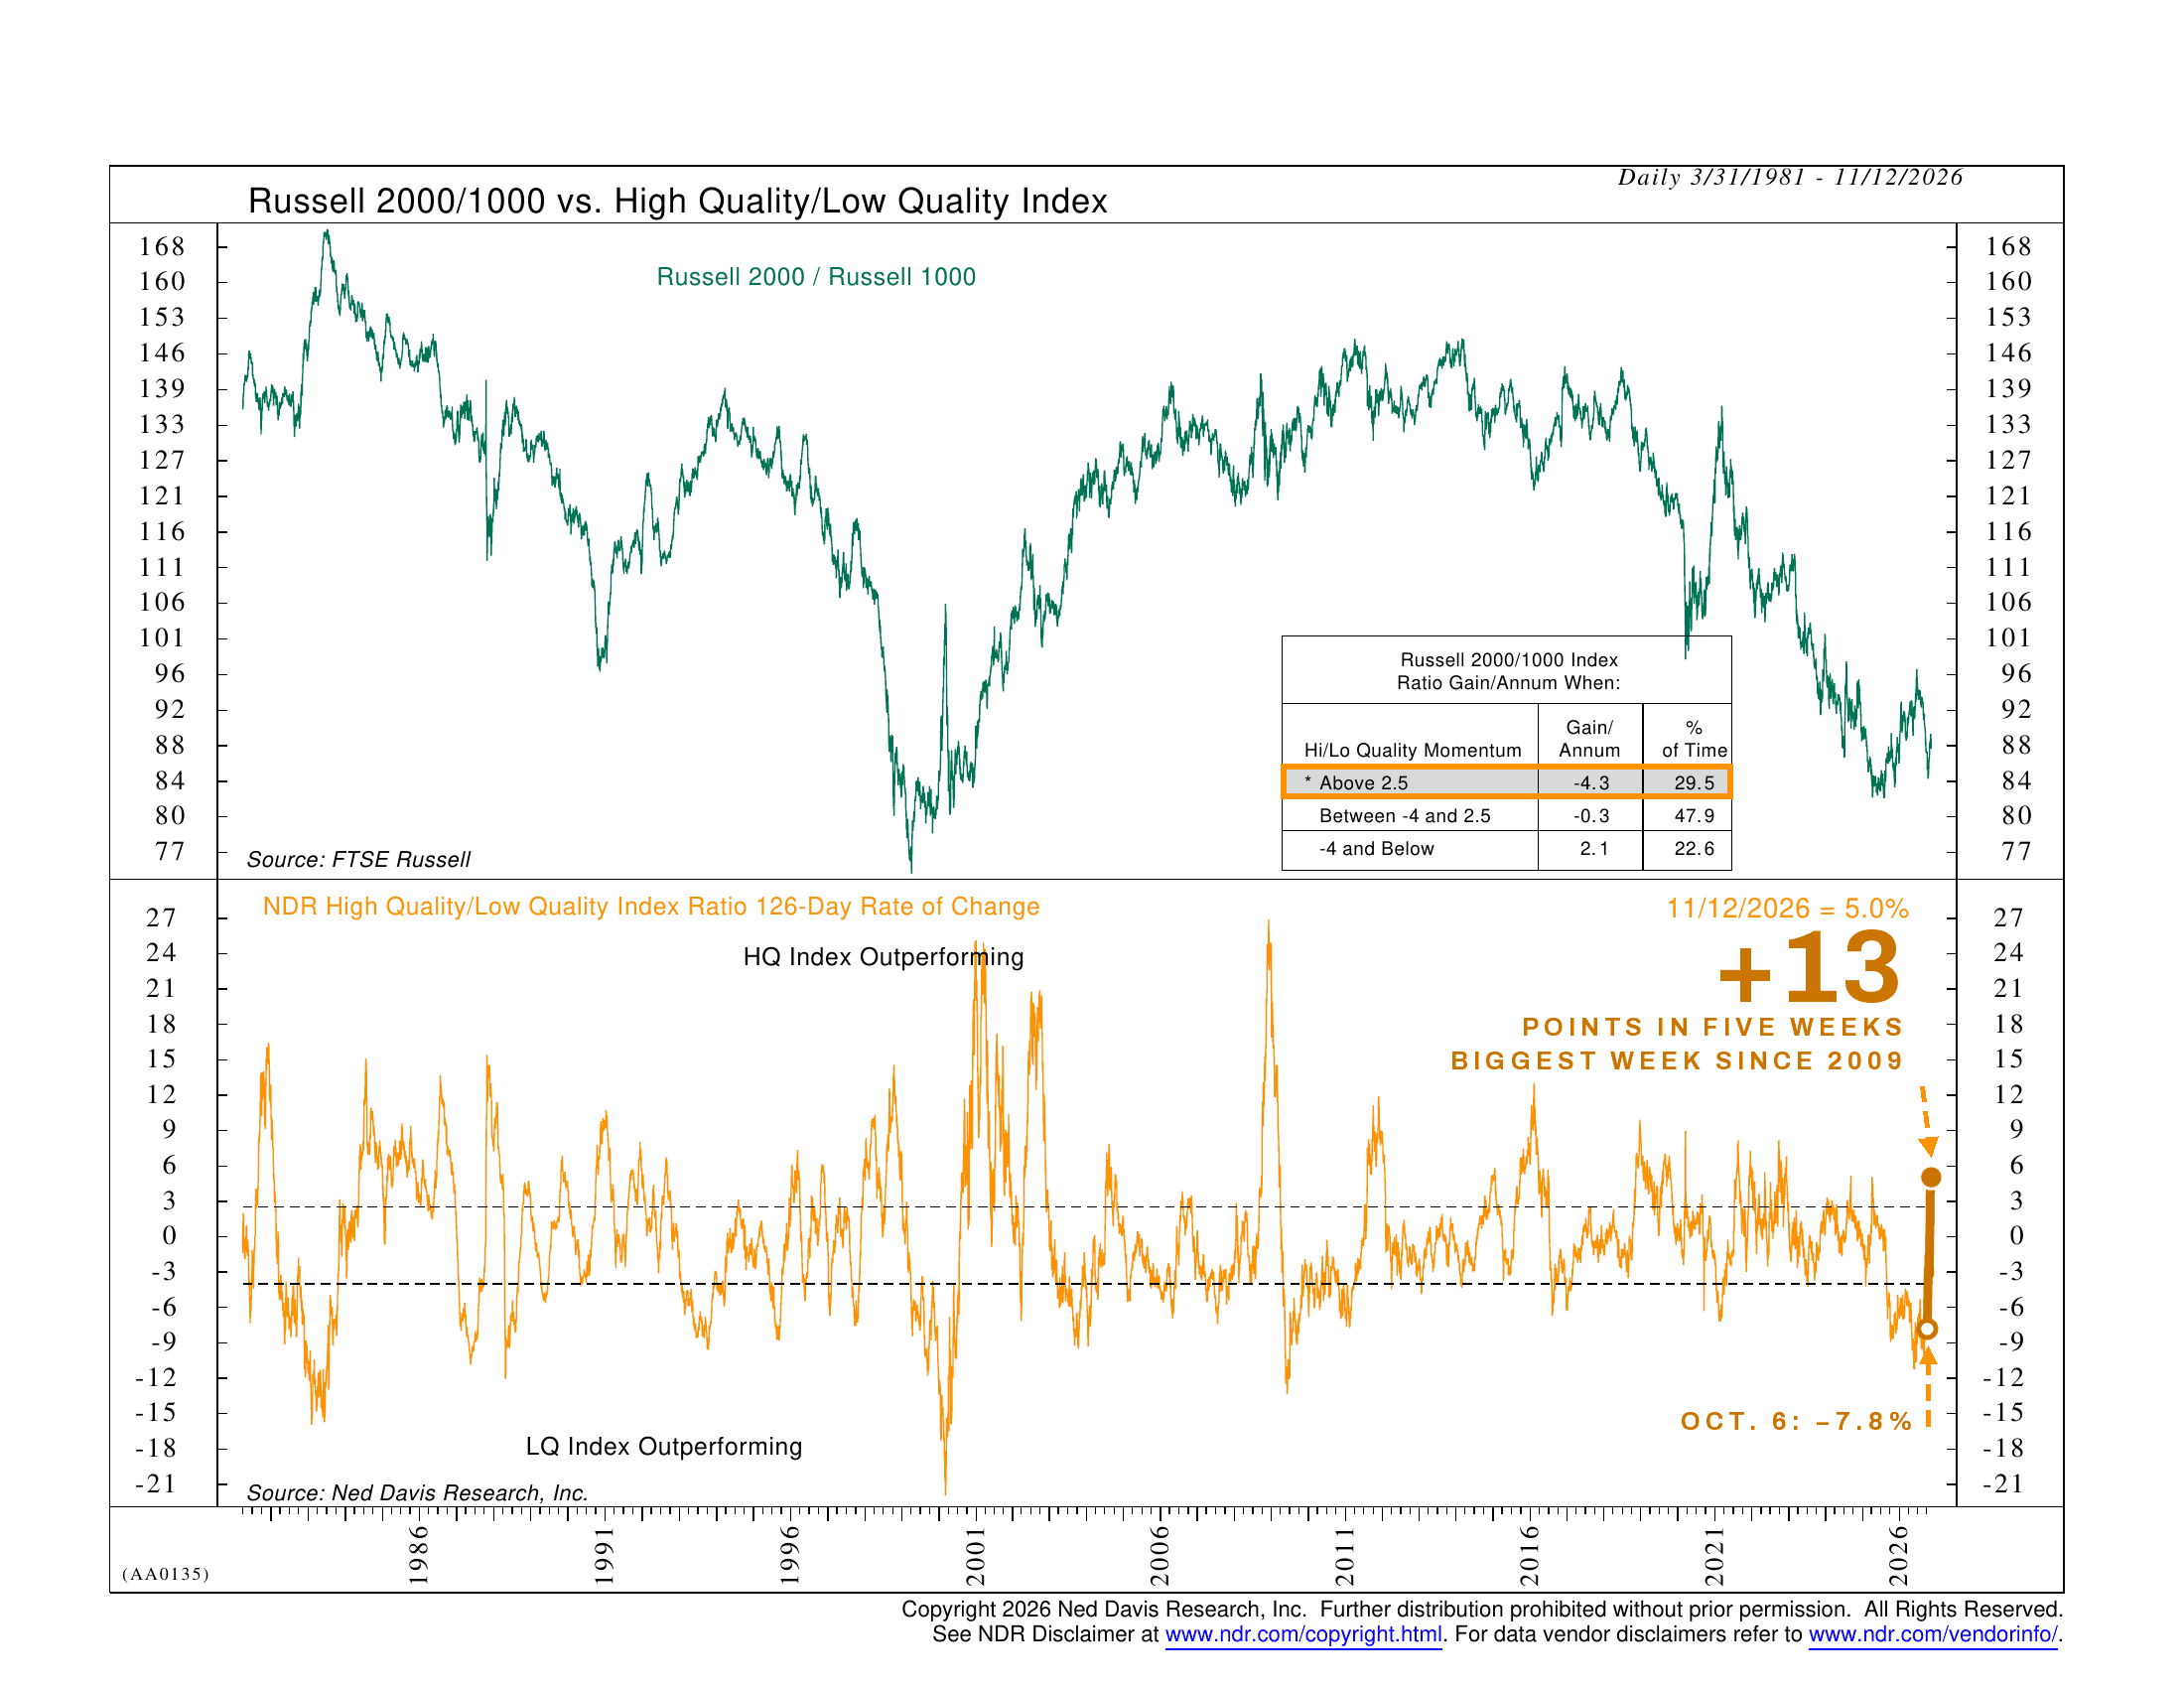
We also saw a pretty big move in the relative strength of quality stocks last week. A few weeks ago, in our Indicator Insights post, we looked at a metric that compares the stocks of the steadiest companies with those of the shakiest. When the S&P 500 hit its record on October 6, the shaky ones (the low quality) were ahead by about 8 percentage points over the prior six months. But then the gauge went almost straight up. It recently had its biggest one-week jump since 2009. Today, the steady ones (the high quality) lead by 5. That’s a 13-point swing in about five weeks, a sign that the market has gotten much more defensive.
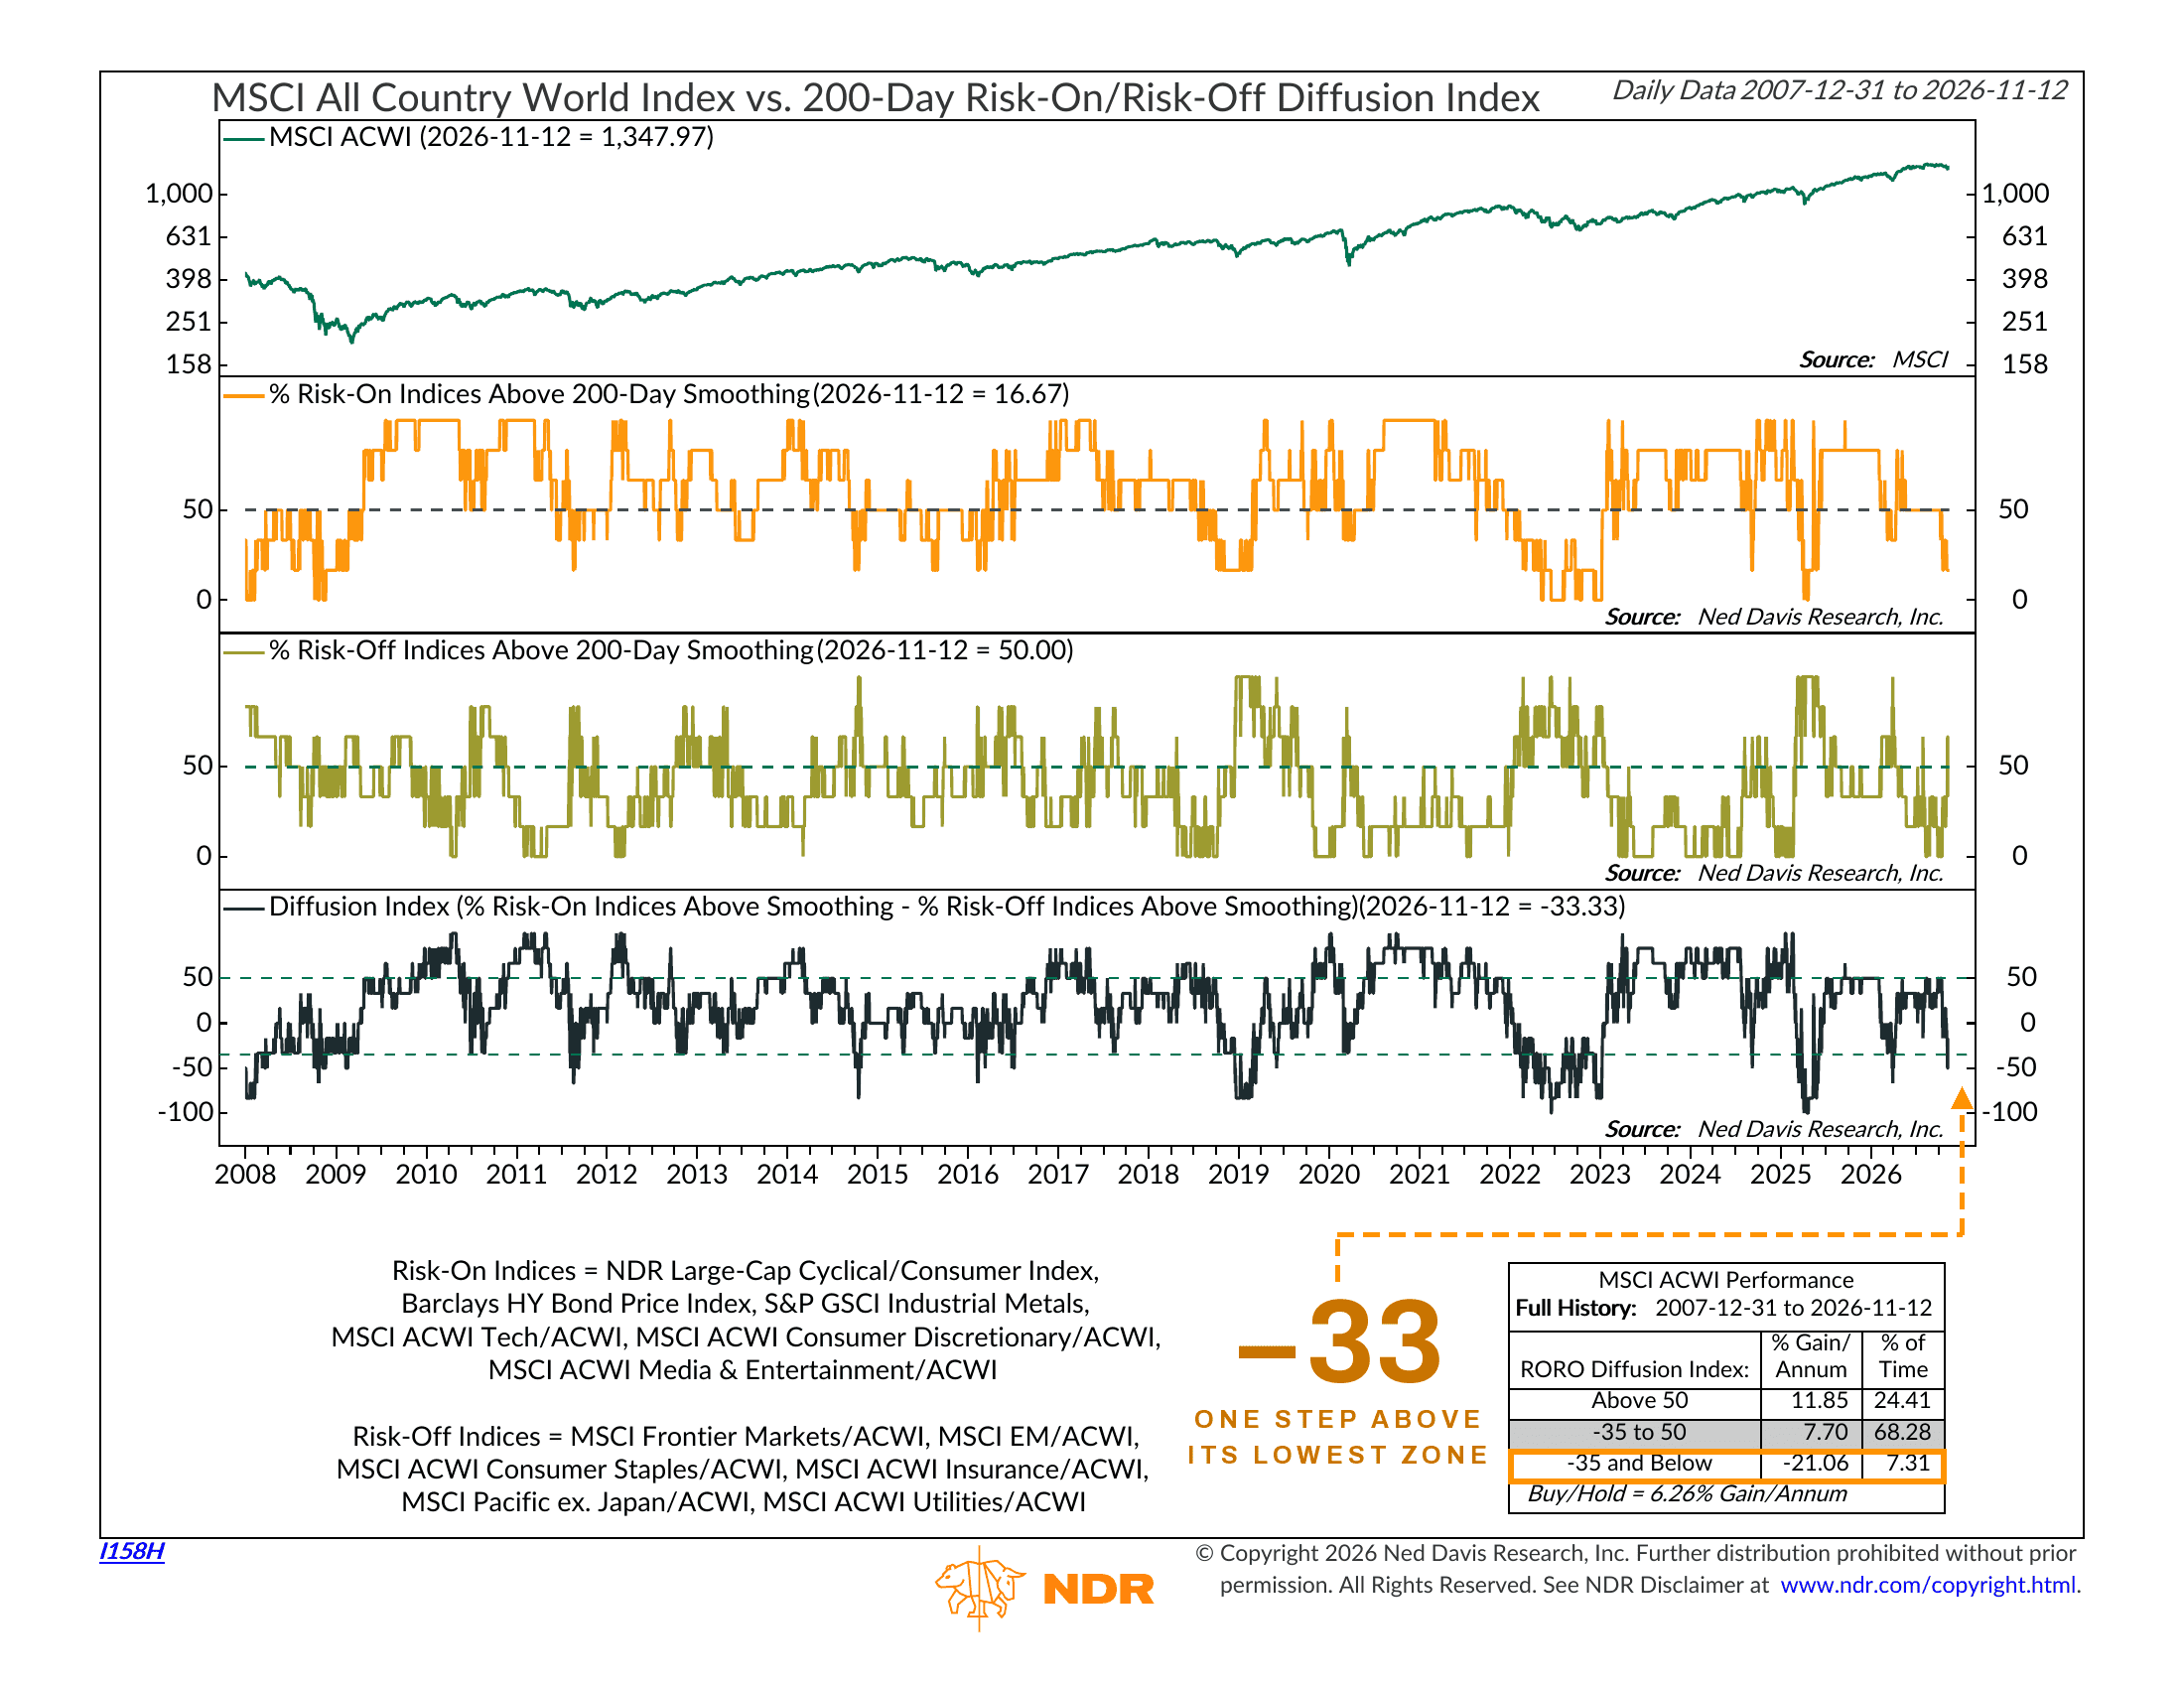
Then there’s the gauge that gives this piece its title. It follows six risk-on investments and six risk-off ones, and counts how many of each are in a long-term uptrend. Right now, it’s one of six for risk-on and three of six for risk-off. During the selloff earlier this month, the gap between the two fell into its lowest zone, where world stocks have lost 21% a year. It has since climbed back out, but only by one step.
Ok, so that’s a lot of defense we’ve been talking about. And deservedly so. But there is a counterpoint to all this negativity that I think is worth pointing out: business is still good. Company profits were up about 31% last quarter. Jobless claims are running at their lowest since 1969, as last week’s Chart of the Week showed. And a monthly survey of Texas factory executives shows their six-month outlook is the best in eight years. That gauge read 0, 16 and 15 when the last three bear markets began. Today it reads 38. Now, it was also high right before the sharp drops of late 2018 and early 2025, so I wouldn’t use it to time anything. But the takeaway is that businesses aren’t really flashing a warning right now.
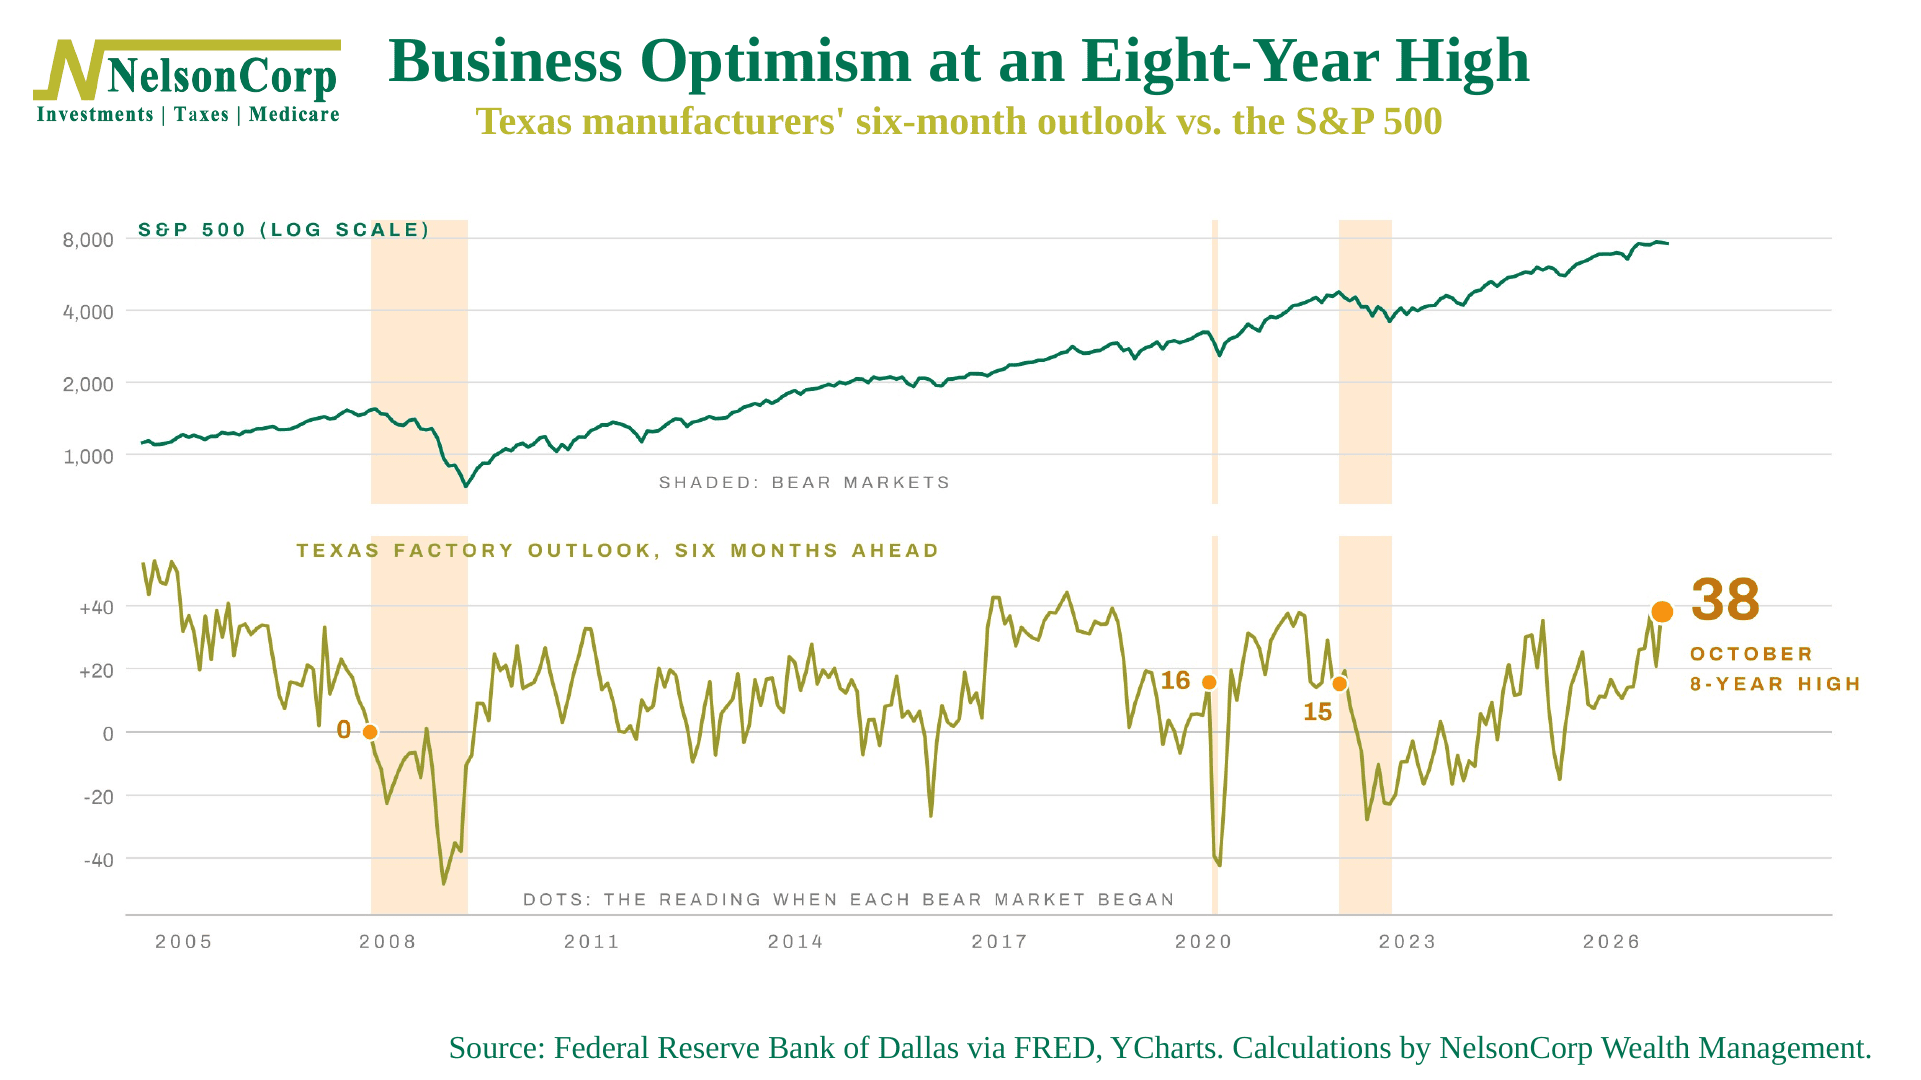
So, the bottom line? Mr. Miyagi never told Daniel when the punch was coming. He taught him to be ready when it did. Business conditions remain healthy, and last week’s rebound was encouraging. But while the major indexes flashed “risk on,” investors beneath the surface continued to signal “risk off.” Until those signals line up, the weight of the evidence suggests keeping your guard up.
This is intended for informational purposes only and should not be used as the primary basis for an investment decision. Consult an advisor for your personal situation.
Indices mentioned are unmanaged, do not incur fees, and cannot be invested into directly.
Past performance does not guarantee future results.
The S&P 500 Index, or Standard & Poor’s 500 Index, is a market-capitalization-weighted index of 500 leading publicly traded companies in the U.S. The S&P 500 Equal Weight Index is a version of the S&P 500 in which each of the 500 companies is given the same weight, so it reflects the performance of the average stock in the index rather than the largest companies.
The Dow Jones Industrial Average (DJIA) is a price-weighted index composed of 30 widely traded blue-chip U.S. common stocks. The Nasdaq 100 Index is a basket of the 100 largest, most actively traded U.S. companies listed on the Nasdaq stock exchange. The index includes companies from various industries except for the financial industry, like commercial and investment banks. The Russell 3000 Index is a capitalization-weighted stock market index that seeks to be a benchmark of the entire U.S. stock market. The S&P MidCap 400 is designed to measure the performance of 400 mid-sized companies, reflecting the distinctive risk and return characteristics of this market segment. S&P 600 Index measures the small-cap segment of the U.S. equity market. The index is designed to track companies that meet specific inclusion criteria to ensure that they are liquid and financially viable. The S&P 100 index is a capitalization-weighted index based on 100 highly capitalized stocks for which options are listed on the CBOE (Chicago Board of Exchange). The MSCI EAFE Index is an equity index which captures large and mid cap representation across 21 Developed Markets countries* around the world, excluding the US and Canada.
The Bloomberg U.S. Corporate Bond Index measures the investment grade, fixed-rate, taxable corporate bond market. The Bloomberg U.S. Corporate High Yield Index is comprised of domestic and corporate bonds rated Ba and below with a minimum outstanding amount of $150 million. The Bloomberg U.S. Municipal Index covers the USD-denominated long-term tax exempt bond market. The index has four main sectors: state and local general obligation bonds, revenue bonds, insured bonds and prerefunded bonds.