OVERVIEW
Markets were mixed but generally quiet last week, with modest gains in several major indexes. Large-cap stocks edged higher, with the S&P 500 up 0.10% and the NASDAQ gaining 0.48%. The S&P 100 also rose 0.17%, suggesting some stabilization in the largest names after recent volatility. The Dow Jones Industrial Average lagged, falling 0.67%, reflecting some weakness in more industrial and value-oriented areas.
Broader market performance was uneven. Small-cap stocks struggled, with the S&P 600 down 0.92%, while mid-caps were essentially flat, as the S&P 400 slipped 0.02%. Within the Russell 3000, growth stocks outperformed value, as Russell 3000 Growth rose 0.50% compared to a 0.43% decline for value.
International markets were mixed as well. Developed international stocks gained 0.19% on the week, while emerging markets declined 1.55%, giving back some ground after a strong year-to-date run. The dispersion highlights that leadership outside the U.S. remains less consistent on a week-to-week basis.
Fixed income was a relative bright spot. Treasury yields moved lower, helping bonds across the curve post gains. Long-term Treasuries led the way, up 0.51%, while intermediate Treasuries rose 0.30% and short-term Treasuries added 0.08%. Investment-grade and high-yield bonds were also higher, and inflation-protected securities were modestly lower. Municipal bonds dipped slightly on the week.
Commodities were mildly negative overall. Broad commodities slipped 0.16%, pressured by a 1.13% decline in oil prices. Gold stood out again, rising 1.36% and continuing its strong performance this year. The U.S. dollar strengthened modestly, up 0.43% on the week.
Volatility continued to ease, with the VIX ending the week at 14.9, a level consistent with relatively calm market conditions.
KEY CONSIDERATIONS
Rooted in Earnings– It’s been a pretty good year for the stock market. Sure, there’s been some volatility, particularly back in the spring, but for the most part, financial markets have performed nicely. In fact, aside from that big drawdown in April, it’s mostly been a “buy the dip” kind of year.
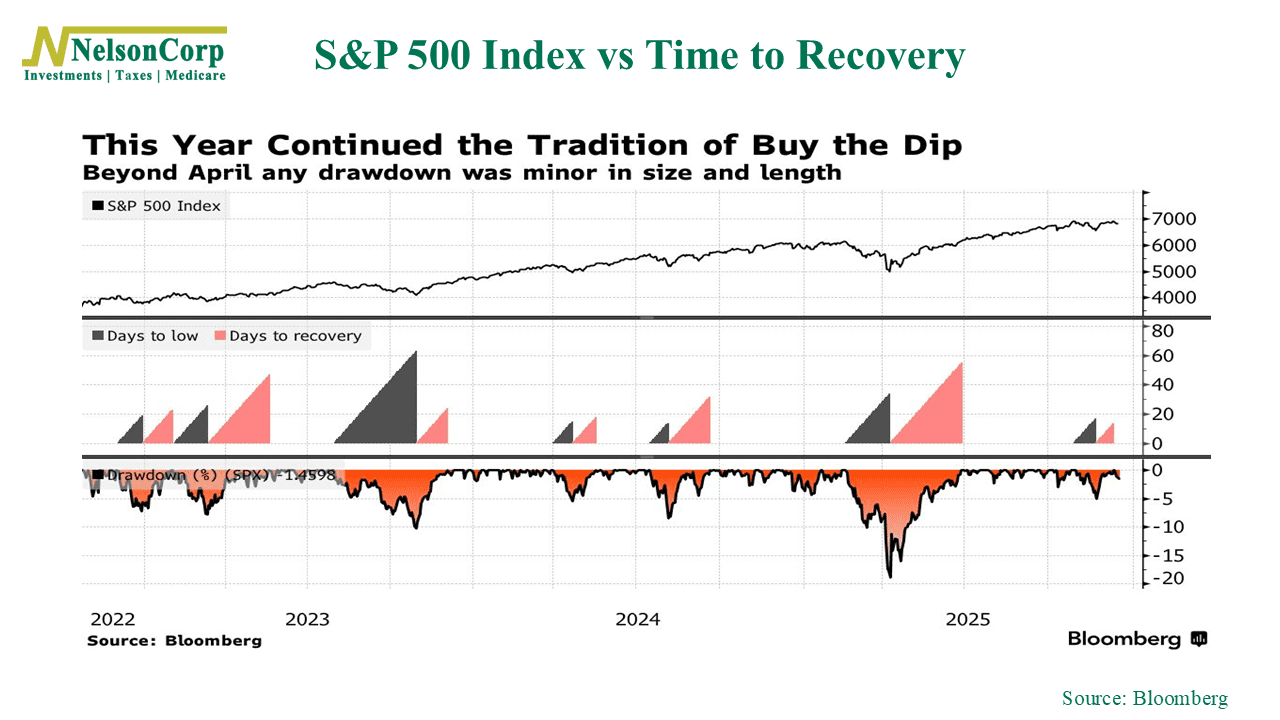
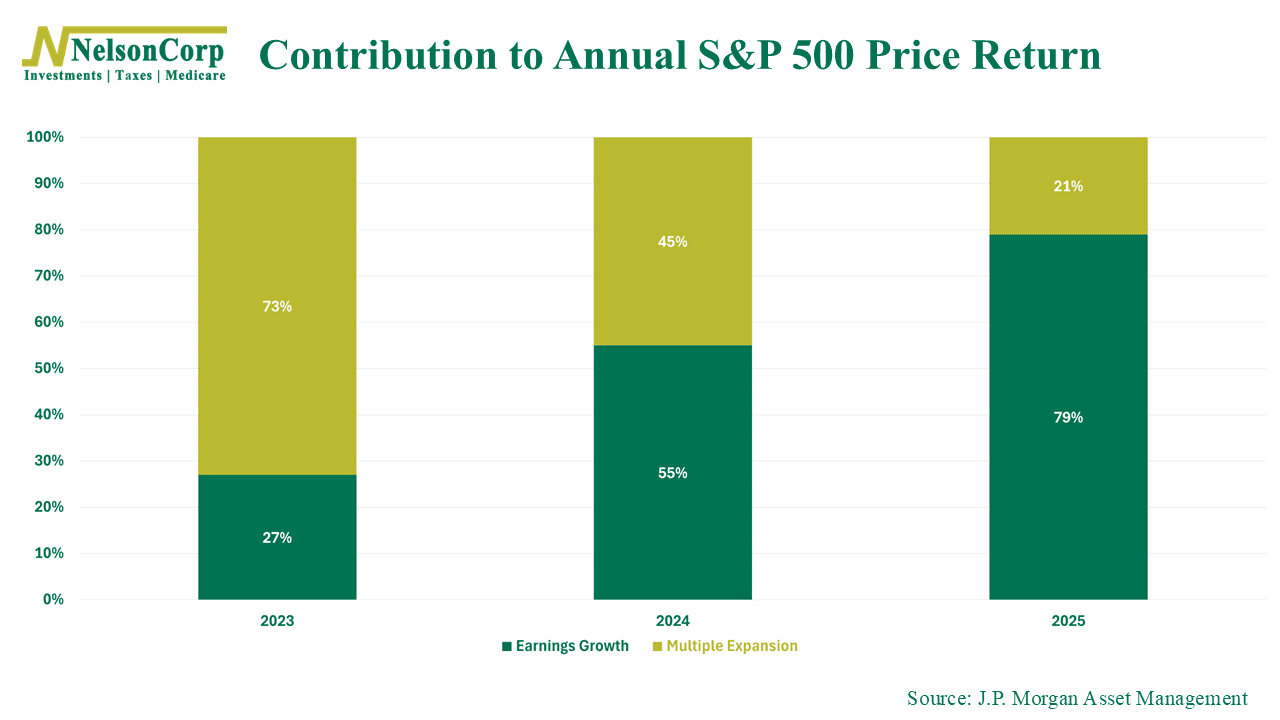
All that dip-buying has the S&P 500 on track to notch its third consecutive double-digit return. What’s interesting about this year, though, is where those gains have come from. The bulk of the market’s advance has been driven by earnings growth, not by investors simply paying higher prices.
As the chart below shows, roughly 79% of the S&P 500’s gain this year has come from earnings growth, or corporate profitability, versus just 21% from multiple expansion, which reflects what investors are willing to pay. Last year, earnings accounted for only about half of the gain, and the year before that, just 27%.
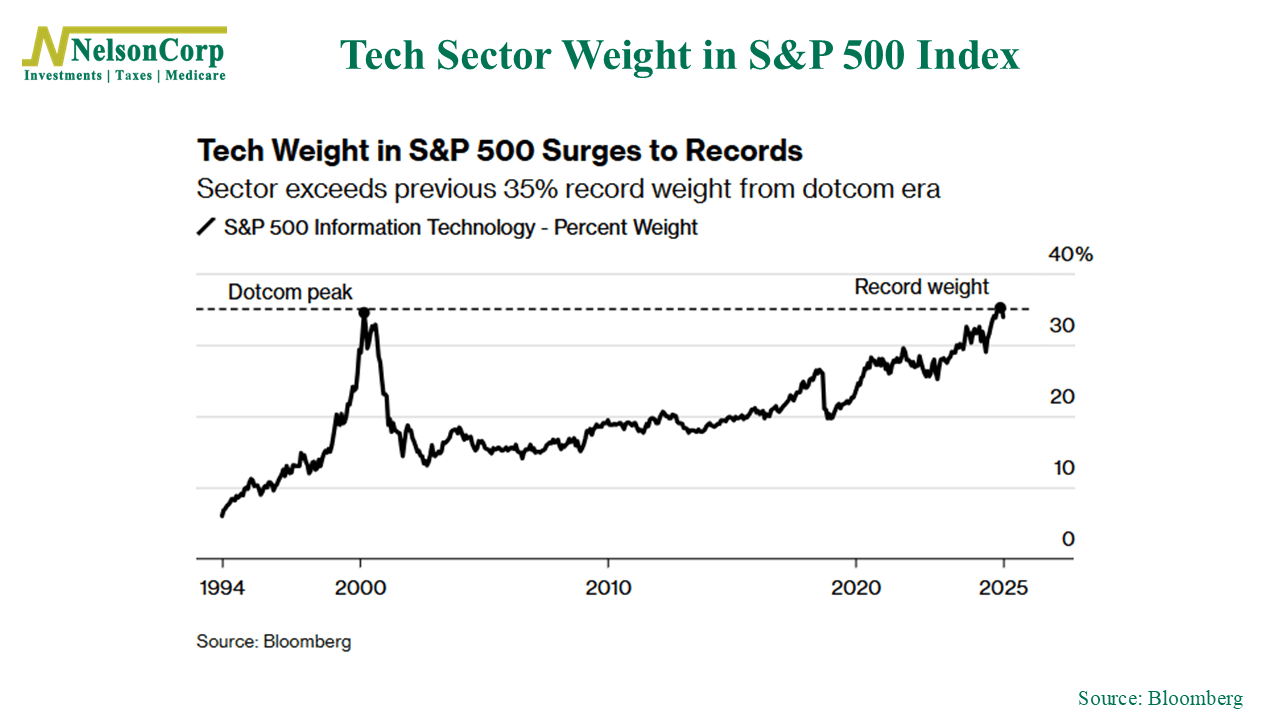
That’s good news. It means companies are doing what they’re supposed to do, earning profits. Of course, a large share of those profits has come from a relatively small group of mega-cap stocks. As the next chart shows, the tech sector’s weight in the S&P 500 has climbed to a record above 35% this year, surpassing even the dot-com era.
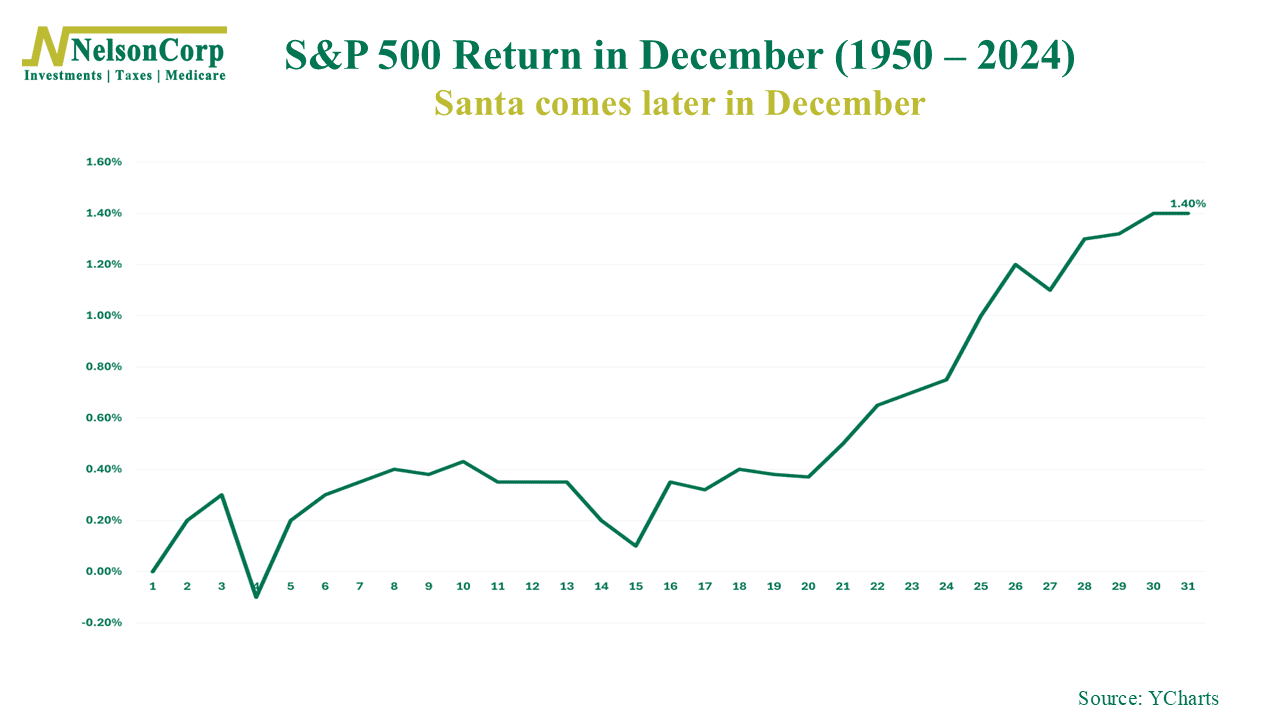
Lately, though, the market has been treading water. The S&P 500 hasn’t made much progress since early October, spending the past several weeks moving sideways. That naturally raises the question of whether we’ll see a year-end rally.
From a seasonal standpoint, the odds are supportive. Historically, the second half of December has tended to be a strong period for stocks, often referred to as the Santa Claus rally.
Whether that pattern repeats or not, the bigger takeaway is that this year’s gains have been built on a firmer foundation, one rooted in earnings rather than enthusiasm alone.
This is intended for informational purposes only and should not be used as the primary basis for an investment decision. Consult an advisor for your personal situation.
Indices mentioned are unmanaged, do not incur fees, and cannot be invested into directly.
Past performance does not guarantee future results.
The S&P 500 Index, or Standard & Poor’s 500 Index, is a market-capitalization-weighted index of 500 leading publicly traded companies in the U.S.
The Dow Jones Industrial Average (DJIA) is a price-weighted index composed of 30 widely traded blue-chip U.S. common stocks. The Nasdaq 100 Index is a basket of the 100 largest, most actively traded U.S. companies listed on the Nasdaq stock exchange. The index includes companies from various industries except for the financial industry, like commercial and investment banks. The Russell 3000 Index is a capitalization-weighted stock market index that seeks to be a benchmark of the entire U.S. stock market. The S&P MidCap 400 is designed to measure the performance of 400 mid-sized companies, reflecting the distinctive risk and return characteristics of this market segment. S&P 600 Index measures the small-cap segment of the U.S. equity market. The index is designed to track companies that meet specific inclusion criteria to ensure that they are liquid and financially viable. The S&P 100 index is a capitalization-weighted index based on 100 highly capitalized stocks for which options are listed on the CBOE (Chicago Board of Exchange). The MSCI EAFE Index is an equity index which captures large and mid cap representation across 21 Developed Markets countries* around the world, excluding the US and Canada.
The Bloomberg U.S. Corporate Bond Index measures the investment grade, fixed-rate, taxable corporate bond market. The Bloomberg U.S. Corporate High Yield Index is comprised of domestic and corporate bonds rated Ba and below with a minimum outstanding amount of $150 million. The Bloomberg U.S. Municipal Index covers the USD-denominated long-term tax exempt bond market. The index has four main sectors: state and local general obligation bonds, revenue bonds, insured bonds and prerefunded bonds.