OVERVIEW
Markets stumbled last week, as selling pressure hit nearly every corner of the equity landscape. The S&P 500 dropped 2.43%, while the Dow Jones Industrial Average fell 2.73%. The NASDAQ slid 2.53%, extending a broad pullback that also saw the Russell 3000 down 2.49%. Growth stocks (-2.21%) modestly outperformed value (-2.76%), though both ended the week in the red.
By size, smaller companies fared the worst. The S&P 600 (small cap) tumbled 4.94%, while mid-caps (S&P 400) sank 3.86% and large-caps (S&P 100) declined 2.18%. Overseas markets offered little relief, with developed international equities (EAFE) down 1.87% and emerging markets off 0.60%.
Bond markets provided a bright spot. Long-term Treasuries rallied 1.42%, while intermediate-term issues gained 0.50% and short-term Treasuries edged up 0.09%. Investment-grade corporates rose 0.11%, municipals added 0.44%, and TIPS gained 0.41%. High-yield bonds were the exception, slipping 0.73%.
Commodities were mixed. Gold jumped 2.34%, extending its remarkable 51% year-to-date climb. Oil sank 3.24%, while broad commodities fell 1.20% and corn declined 1.43%. Real estate and MLPs were among the weakest areas, down 3.60% and 4.09%, respectively.
The U.S. dollar strengthened 1.46%, while volatility surged, with the VIX soaring 30.09%, marking one of its sharpest weekly spikes of the year.
KEY CONSIDERATIONS
Running Hot – The stock market had a bumpy week last week. But no matter—the S&P 500 just pulled off something you don’t see very often. Over the past six months, the index has surged more than 35% from its April lows—a move so strong it’s only happened five other times since 1950.

Big rebounds like that usually come after deep declines. This one is no exception. But what exactly is behind the rally?
Well, technology of course! But even though this naturally leads many to fear that we might be in another “tech bubble,” the data show that the current rally looks a lot more like the 2016-2020 tech-driven rally than the late-‘90s dot-com boom.

Back then, valuations ran wild while profits lagged behind. This time, companies are actually making money. Whew! This should give investors at least some confidence that things aren’t quite as unhinged this go around.
Or maybe they are? This next chart shows that earnings multiples (the price investors are paying for every dollar of earnings) is roughly back to where they were in 2000.
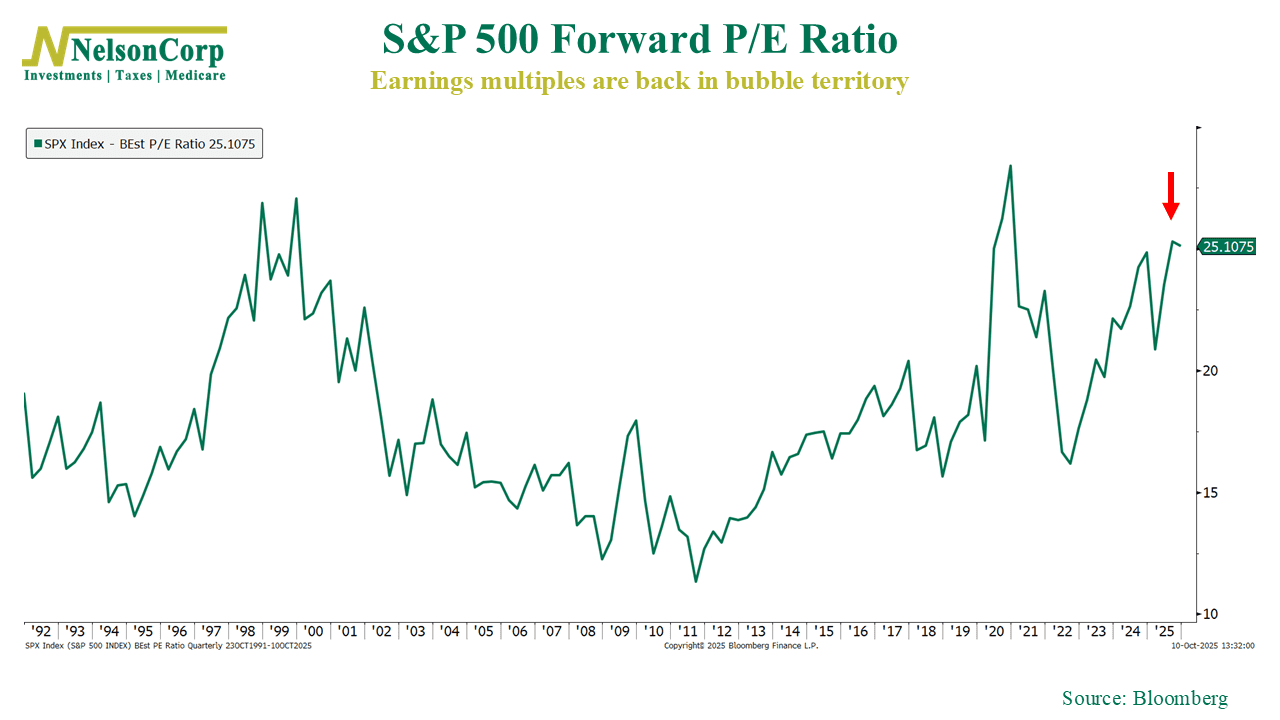
But here’s the kicker. Profits margins (shown below) are much higher than they were back then. That matters—a lot. If margins stay strong, investors can justify paying a higher multiple for the same dollar of earnings. In other words, it may feel expensive, but the fundamentals offer more support than they did a generation ago.
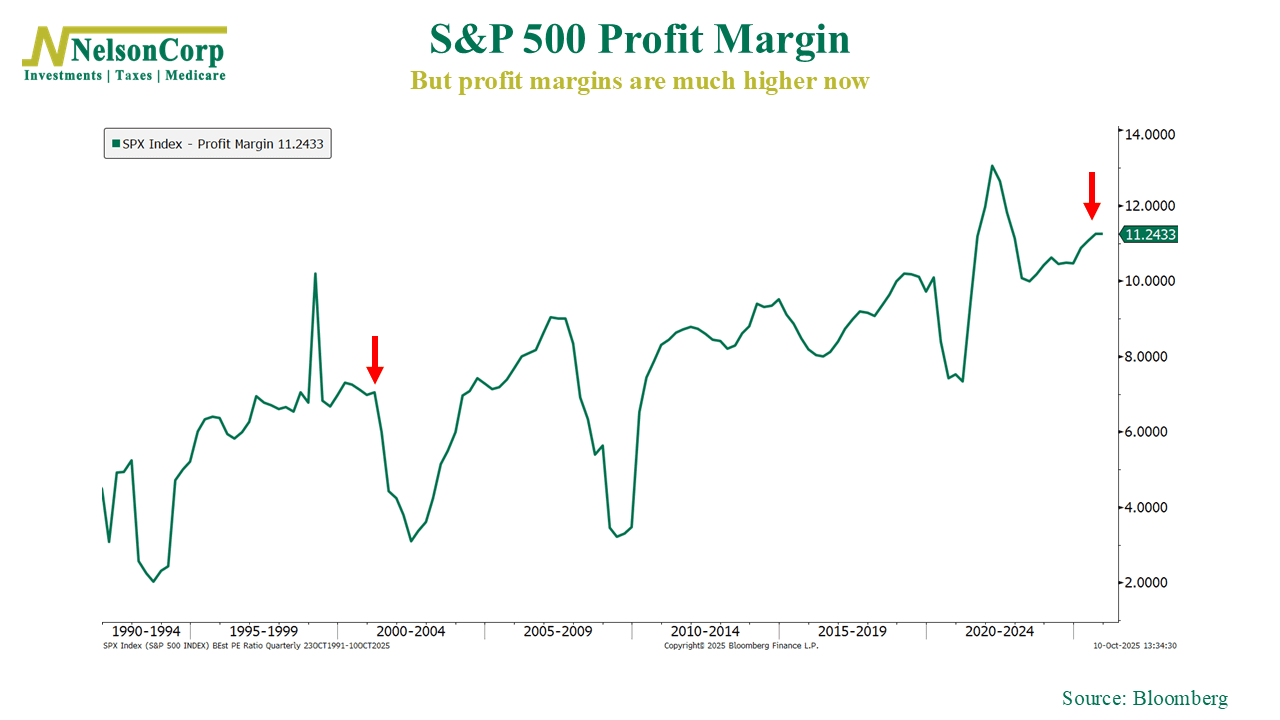
Put it all together and I’d have to say that, sure, the market looks hot—but not unhinged. The rally’s been fast, the optimism is thick, and it wouldn’t take much to cool things down, but the data doesn’t suggest this is 1999.
Still, though, rallies of this size tend to catch their breath eventually. Momentum’s great until it isn’t. For now, the trend’s your friend, but it’s a good to always stay balanced and let the process run its course.
This is intended for informational purposes only and should not be used as the primary basis for an investment decision. Consult an advisor for your personal situation.
Indices mentioned are unmanaged, do not incur fees, and cannot be invested into directly.
Past performance does not guarantee future results.
The S&P 500 Index, or Standard & Poor’s 500 Index, is a market-capitalization-weighted index of 500 leading publicly traded companies in the U.S.
The Dow Jones Industrial Average (DJIA) is a price-weighted index composed of 30 widely traded blue-chip U.S. common stocks. The Nasdaq 100 Index is a basket of the 100 largest, most actively traded U.S. companies listed on the Nasdaq stock exchange. The index includes companies from various industries except for the financial industry, like commercial and investment banks. The Russell 3000 Index is a capitalization-weighted stock market index that seeks to be a benchmark of the entire U.S. stock market. The S&P MidCap 400 is designed to measure the performance of 400 mid-sized companies, reflecting the distinctive risk and return characteristics of this market segment. S&P 600 Index measures the small-cap segment of the U.S. equity market. The index is designed to track companies that meet specific inclusion criteria to ensure that they are liquid and financially viable. The S&P 100 index is a capitalization-weighted index based on 100 highly capitalized stocks for which options are listed on the CBOE (Chicago Board of Exchange). The MSCI EAFE Index is an equity index which captures large and mid cap representation across 21 Developed Markets countries* around the world, excluding the US and Canada.
The Bloomberg U.S. Corporate Bond Index measures the investment grade, fixed-rate, taxable corporate bond market. The Bloomberg U.S. Corporate High Yield Index is comprised of domestic and corporate bonds rated Ba and below with a minimum outstanding amount of $150 million. The Bloomberg U.S. Municipal Index covers the USD-denominated long-term tax exempt bond market. The index has four main sectors: state and local general obligation bonds, revenue bonds, insured bonds and prerefunded bonds.