
OVERVIEW
KEY CONSIDERATIONS
Show Me the Earnings – The market has taken a bit of a breather lately. Since reaching new highs earlier this summer, the S&P 500 has mostly traded sideways as investors wait for the next catalyst. That catalyst may arrive next week as second-quarter earnings season officially gets underway.
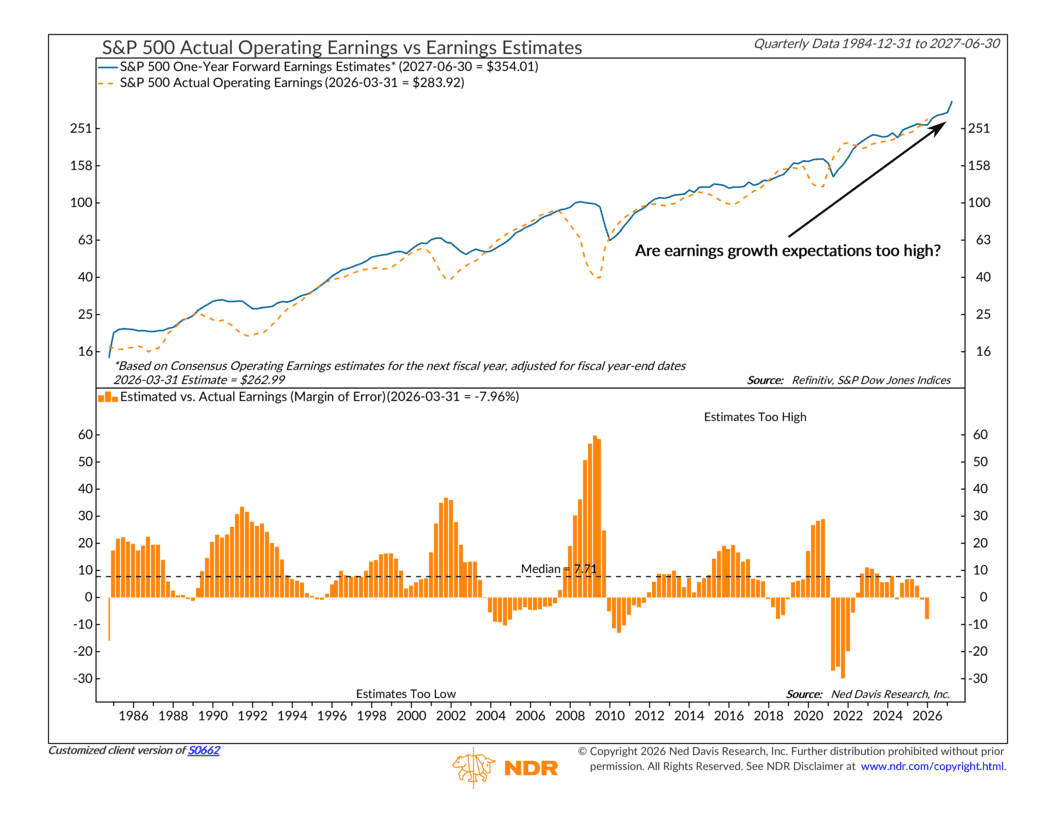
The chart above compares what Wall Street expected companies to earn over the next year with what they actually ended up earning. The bottom panel shows the difference between those expectations and reality. When the bars are above zero, analysts were too optimistic. When they’re below zero, companies ultimately earned more than expected.
Right now, expectations are fairly lofty. Wall Street is looking for more than 20% earnings growth this quarter, and what’s especially interesting is that those estimates have actually moved higher over the past few months. That’s a bit unusual, as analysts typically trim forecasts as earnings season approaches rather than raise them.
Of course, high expectations don’t automatically mean companies will disappoint. Corporate earnings have been remarkably resilient over the past two years, and many businesses continue to benefit from strong demand and productivity gains, particularly those tied to artificial intelligence. But when expectations are elevated, the bar for success becomes much higher. Sometimes a company can report strong earnings and still see its stock fall simply because investors were expecting even more.
The good news is that today’s valuations aren’t being driven solely by higher stock prices. The S&P 500 currently trades at roughly 20 times forward earnings, which is certainly above its long-term average, but that’s actually a bit lower than where it began the year.
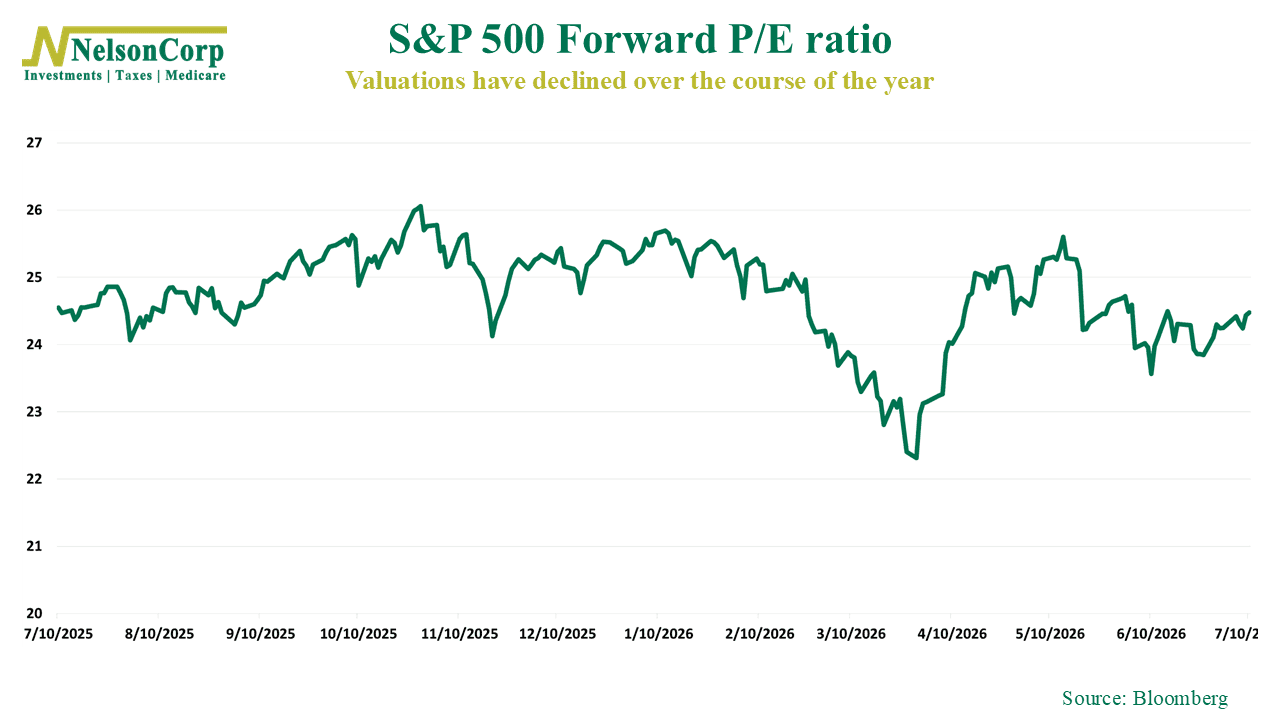
In other words, earnings have grown even faster than stock prices, helping keep valuations from becoming more stretched despite the market’s strong gains.
Even so, this earnings season could be especially important. The market is looking for good results. But it also needs results that justify the optimism already reflected in stock prices. If companies can continue delivering, the bull market should remain on solid footing. But if earnings fall short of those elevated expectations, investors may have to rethink just how much they’re willing to pay for those future profits.
This is intended for informational purposes only and should not be used as the primary basis for an investment decision. Consult an advisor for your personal situation.
Indices mentioned are unmanaged, do not incur fees, and cannot be invested into directly.
Past performance does not guarantee future results.
The S&P 500 Index, or Standard & Poor’s 500 Index, is a market-capitalization-weighted index of 500 leading publicly traded companies in the U.S.
The Dow Jones Industrial Average (DJIA) is a price-weighted index composed of 30 widely traded blue-chip U.S. common stocks. The Nasdaq 100 Index is a basket of the 100 largest, most actively traded U.S. companies listed on the Nasdaq stock exchange. The index includes companies from various industries except for the financial industry, like commercial and investment banks. The Russell 3000 Index is a capitalization-weighted stock market index that seeks to be a benchmark of the entire U.S. stock market. The S&P MidCap 400 is designed to measure the performance of 400 mid-sized companies, reflecting the distinctive risk and return characteristics of this market segment. S&P 600 Index measures the small-cap segment of the U.S. equity market. The index is designed to track companies that meet specific inclusion criteria to ensure that they are liquid and financially viable. The S&P 100 index is a capitalization-weighted index based on 100 highly capitalized stocks for which options are listed on the CBOE (Chicago Board of Exchange). The MSCI EAFE Index is an equity index which captures large and mid cap representation across 21 Developed Markets countries* around the world, excluding the US and Canada.
The Bloomberg U.S. Corporate Bond Index measures the investment grade, fixed-rate, taxable corporate bond market. The Bloomberg U.S. Corporate High Yield Index is comprised of domestic and corporate bonds rated Ba and below with a minimum outstanding amount of $150 million. The Bloomberg U.S. Municipal Index covers the USD-denominated long-term tax exempt bond market. The index has four main sectors: state and local general obligation bonds, revenue bonds, insured bonds and prerefunded bonds.