OVERVIEW
KEY CONSIDERATIONS
Show Me the Money – There’s this iconic scene in the movie Jerry Maguire where Cuba Gooding Jr. makes Tom Cruise scream this phrase into the phone: “Show me the money!”
Well, last week Wall Street kind of did the same thing to the biggest companies in the world.
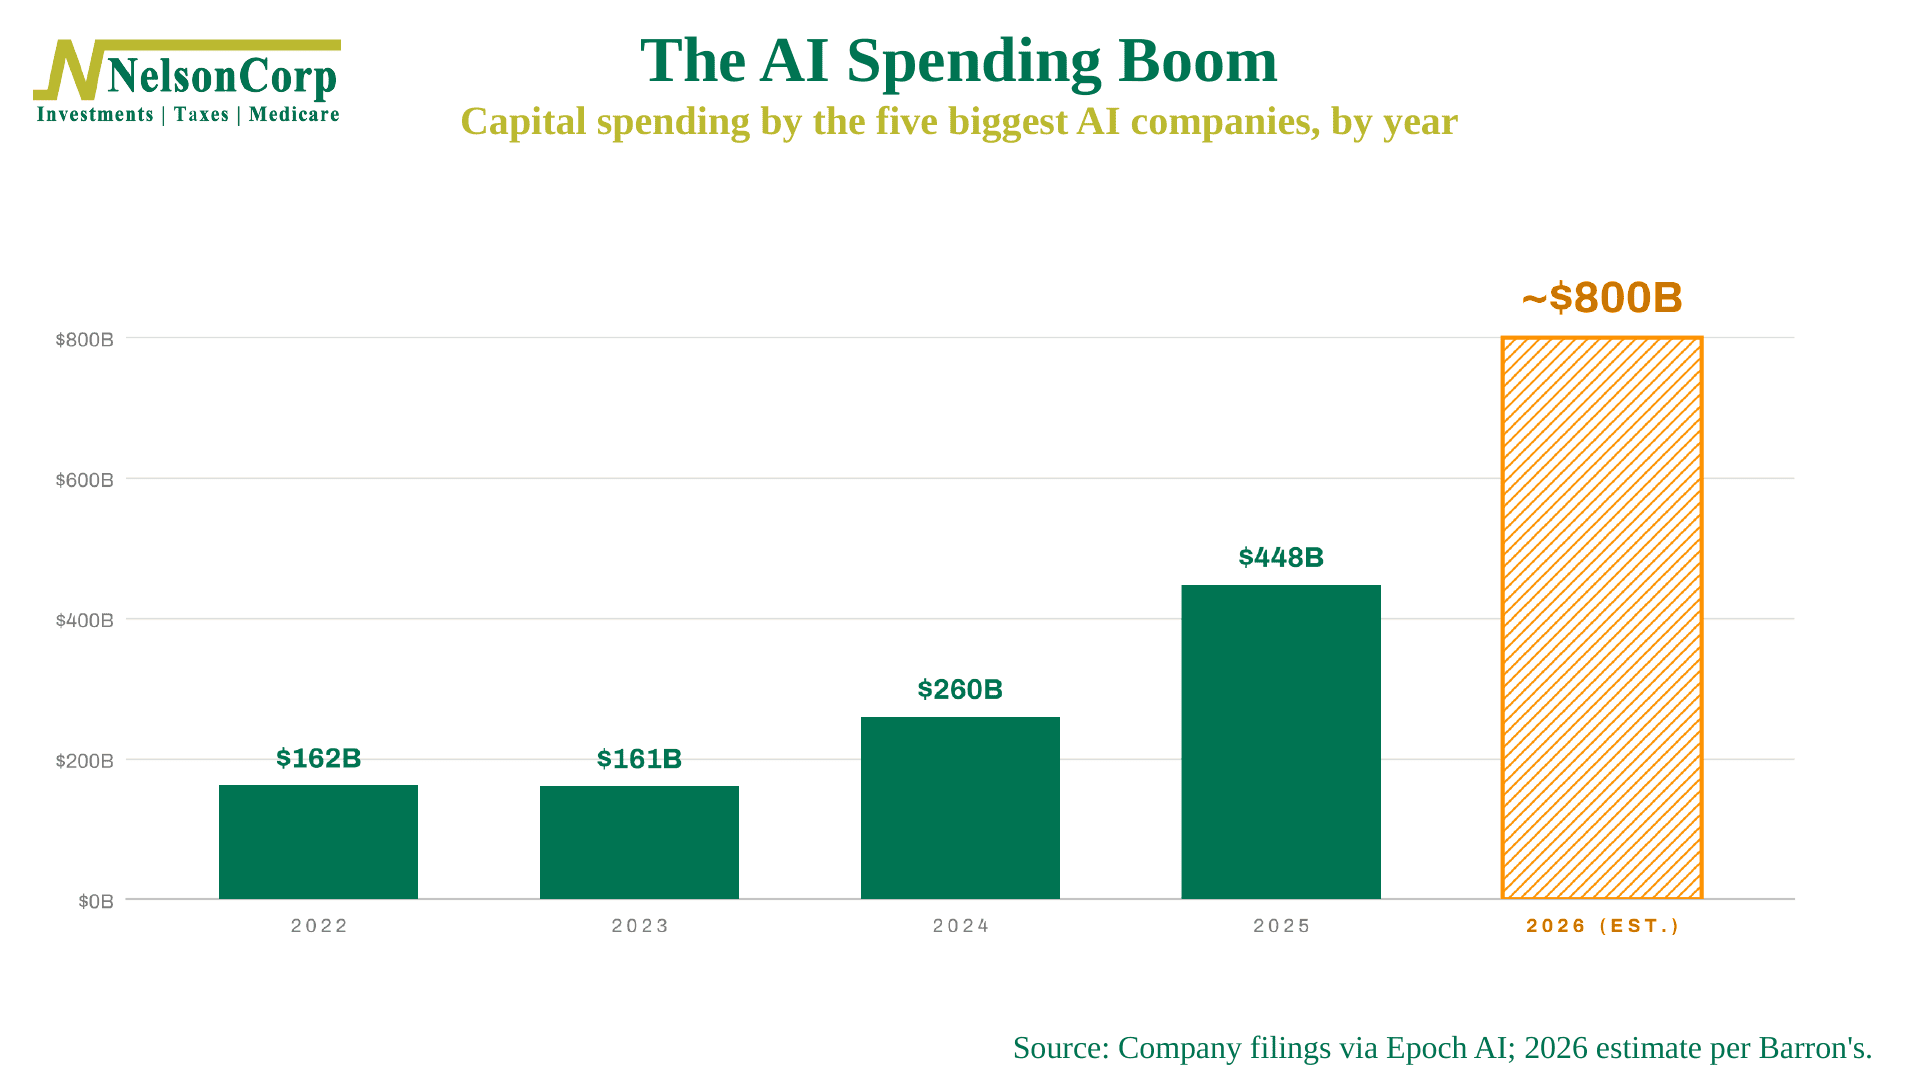
Think about the money for a second. The five largest AI spenders put about $448 billion into chips, buildings and data centers last year. This year the estimate is closer to $800 billion. And by one count, they have raised more than $300 billion in stock and bonds in 2026 to help pay for it—more than three times what they raised the year before.
For two years, investors cheered every dollar of it. Last week, however, they started asking what they were getting back. One giant reported an advertising miss and negative cash flow—and had its worst day ever, down 12%. Another reported that its cash flow had gone $42 billion negative over the past year. A big chipmaker was also down about 25% before Friday’s open. Meanwhile, the one company whose cloud business is already paying for itself went up, and the one that promised to cap its borrowing jumped 10%. Same industry, opposite reactions. The difference was cash.
Ok, that’s all well and dandy, but let’s get to what investors really want to know: is this the AI bubble popping?
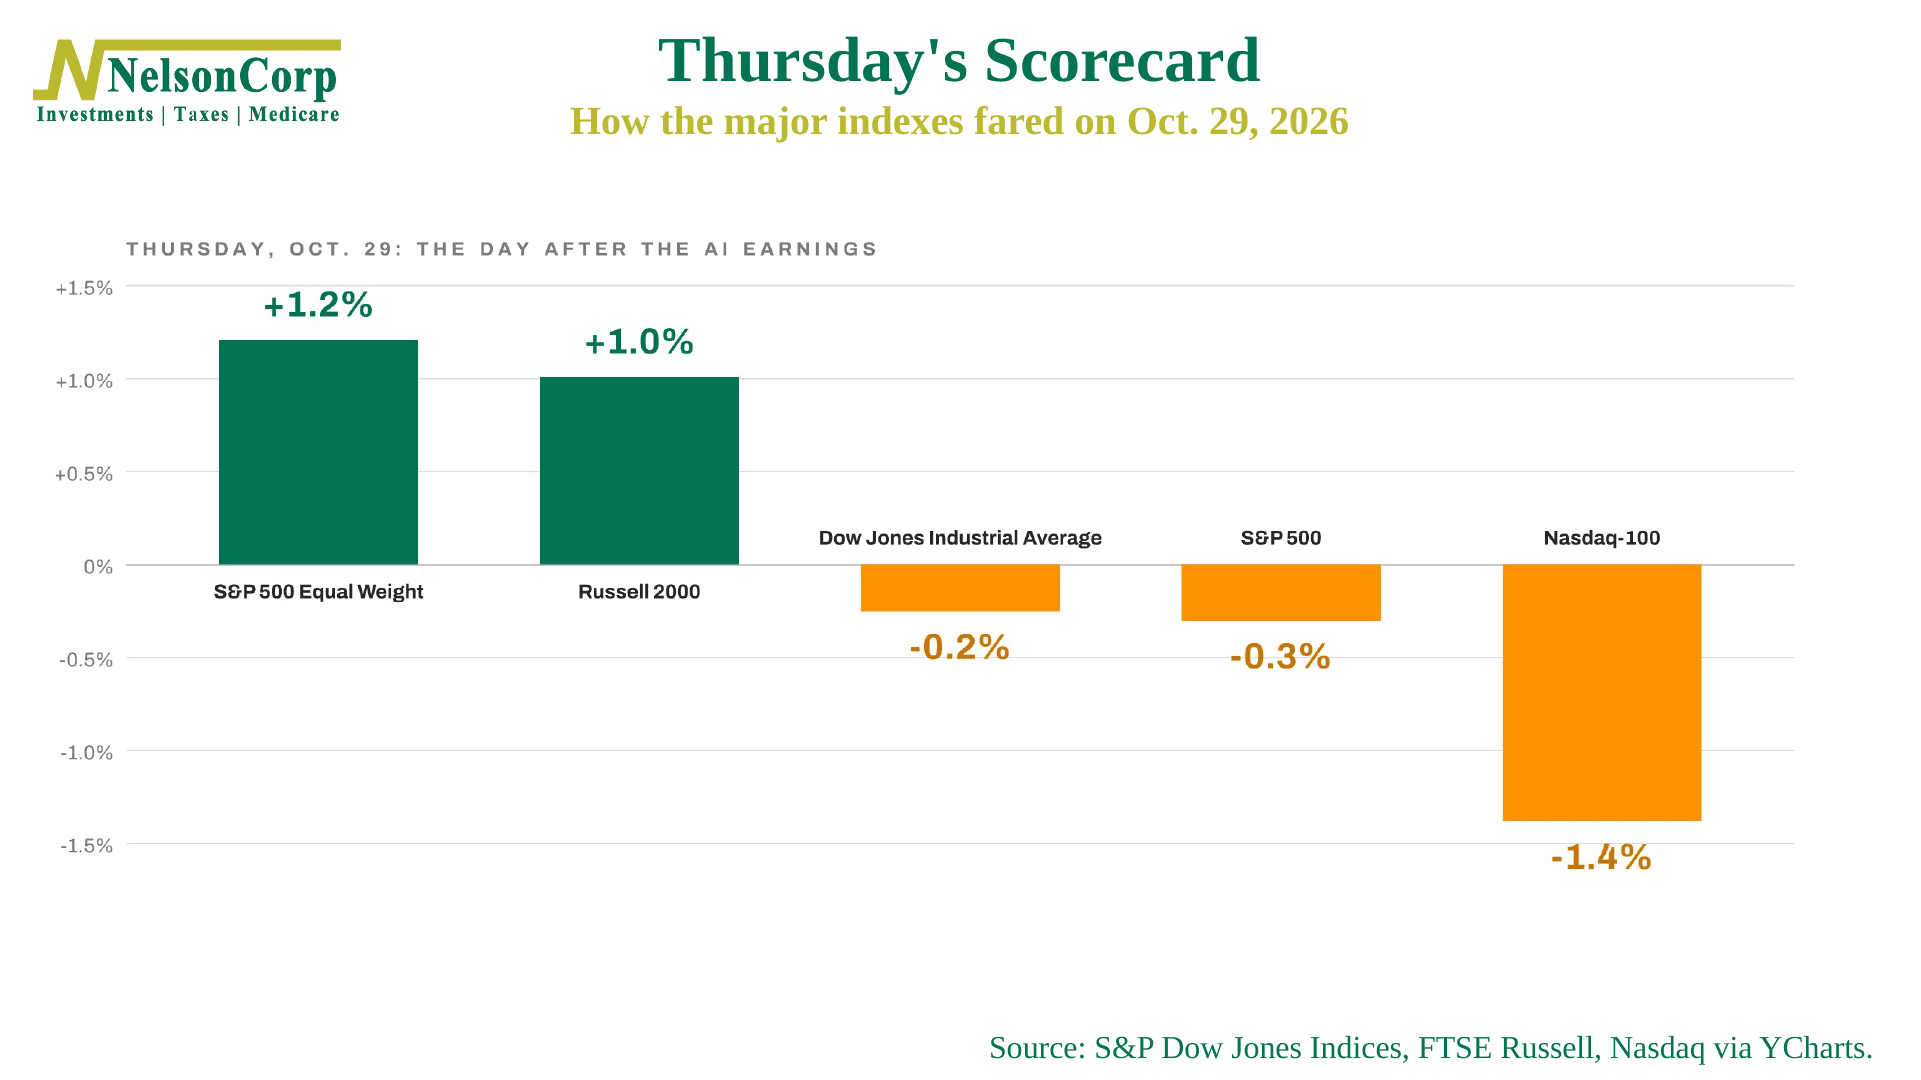
Well, nobody knows for sure, but probably not, at least not yet—and Thursday’s market results are the reason I say that. The S&P 500 slipped 0.3% that day, but 406 of its 500-odd stocks went up. The equal-weight version of the index gained 1.2%, and small caps gained 1%. In other words, the money didn’t just leave the market. It left the AI trade and went looking for companies that already make money.
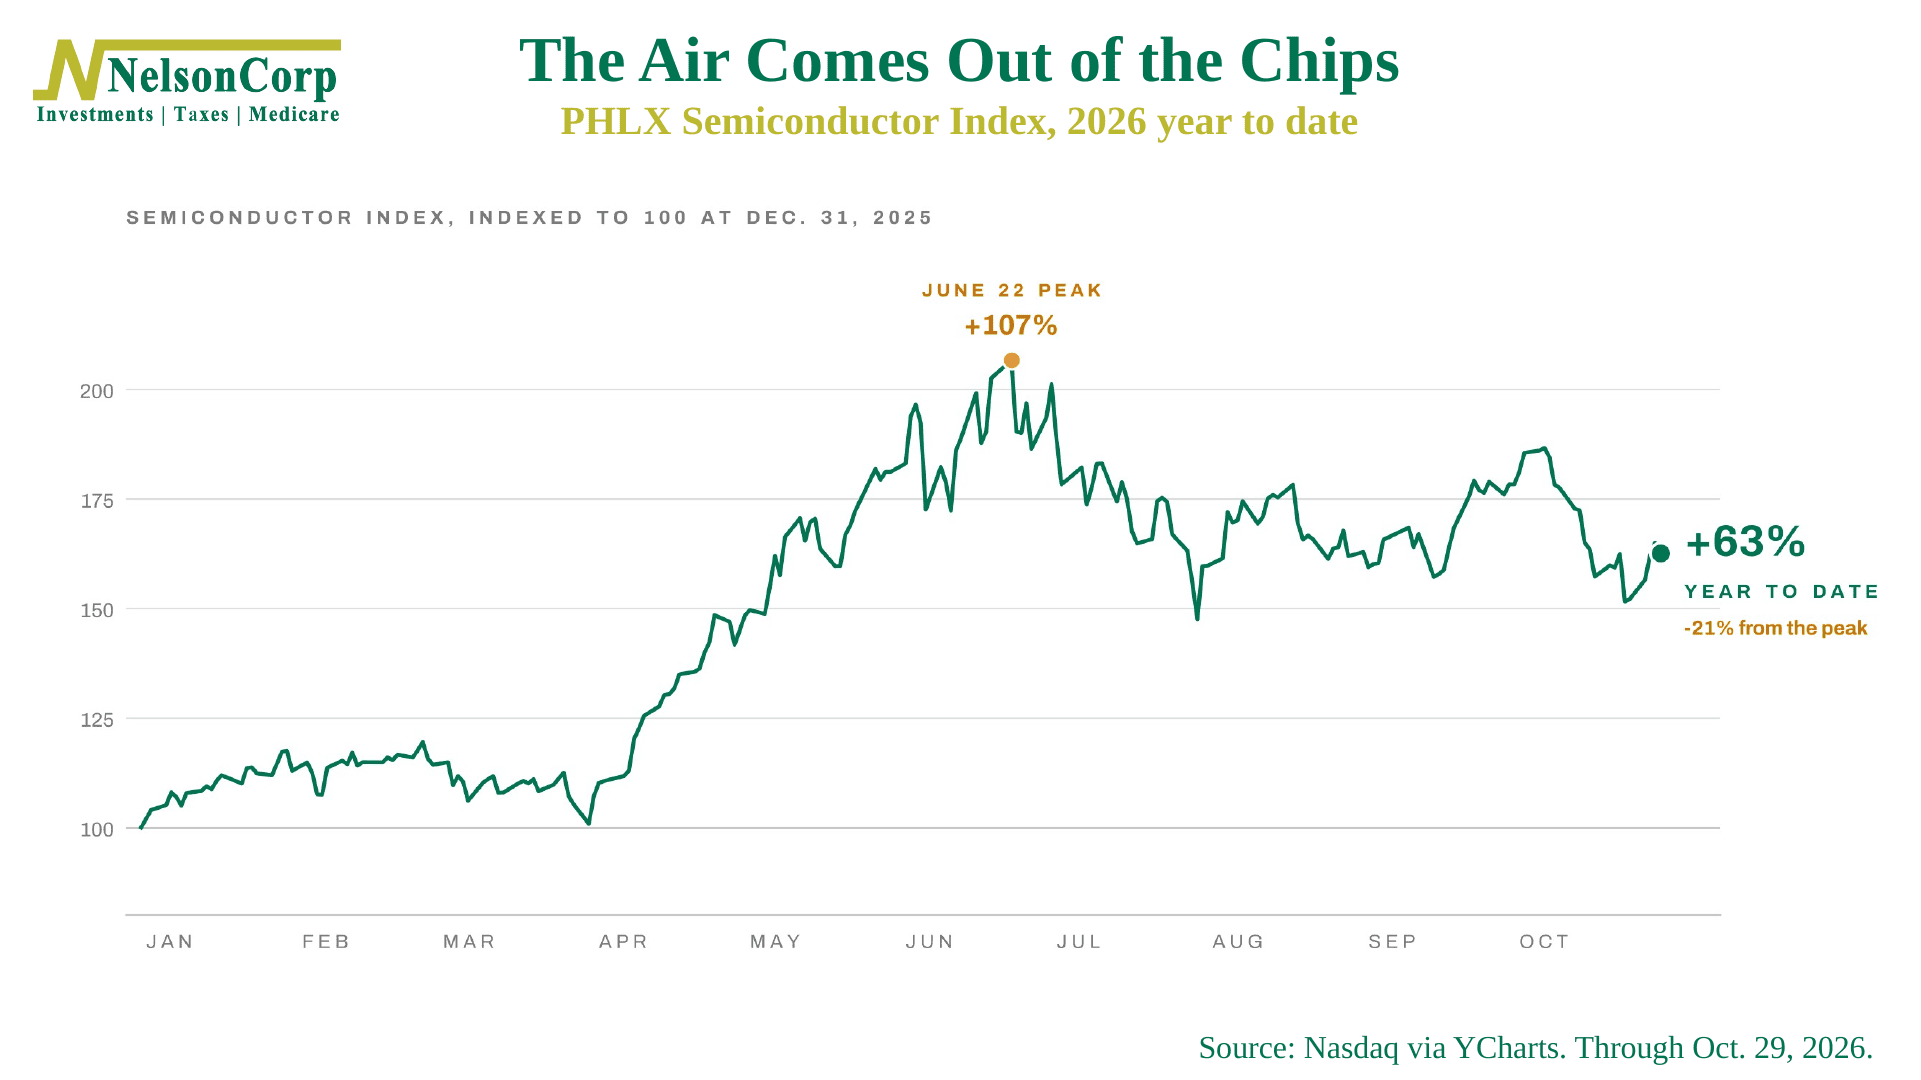
That brings me to the chips, which have been the AI trade’s scoreboard all year. They are still up about 63% in 2026, even after falling 21% from their June peak. So the air is coming out, but slowly, and from a very high altitude.
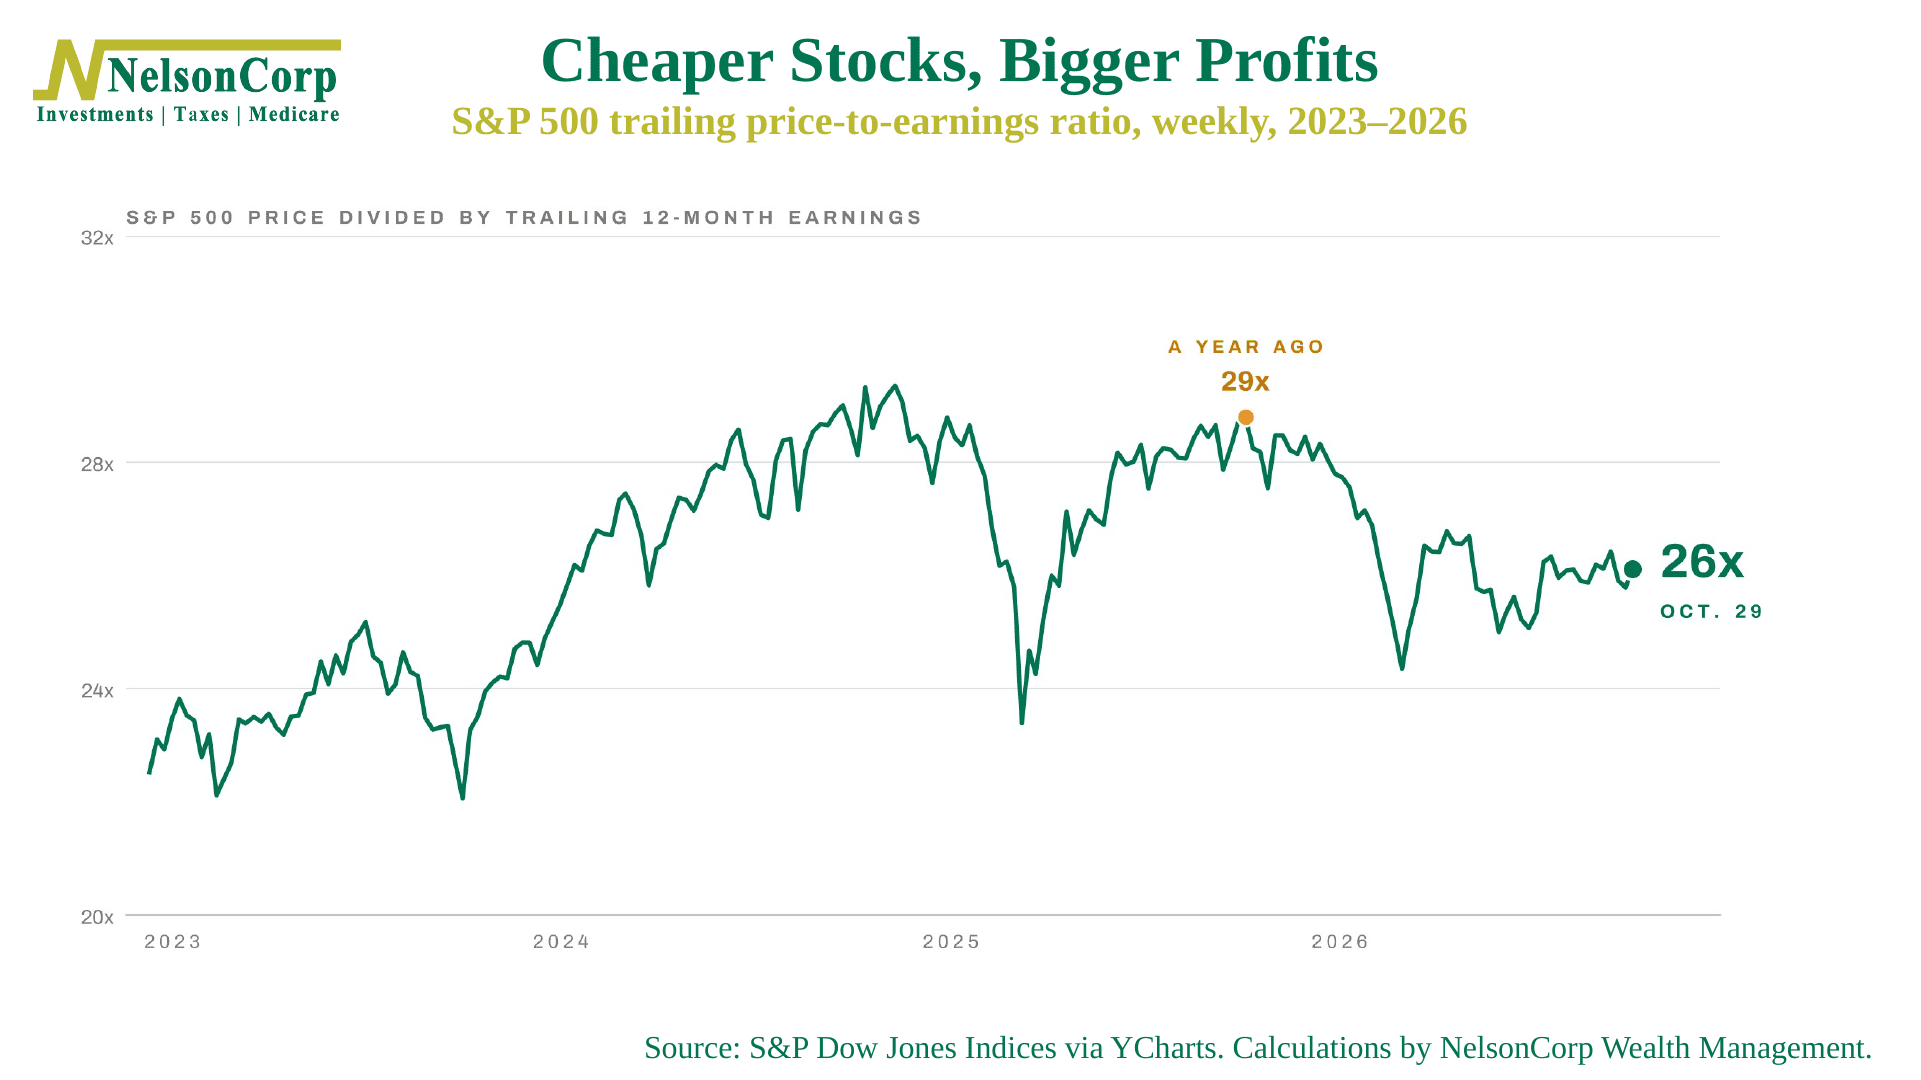
Here’s the part that gets lost in the headlines, though. Corporate profits are booming. Earnings for the S&P 500 are up about 33% from a year ago, while the index itself is up about 13%. When profits grow faster than prices, stocks get cheaper—and that’s exactly what has happened. The market now trades at about 26 times the past year’s earnings, down from 29 a year ago. That’s the good kind of cheaper.
Ok, but here’s why we’re in no hurry to chase anything. The Fed held rates steady last week, but two members voted to raise them, and the market now expects a hike in December. Inflation is running at 3.6%. Lenders have started charging the AI builders more to borrow. And the indicators we follow still show the market playing defense, which is what we wrote about in last week’s Indicator Insights. Oh, and Tuesday is Election Day.
So, the bottom line? In the movie, Jerry’s client eventually gets his money—but only after he proves he deserves it. The market is sending the AI giants the same message. The companies that can show the money will keep getting paid. The rest will have to earn it first, and until they do, the weight of the evidence says there’s no rush.
This is intended for informational purposes only and should not be used as the primary basis for an investment decision. Consult an advisor for your personal situation.
Indices mentioned are unmanaged, do not incur fees, and cannot be invested into directly.
Past performance does not guarantee future results.
The S&P 500 Index, or Standard & Poor’s 500 Index, is a market-capitalization-weighted index of 500 leading publicly traded companies in the U.S. The S&P 500 Equal Weight Index is a version of the S&P 500 in which each of the 500 companies is given the same weight, so it reflects the performance of the average stock in the index rather than the largest companies.
The Dow Jones Industrial Average (DJIA) is a price-weighted index composed of 30 widely traded blue-chip U.S. common stocks. The Nasdaq 100 Index is a basket of the 100 largest, most actively traded U.S. companies listed on the Nasdaq stock exchange. The index includes companies from various industries except for the financial industry, like commercial and investment banks. The Russell 3000 Index is a capitalization-weighted stock market index that seeks to be a benchmark of the entire U.S. stock market. The S&P MidCap 400 is designed to measure the performance of 400 mid-sized companies, reflecting the distinctive risk and return characteristics of this market segment. S&P 600 Index measures the small-cap segment of the U.S. equity market. The index is designed to track companies that meet specific inclusion criteria to ensure that they are liquid and financially viable. The S&P 100 index is a capitalization-weighted index based on 100 highly capitalized stocks for which options are listed on the CBOE (Chicago Board of Exchange). The MSCI EAFE Index is an equity index which captures large and mid cap representation across 21 Developed Markets countries* around the world, excluding the US and Canada.
The Bloomberg U.S. Corporate Bond Index measures the investment grade, fixed-rate, taxable corporate bond market. The Bloomberg U.S. Corporate High Yield Index is comprised of domestic and corporate bonds rated Ba and below with a minimum outstanding amount of $150 million. The Bloomberg U.S. Municipal Index covers the USD-denominated long-term tax exempt bond market. The index has four main sectors: state and local general obligation bonds, revenue bonds, insured bonds and prerefunded bonds.