OVERVIEW
KEY CONSIDERATIONS
Show of Strength – It was a moderately good week for the U.S. stock market. Overall, the price action was kind of flattish, but the S&P 500 is still flirting with all-time highs—so that’s good to see.
Now, not only do we like to see stock prices go up during a market recovery, but we also like to see them go up relative to other assets—safer assets like bonds, or even other stock sectors that are considered “safer,” let’s say.
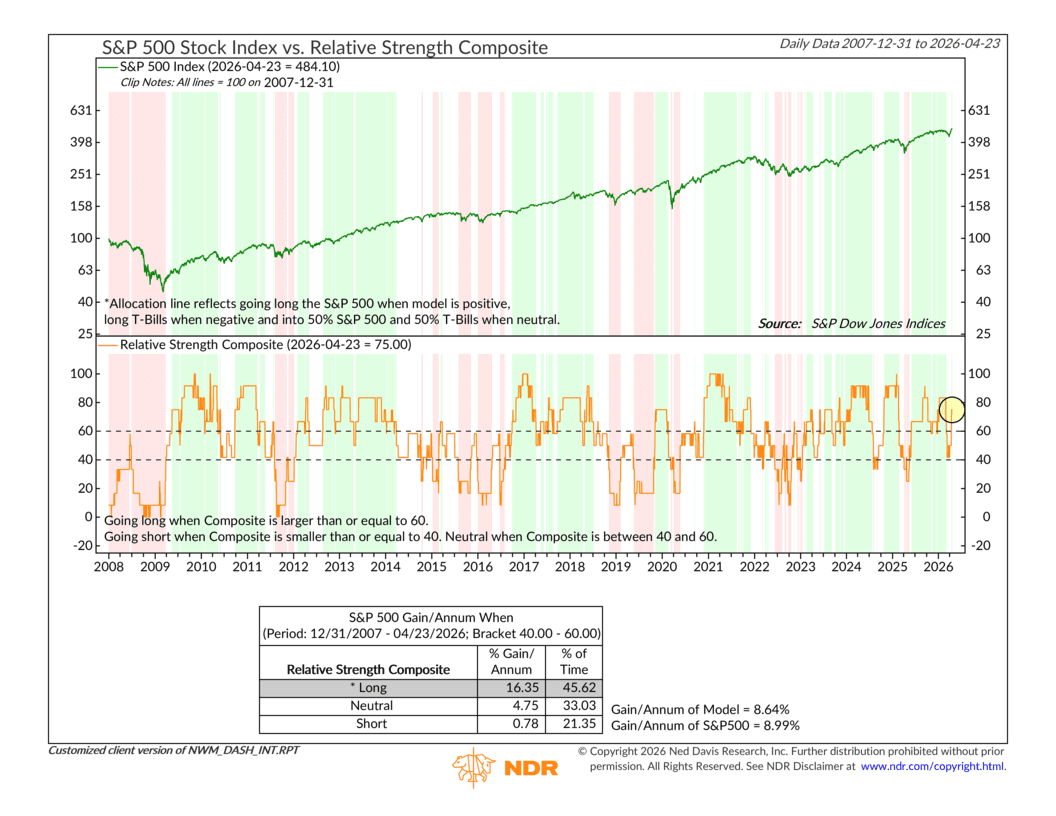
And that’s exactly what our Relative Strength Composite told us this past week. It rose into “buy” territory, driven by a handful of relative strength indicators that suggest the market is performing well relative to other facets of the market.
For example, take the SHUT Index—shown below—an equal-weighted composite of four traditionally defensive stock sectors: Consumer Staples, Health Care, Utilities, and Telecommunications.
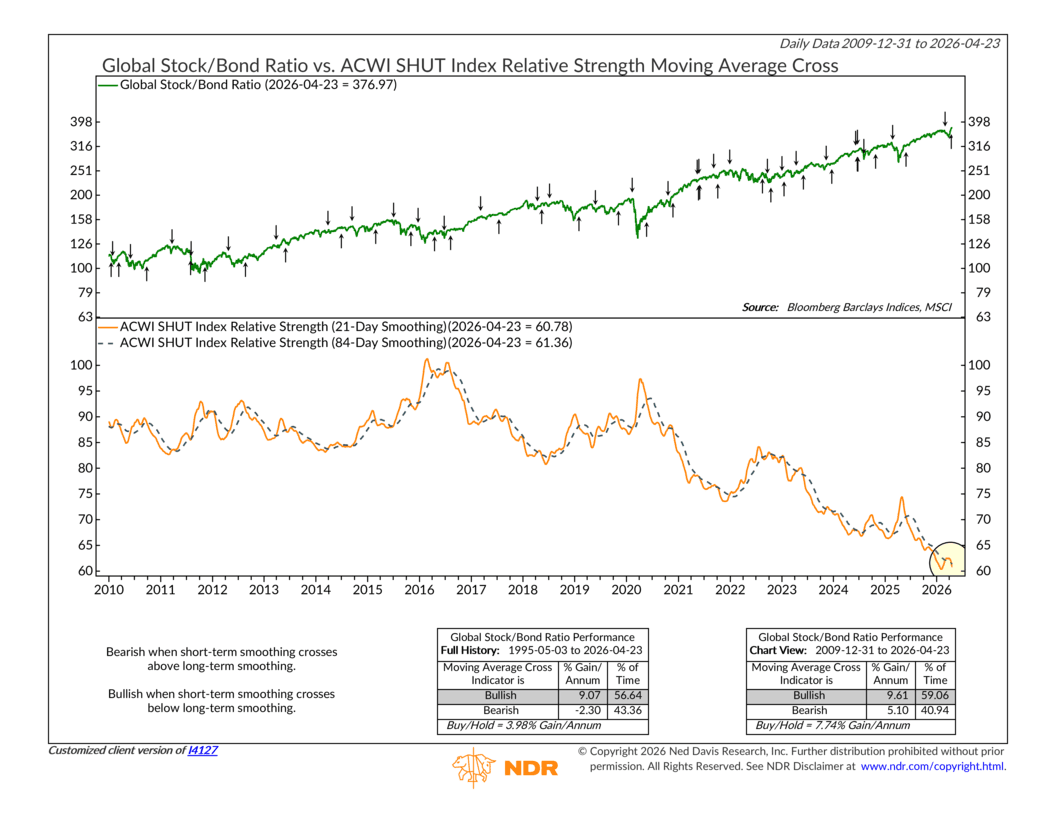
Think of it as a barometer for investor anxiety. When markets feel uncertain, investors tend to crowd into these “safe haven” sectors, pushing the SHUT Index higher relative to the broader market. But when the SHUT Index’s relative strength falls below its longer-term average—as it did recently—it signals the opposite: investors are rotating out of defensive positions and into riskier, more growth-oriented areas of the market.
Adding to the case, the Stock/Bond Trend indicator—shown below—also had a positive week, recovering back into “Neutral” territory after a period of relative weakness.
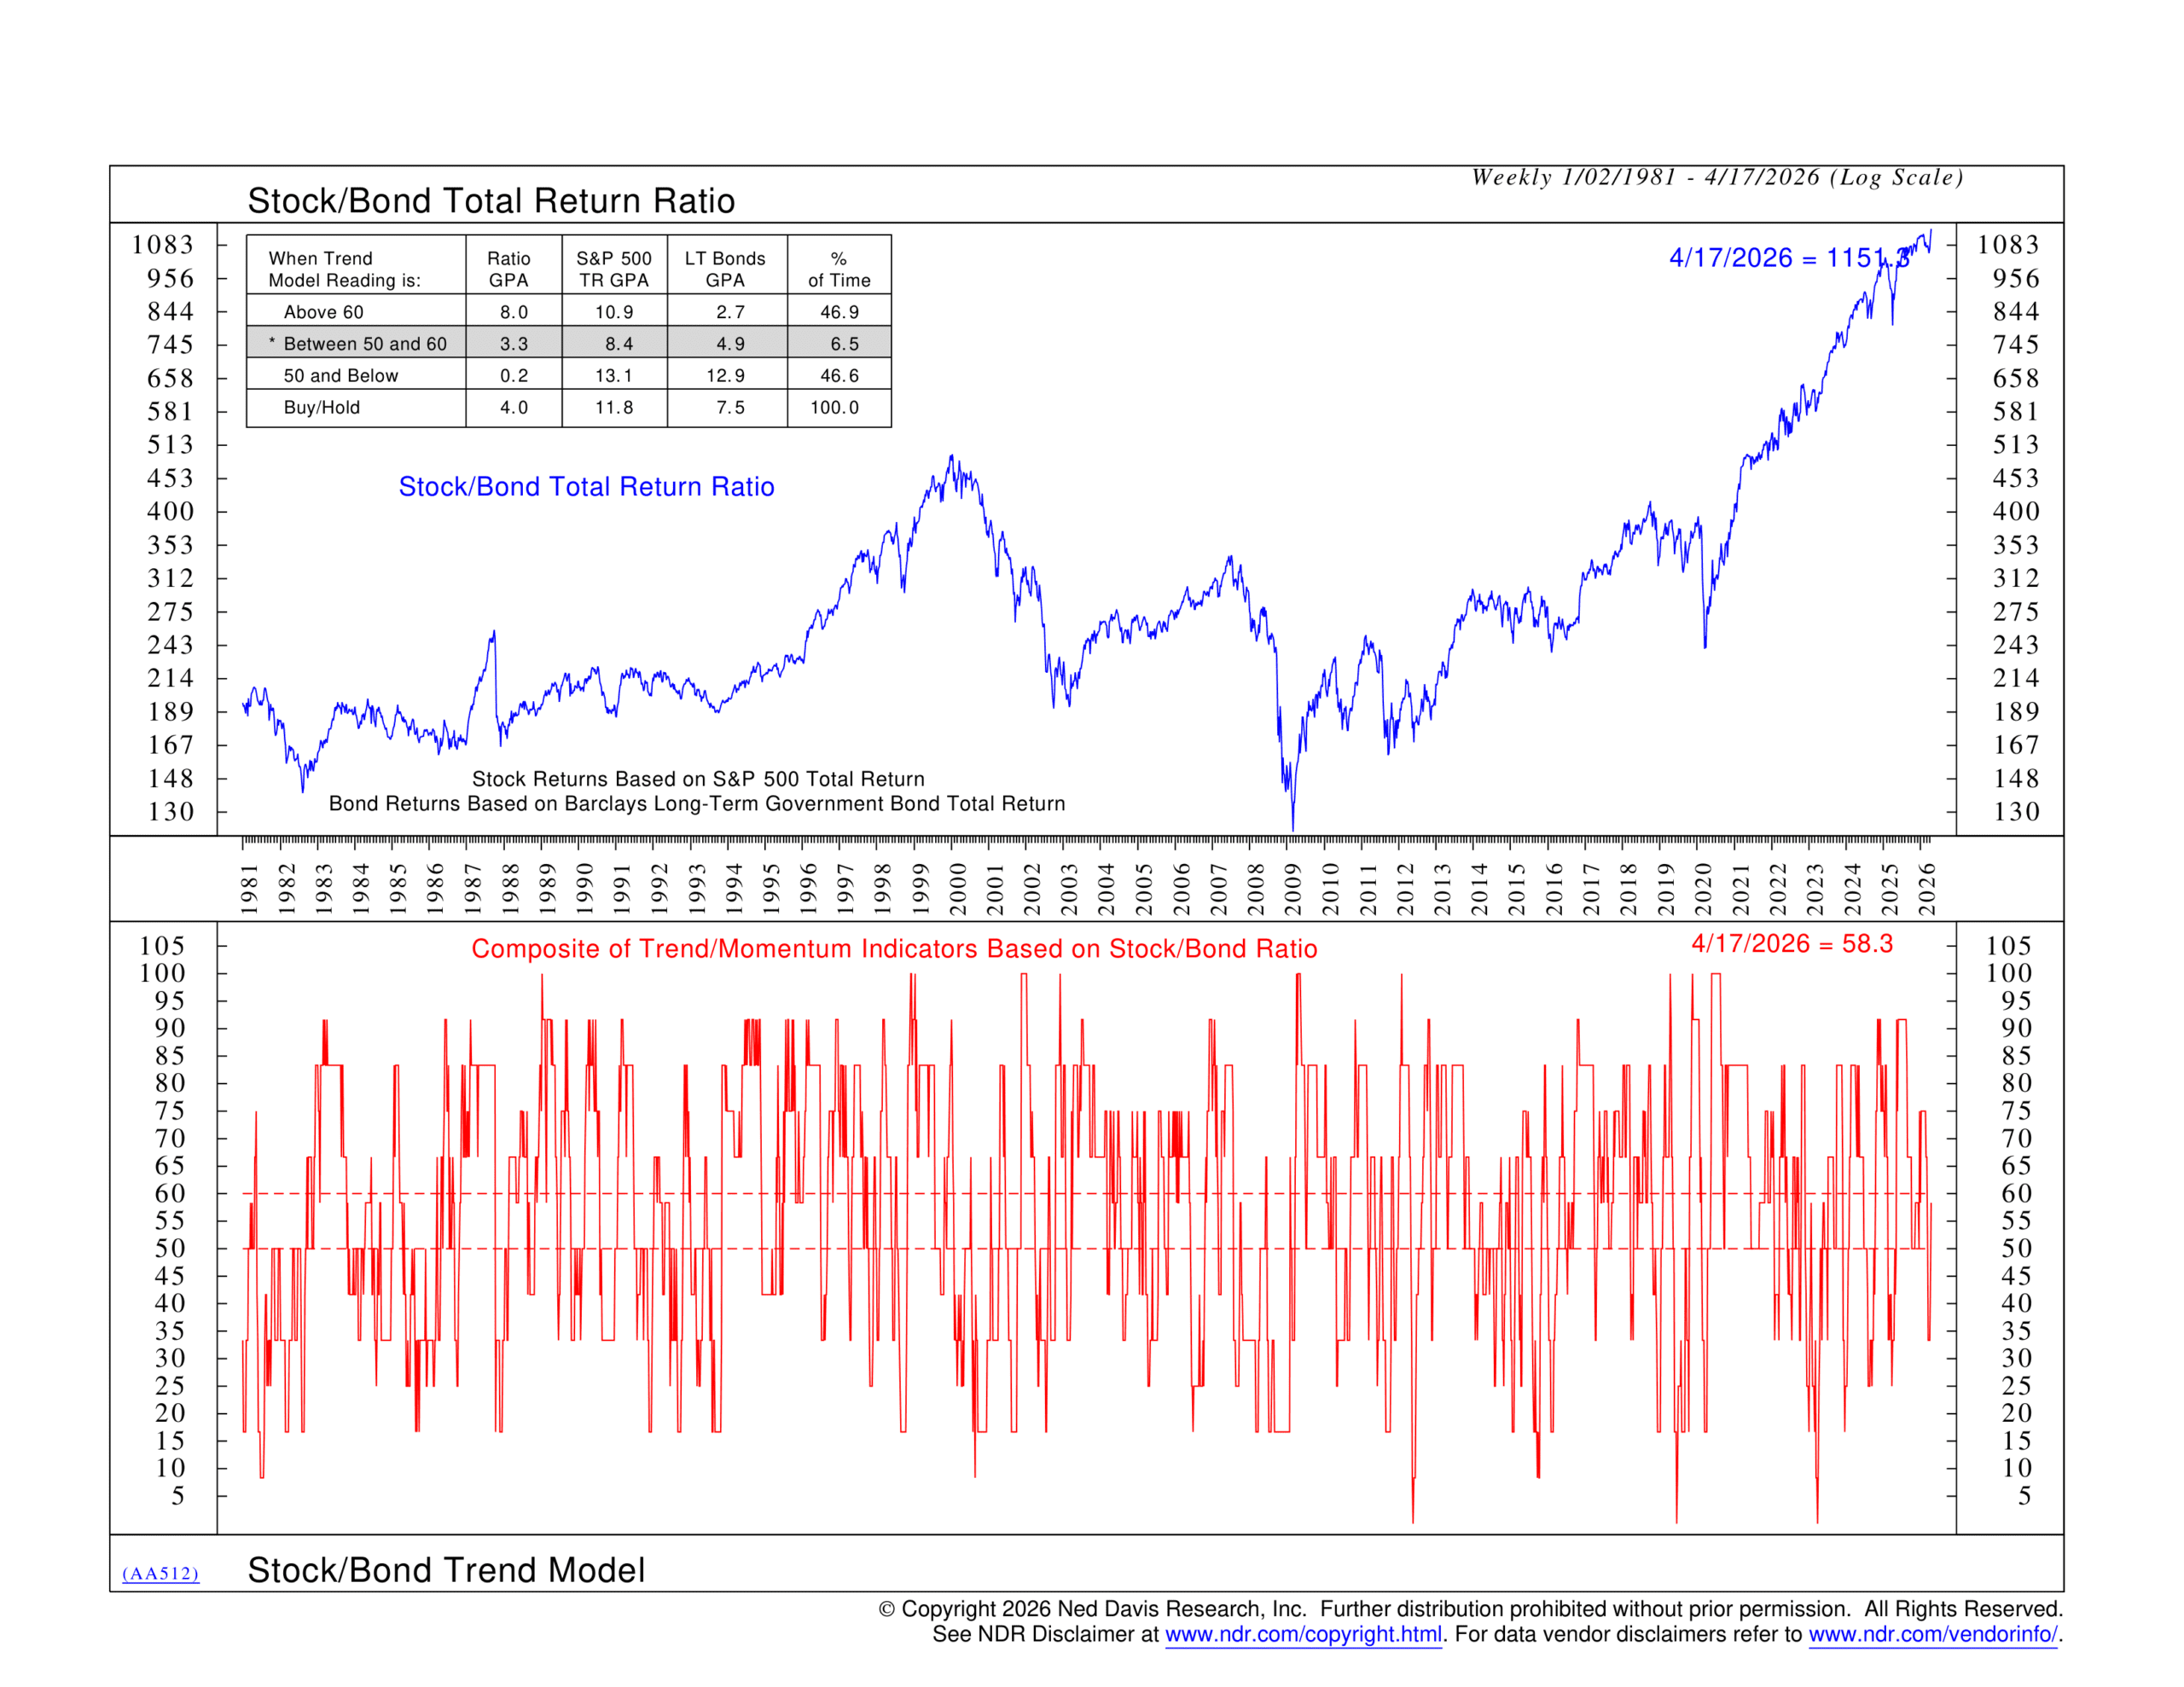
This indicator tracks the trend of stocks versus bonds and asks a simple question: which direction is investor preference moving? When bonds are leading, it typically reflects a more cautious posture—investors prioritizing safety over growth. When stocks start to reclaim the upper hand, as appears to be happening now, it reflects a growing appetite for risk. Getting back to “Neutral” might not sound like a huge victory, but after the uncertainty of recent weeks, it’s a meaningful step in the right direction.
At the same time, however, it is worth noting that our Overbought/Oversold Composite, shown below, moved to Neutral this week, after sitting in Buy territory last week.
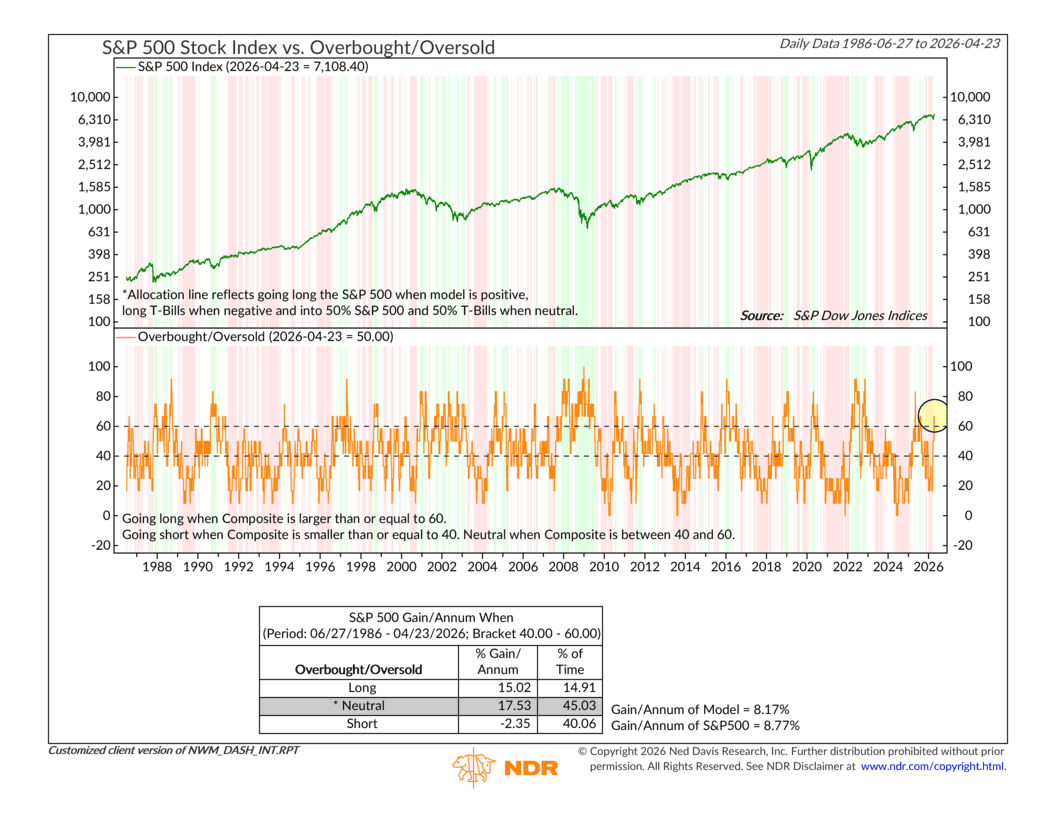
This isn’t all that big of a deal, though, because it simply reflects the fact that the market has worked off most of the oversold condition it built up during the March selloff. When a market gets beaten down hard and fast like it did, it tends to snap back sharply once sentiment shifts. We got that snapback.
So far, though, the weight of the evidence continues to trend bullish. The underlying trend in our model is about as strong as it’s been all year. Momentum remains healthy. Volume is solid. And now relative strength is adding to the case.
To be sure, the areas that still give us pause haven’t changed much. Interest rates remain a headwind—the rate environment isn’t particularly friendly to equities right now. Financial liquidity conditions haven’t loosened meaningfully. And valuations remain historically elevated, a concern we’ve flagged in recent months that doesn’t disappear just because prices are moving higher.
But, the bottom line? The recovery is maturing in a healthy way. Broadening market leadership is one of the most constructive signs we can see at this stage of a recovery, and right now, we’re seeing it. The market is putting on a genuine show of strength—and the weight of the evidence continues to support staying in it.
This is intended for informational purposes only and should not be used as the primary basis for an investment decision. Consult an advisor for your personal situation.
Indices mentioned are unmanaged, do not incur fees, and cannot be invested into directly.
Past performance does not guarantee future results.
The S&P 500 Index, or Standard & Poor’s 500 Index, is a market-capitalization-weighted index of 500 leading publicly traded companies in the U.S.
The Dow Jones Industrial Average (DJIA) is a price-weighted index composed of 30 widely traded blue-chip U.S. common stocks. The Nasdaq 100 Index is a basket of the 100 largest, most actively traded U.S. companies listed on the Nasdaq stock exchange. The index includes companies from various industries except for the financial industry, like commercial and investment banks. The Russell 3000 Index is a capitalization-weighted stock market index that seeks to be a benchmark of the entire U.S. stock market. The S&P MidCap 400 is designed to measure the performance of 400 mid-sized companies, reflecting the distinctive risk and return characteristics of this market segment. S&P 600 Index measures the small-cap segment of the U.S. equity market. The index is designed to track companies that meet specific inclusion criteria to ensure that they are liquid and financially viable. The S&P 100 index is a capitalization-weighted index based on 100 highly capitalized stocks for which options are listed on the CBOE (Chicago Board of Exchange). The MSCI EAFE Index is an equity index which captures large and mid cap representation across 21 Developed Markets countries* around the world, excluding the US and Canada.
The Bloomberg U.S. Corporate Bond Index measures the investment grade, fixed-rate, taxable corporate bond market. The Bloomberg U.S. Corporate High Yield Index is comprised of domestic and corporate bonds rated Ba and below with a minimum outstanding amount of $150 million. The Bloomberg U.S. Municipal Index covers the USD-denominated long-term tax exempt bond market. The index has four main sectors: state and local general obligation bonds, revenue bonds, insured bonds and prerefunded bonds.