OVERVIEW
Markets were mixed over the week, with modest gains in some large-cap areas and more pressure beneath the surface. The S&P 500 edged higher by 0.34%, while the Dow Jones Industrial Average slipped 0.42%. The NASDAQ finished slightly lower, down 0.17%, even as the largest companies showed some resilience, with the S&P 100 gaining 0.51%.
Leadership continued to diverge across market segments. Mid- and small-cap stocks lagged, with the S&P 400 down 1.42% and the S&P 600 lower by 0.91%. Within the Russell 3000, value stocks outperformed meaningfully, rising 0.54% for the week, while growth fell 0.55%. Despite the recent volatility, value-oriented areas continue to hold a notable advantage on a year-to-date basis.
International equities were a clear bright spot. Developed markets advanced 1.56%, and emerging markets rose 1.80%, extending their strong start to the year. The combination of improving relative performance and supportive currency trends has continued to favor non-U.S. equities.
Fixed income returns were mixed but generally steady. Short-term Treasuries posted small gains, while longer-term Treasuries declined as rates moved higher. Credit-sensitive areas, including investment-grade and high-yield bonds, finished slightly lower on the week, though year-to-date results remain positive across most bond sectors.
Commodities delivered another week of strength, rising 0.93% overall. Oil surged 7.53%, continuing its strong run this year, while gold pulled back sharply, falling 5.42% after recent gains. Real estate posted a modest gain of 0.29%. The U.S. dollar declined 0.22%, which has generally been supportive for international assets and commodities.
Volatility moved higher, with the VIX settling around 17 to end the week.
KEY CONSIDERATIONS
So You’re Saying There’s a Chance? – I came across an interesting chart this week that looks at the probability of different stock market outcomes during periods of economic expansion.
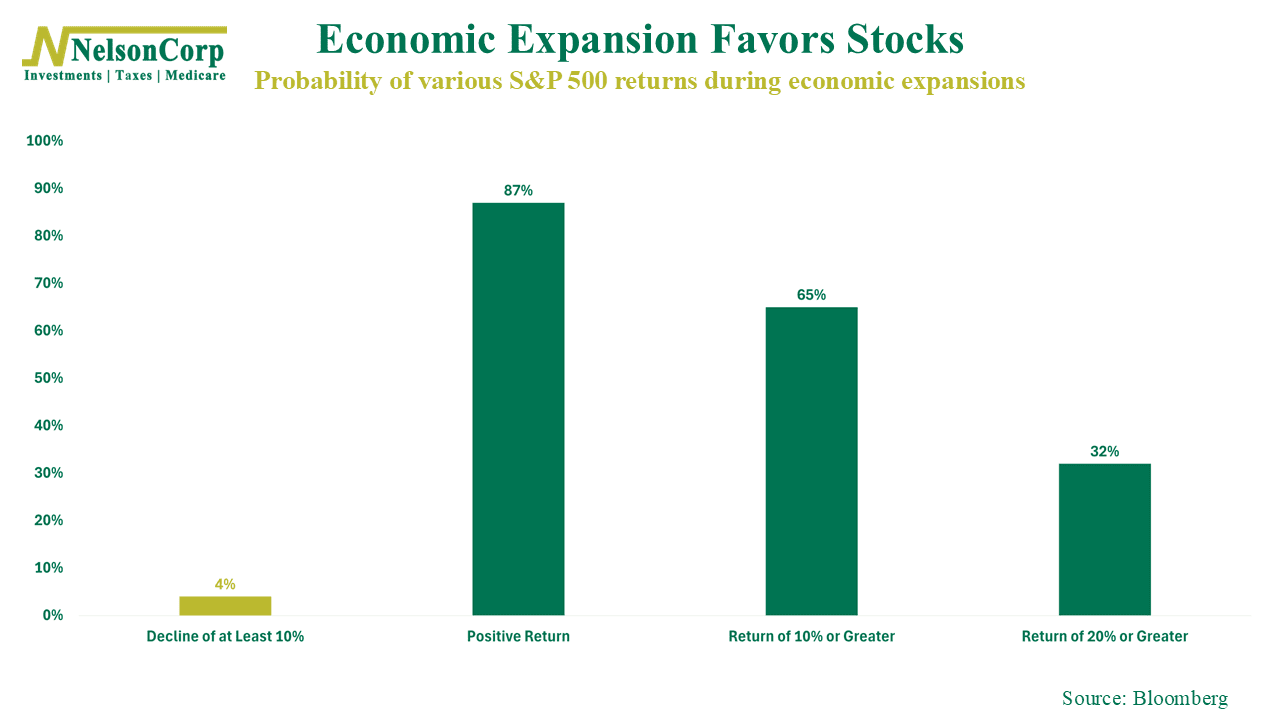
This is probably a “yeah, duh” statement, but as you can see, the stock market tends to do well when the economy is doing well. During expansions, there’s been an 87% chance the S&P 500 posts a positive return over the following year. And only about 4% of the time has the market fallen by more than 10%.
I bring this up because a lot of investors tend to get worked up when the market starts to look expensive or overvalued.
To be fair, they’re not wrong. As the next chart shows, the market’s median price-to-earnings ratio currently sits at 25.63, roughly 23% above its 45-year average of 20.8.
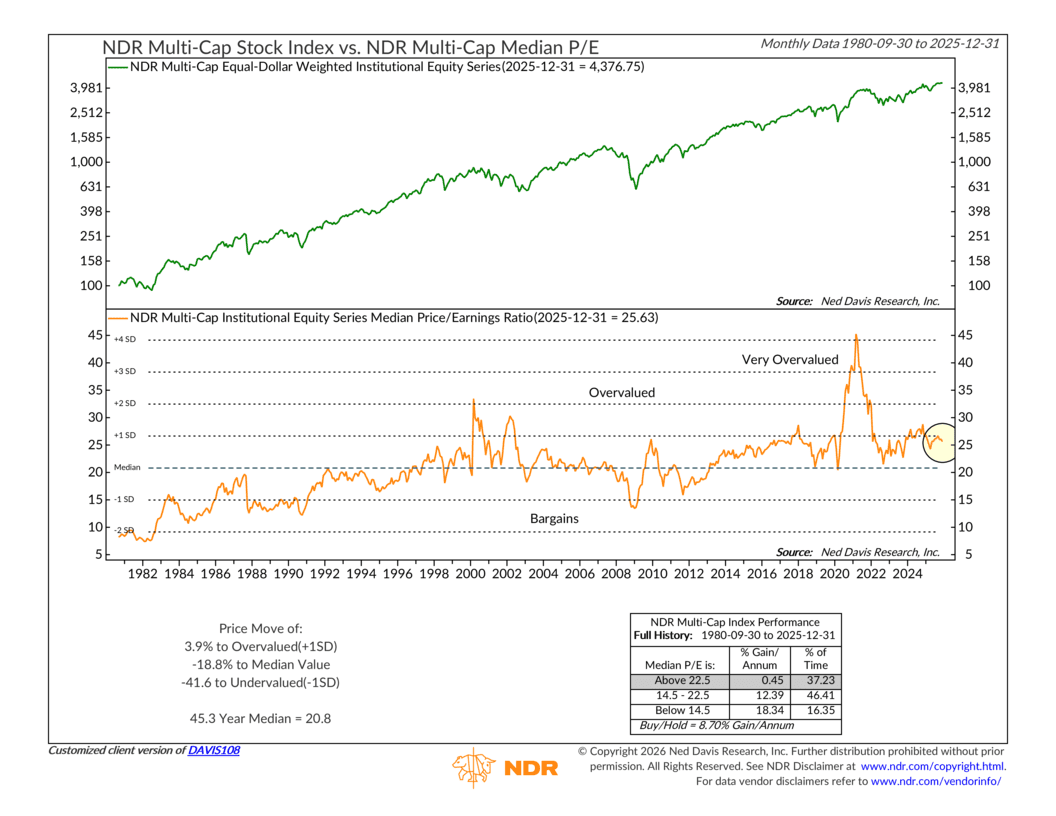
But the point of that first chart is that valuations aren’t everything. The economic backdrop matters too.
So let’s take a look at where the economy actually stands.
First up, we have the Citigroup U.S. Economic Surprise Index. This indicator measures whether economic data is coming in above or below analysts’ expectations. For most of last year, it was hovering in the neutral zone, but last week, it finally managed to pop up into the bullish zone.
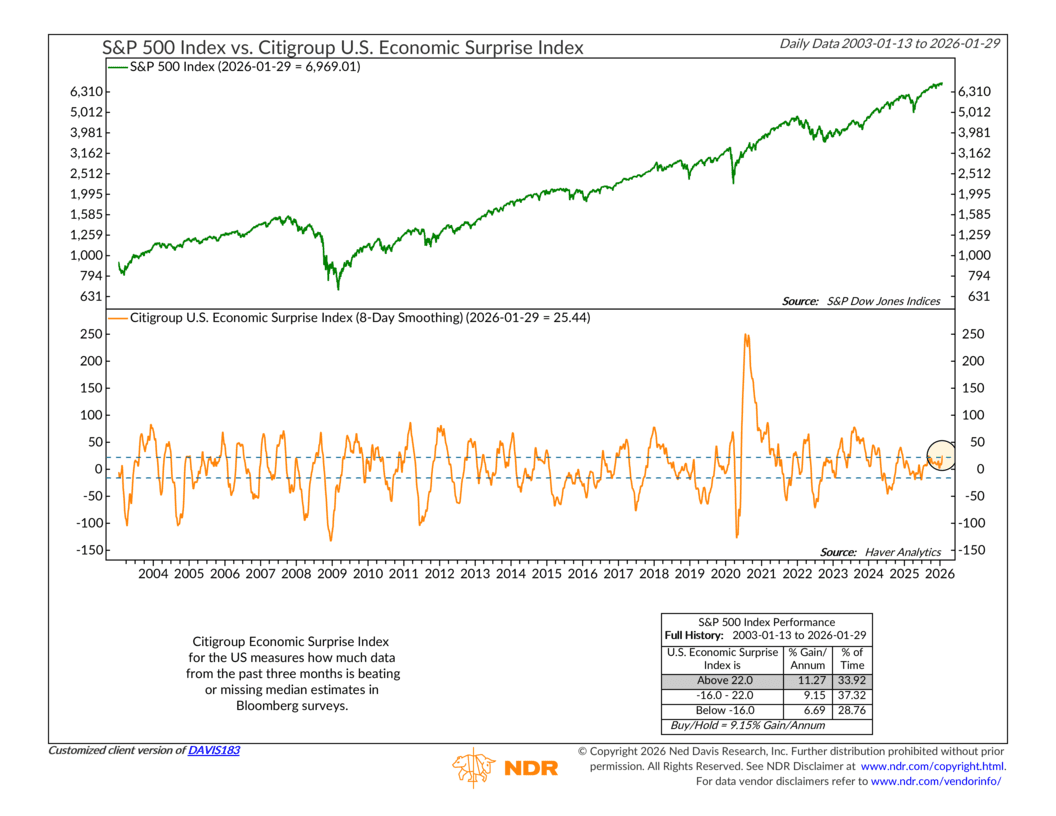
In other words, the latest incoming economic data is surprising to the upside, and that is bullish for stocks.
Here’s another bullish chart. This one shows how many OECD countries have a CLI (Composite Leading Indicator) above 100—meaning its economy is expanding. As you can see, in 2023 and 2024, it had dipped to just around 15% but has since climbed all the way to 94%.
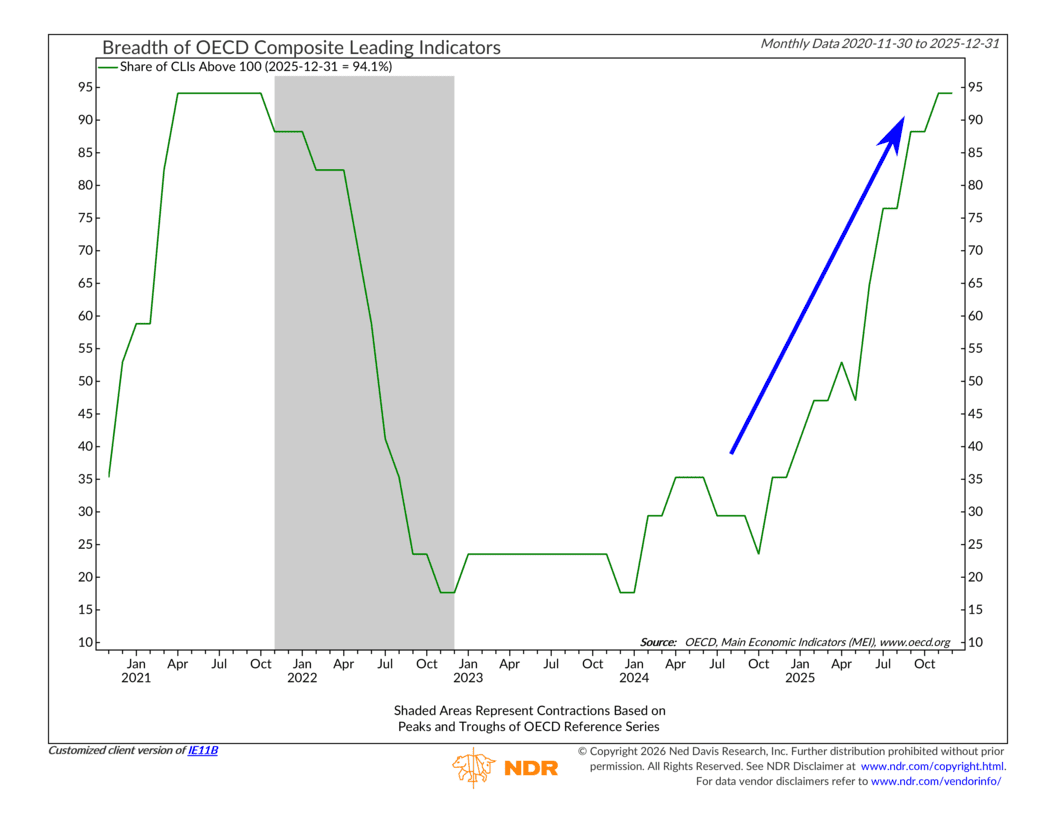
This probably goes a long way to explaining why U.S. and foreign stocks did so well last year—the global economy is expanding!
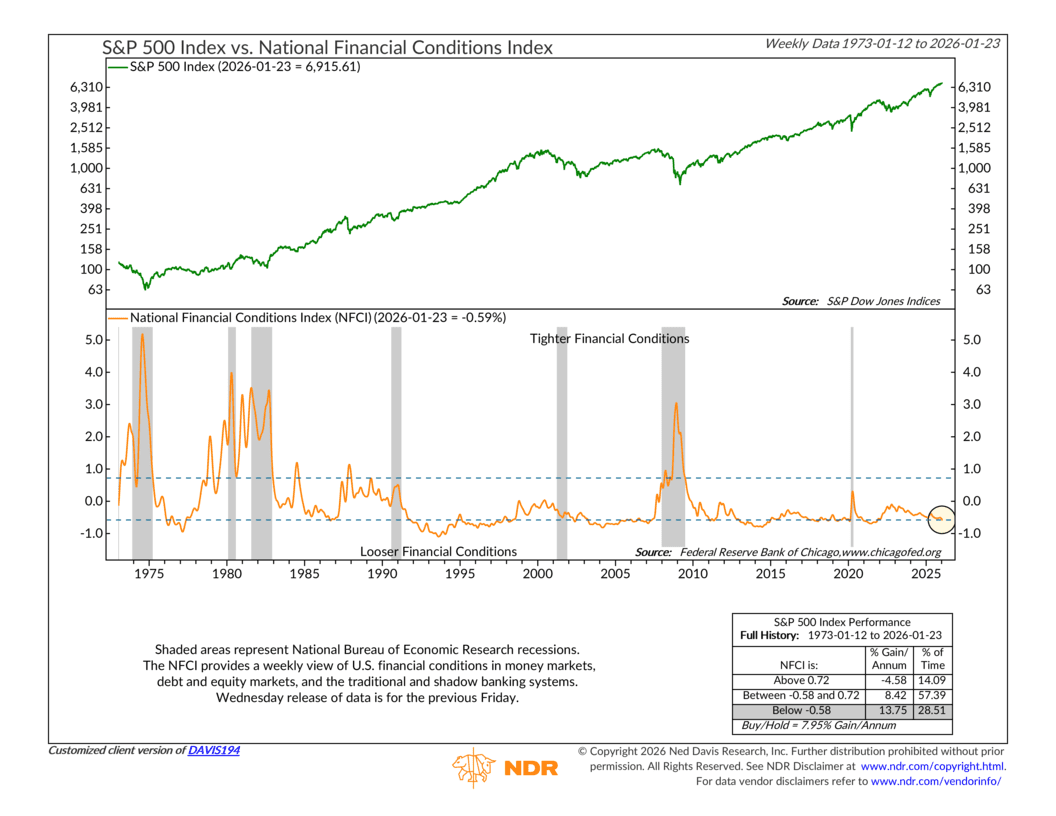
And finally, we have financial conditions. The following indicator shows that when the National Financial Conditions Index (NFCI) falls below -0.58, it’s a sign of looser financial conditions. By the way, stocks love loose financial conditions, as the performance box at the bottom of the chart shows.
So, we have a lot of evidence that the economy is on solid footing. Sure, valuations may be elevated, but the economy and financial conditions are providing support.
As long as this remains to be case, there is a pretty good chance the market will be able to avoid a big downturn.
This is intended for informational purposes only and should not be used as the primary basis for an investment decision. Consult an advisor for your personal situation.
Indices mentioned are unmanaged, do not incur fees, and cannot be invested into directly.
Past performance does not guarantee future results.
The S&P 500 Index, or Standard & Poor’s 500 Index, is a market-capitalization-weighted index of 500 leading publicly traded companies in the U.S.
The Dow Jones Industrial Average (DJIA) is a price-weighted index composed of 30 widely traded blue-chip U.S. common stocks. The Nasdaq 100 Index is a basket of the 100 largest, most actively traded U.S. companies listed on the Nasdaq stock exchange. The index includes companies from various industries except for the financial industry, like commercial and investment banks. The Russell 3000 Index is a capitalization-weighted stock market index that seeks to be a benchmark of the entire U.S. stock market. The S&P MidCap 400 is designed to measure the performance of 400 mid-sized companies, reflecting the distinctive risk and return characteristics of this market segment. S&P 600 Index measures the small-cap segment of the U.S. equity market. The index is designed to track companies that meet specific inclusion criteria to ensure that they are liquid and financially viable. The S&P 100 index is a capitalization-weighted index based on 100 highly capitalized stocks for which options are listed on the CBOE (Chicago Board of Exchange). The MSCI EAFE Index is an equity index which captures large and mid cap representation across 21 Developed Markets countries* around the world, excluding the US and Canada.
The Bloomberg U.S. Corporate Bond Index measures the investment grade, fixed-rate, taxable corporate bond market. The Bloomberg U.S. Corporate High Yield Index is comprised of domestic and corporate bonds rated Ba and below with a minimum outstanding amount of $150 million. The Bloomberg U.S. Municipal Index covers the USD-denominated long-term tax exempt bond market. The index has four main sectors: state and local general obligation bonds, revenue bonds, insured bonds and prerefunded bonds.