OVERVIEW
Markets posted broad gains last week, with strength across major equity benchmarks. The S&P 500 rose 0.55%, and the Dow Jones Industrial Average gained 1.14%. The NASDAQ led large caps, advancing 1.43%. Smaller companies also saw solid gains, with the S&P 400 up 1.17% and the S&P 600 rising 1.36%. Growth outpaced value, as the Russell 3000 Growth Index climbed 1.04% compared to a 0.14% rise in Value.
International stocks participated in the rally. Developed markets (EAFE) gained 1.50%, while emerging markets surged 1.91%. The U.S. dollar fell 0.83%, helping boost overseas returns.
Bond markets turned positive. Long-term Treasuries rallied 2.07%, reversing recent weakness, and intermediate-term Treasuries rose 1.03%. Investment-grade corporates gained 1.30%, and high yield bonds added 1.06%. Municipals posted a smaller 0.52% gain.
Commodities were mixed. Oil tumbled 6.54% and gold slipped 1.64%, while corn rebounded with a 2.28% gain. Real estate advanced 1.42%, and the VIX dropped sharply, falling 10.25% as volatility continued to retreat.
KEY CONSIDERATIONS
Streaking in Calm Waters – It was another decent week for the U.S. stock market. The S&P 500 continued its steady march higher. It bottomed on April 8th and hasn’t looked back since.
Over shorter time frames, like 20 days, the underlying market strength has been pretty darn consistent. As the following chart shows, the S&P 500 has traded above its average 20-day price for 58 straight days now.
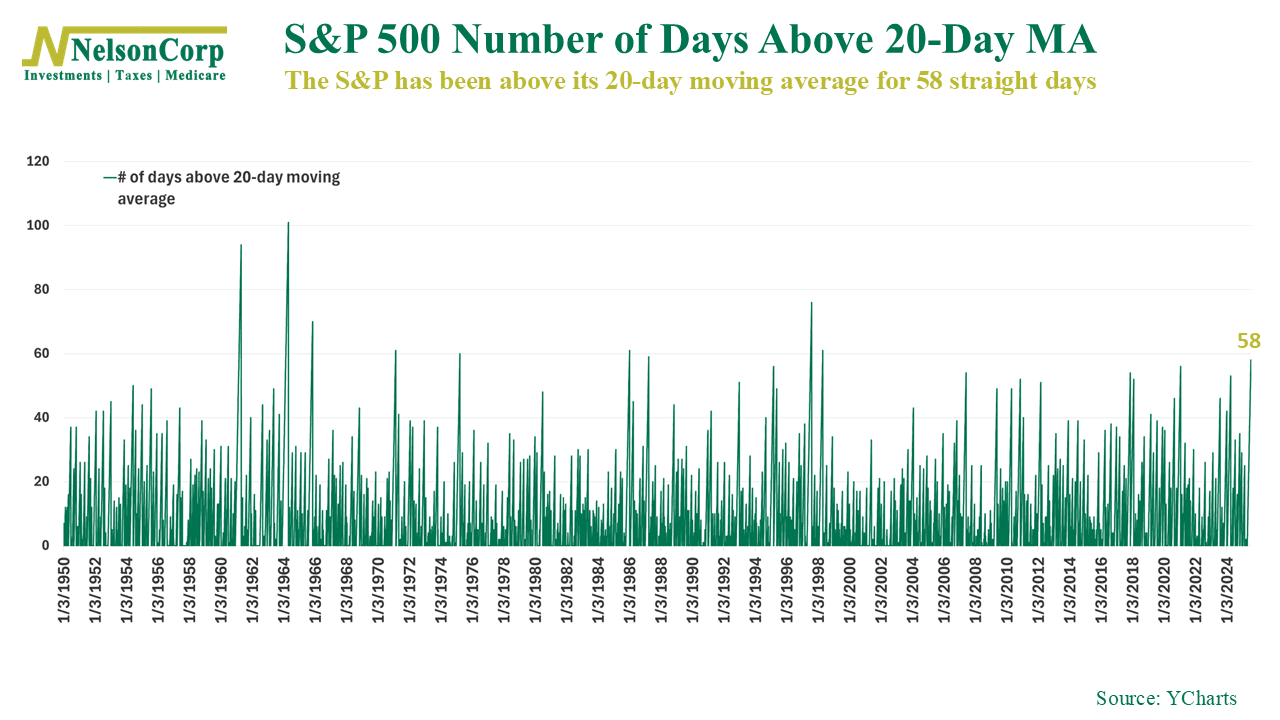
While not unheard of, this type of streak is quite rare. It’s the longest such streak since 1998!
Of course, this type of consistent strength generally comes during periods of upward market momentum and bull market rallies. That’s the good news. The less good news is that it does leave the market vulnerable to a potential short-term pullback—something to keep in mind.
But, on top of all this, it’s hard to ignore the fact that volatility has completely collapsed. Here’s the VIX Index, our go-to measure of implied market volatility.
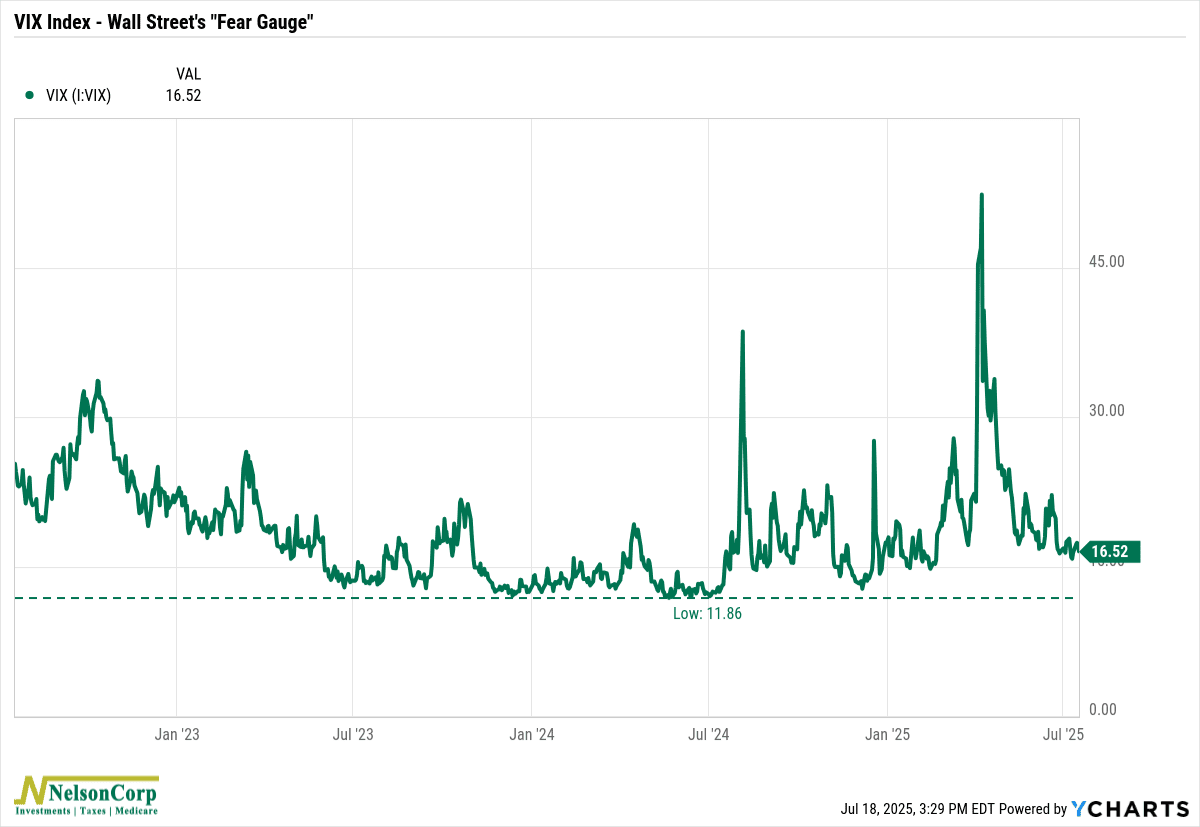
At a reading of just under 17, it’s quite subdued compared to what we saw back in April. It’s also below the long-term average of roughly 20.
But it can also go lower. It dropped to below 12 a little more than a year ago. So compared to those levels, volatility is still a tad bit elevated.
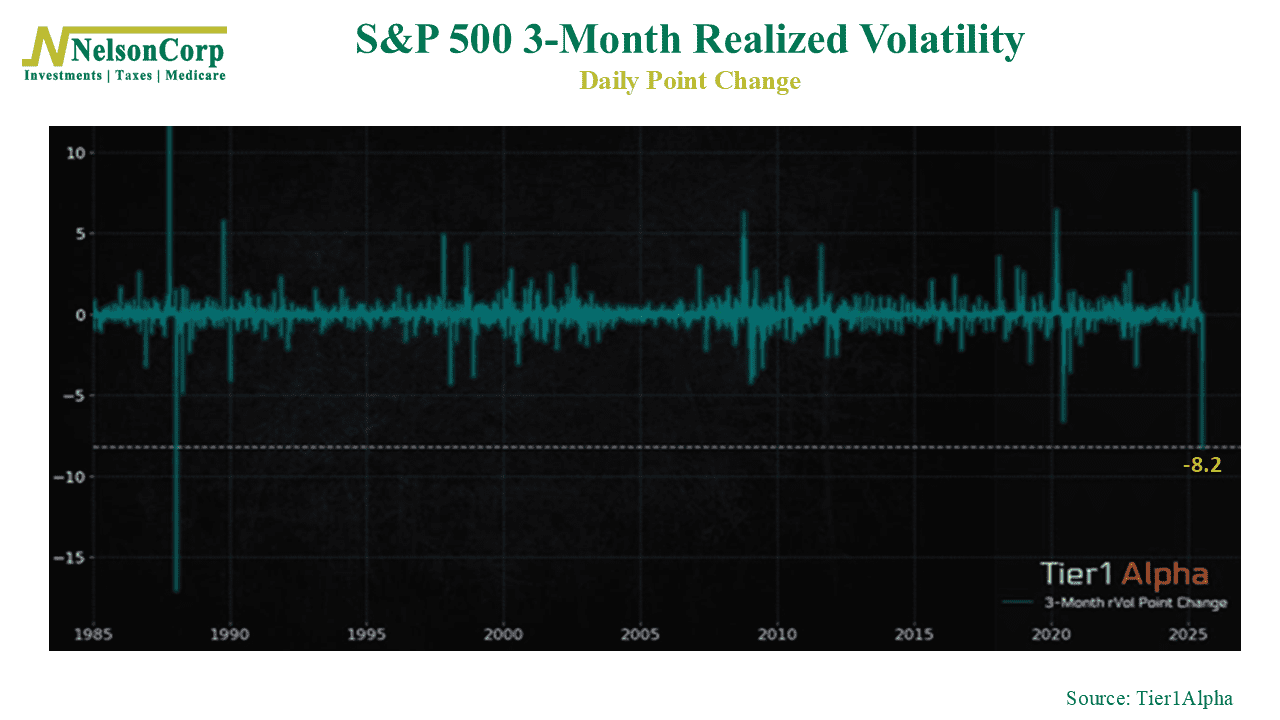
But that’s implied or expected volatility. As for actual volatility, we recently saw the 3-month realized volatility of the S&P 500 fall by 8.2 points. That was its largest single-day decline since 1987. That’s pretty bullish.
So, to put it all together, we see a market exhibiting an extended streak of strength with dropping volatility. That does signal a bit of complacency, but it doesn’t necessarily guarantee a pullback.
For now, our models continue to lean bullish.
This is intended for informational purposes only and should not be used as the primary basis for an investment decision. Consult an advisor for your personal situation.
Indices mentioned are unmanaged, do not incur fees, and cannot be invested into directly.
Past performance does not guarantee future results.
The S&P 500 Index, or Standard & Poor’s 500 Index, is a market-capitalization-weighted index of 500 leading publicly traded companies in the U.S.