
OVERVIEW
KEY CONSIDERATIONS
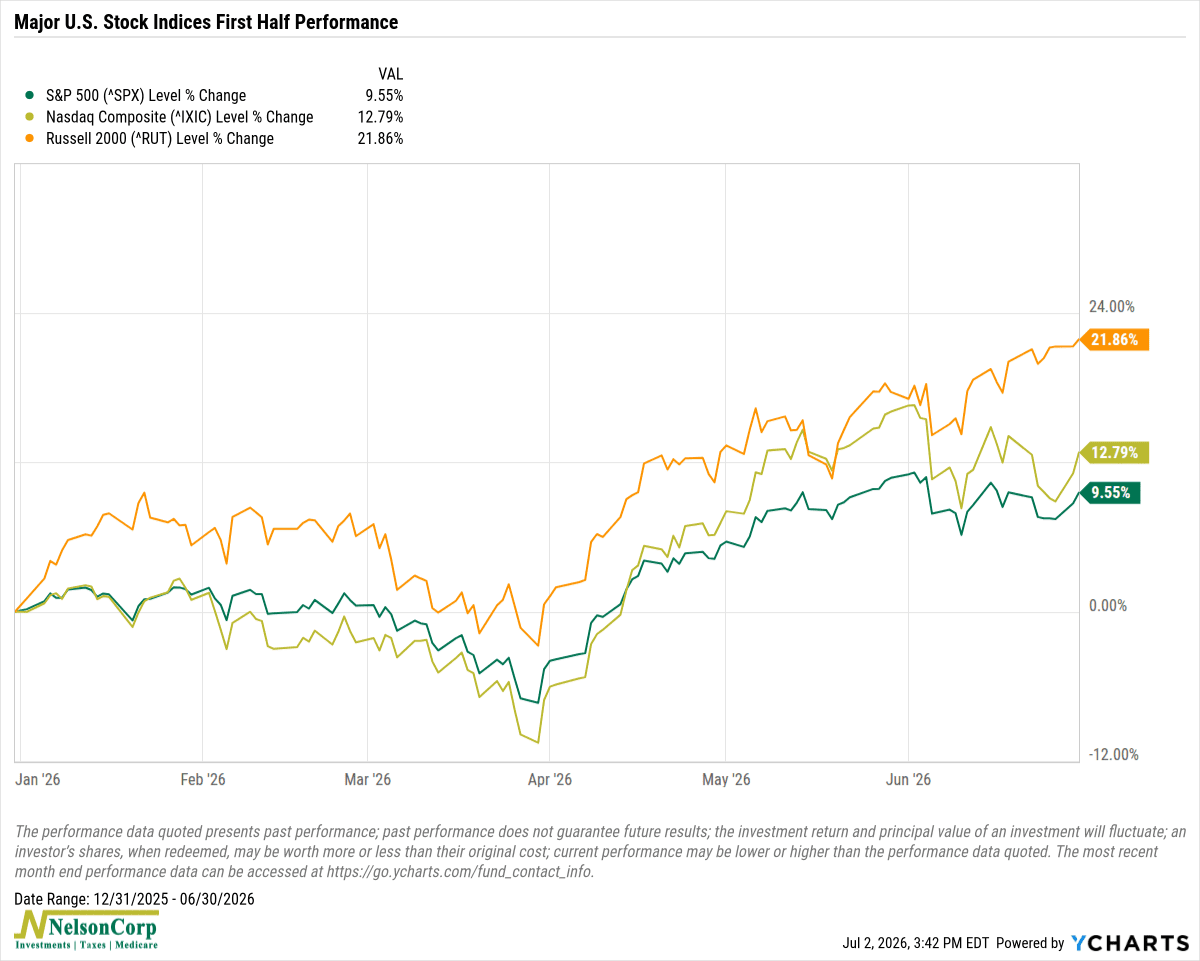
The Best Cycle Is a Non-Cycle – Well, when it was all said and done, it ended up being a pretty good first half for the U.S. stock market. The S&P 500 gained nearly 10%. The Nasdaq rose almost 13%. And small-cap stocks? They surged roughly 22%.
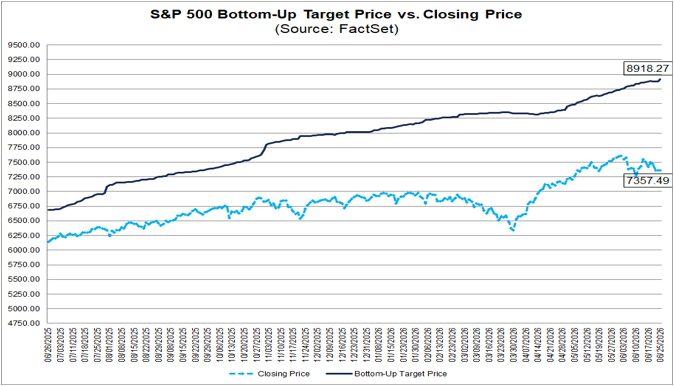
And if you believe the latest FactSet analysis, the market may have more room to run. Their consensus price target calls for the S&P 500 to rally another roughly 20% over the next 12 months, reaching 8,918.
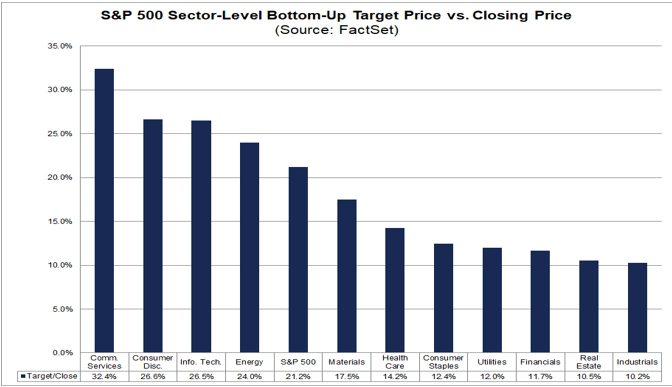
They also expect all 11 sectors to post double-digit gains.
That’s certainly a bullish outlook. Our indicators suggest the same. But while the weight of the evidence still leans positive, we have seen a little bit of deterioration in recent weeks.
For the most part, most of that weakness has come from areas that fall within the Federal Reserve’s domain: interest rates and liquidity.
For example, our Interest Rate Composite, shown below, turned negative a few months ago and continues to weigh on our model.
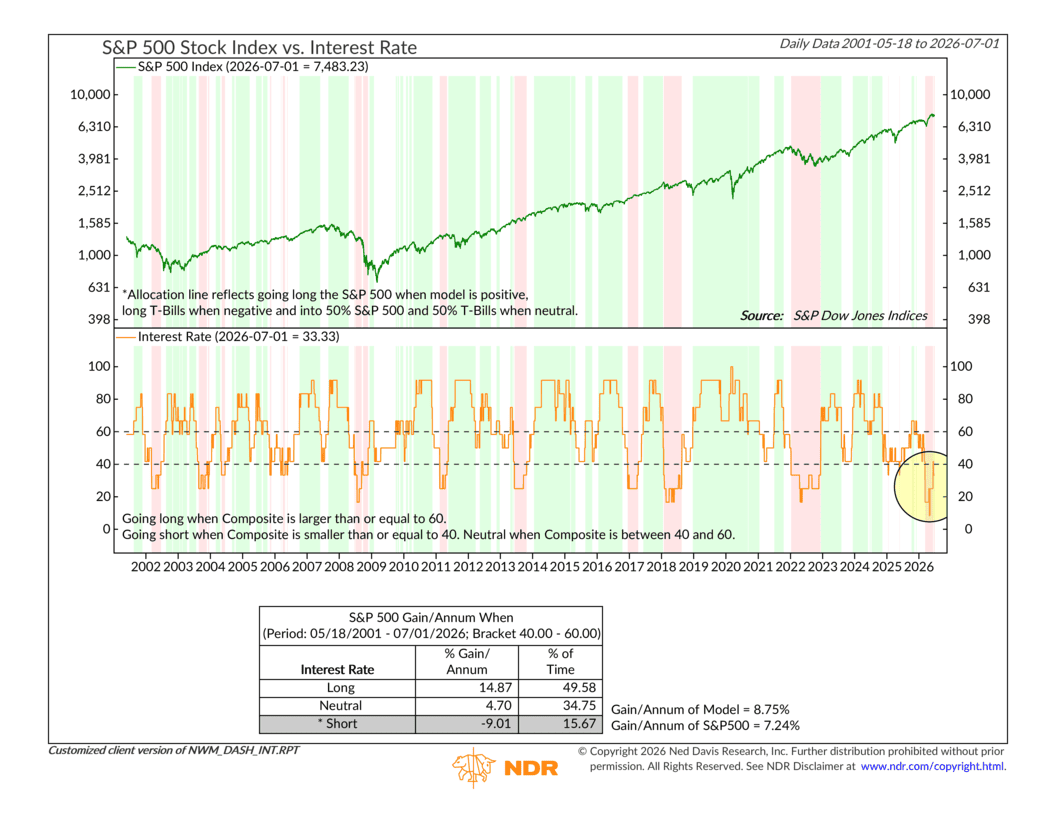
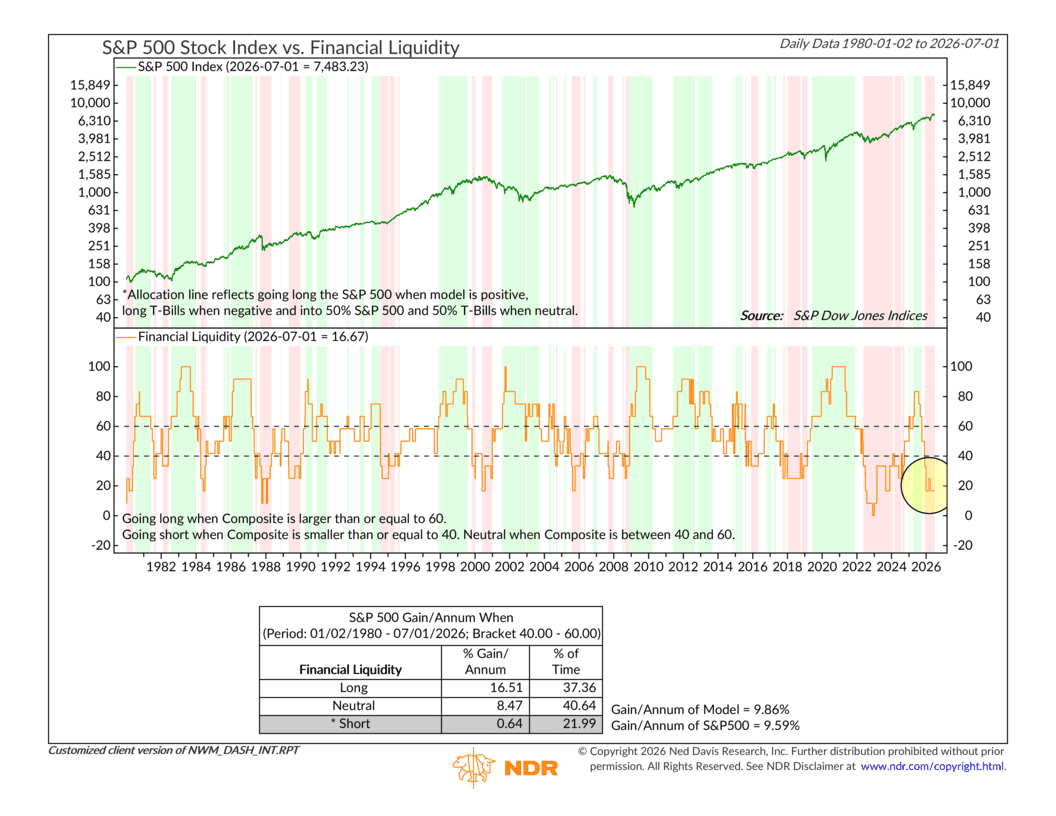
Liquidity has been in a similar position, remaining negative for several months and preventing our overall Economic Model from improving further.
That said, it’s worth remembering that if the Fed does embark on a new tightening cycle soon, these types of cycles don’t always unfold the same way. Sometimes the Fed hikes rates once or twice and then stops, rather than embarking on a long series of increases. We call these “non-cycles.”
Interestingly, history suggests those non-cycles have actually produced the strongest stock market performance. As the chart below shows, the S&P 500 has historically outperformed both fast and slow tightening cycles during the first two years after the initial rate hike.
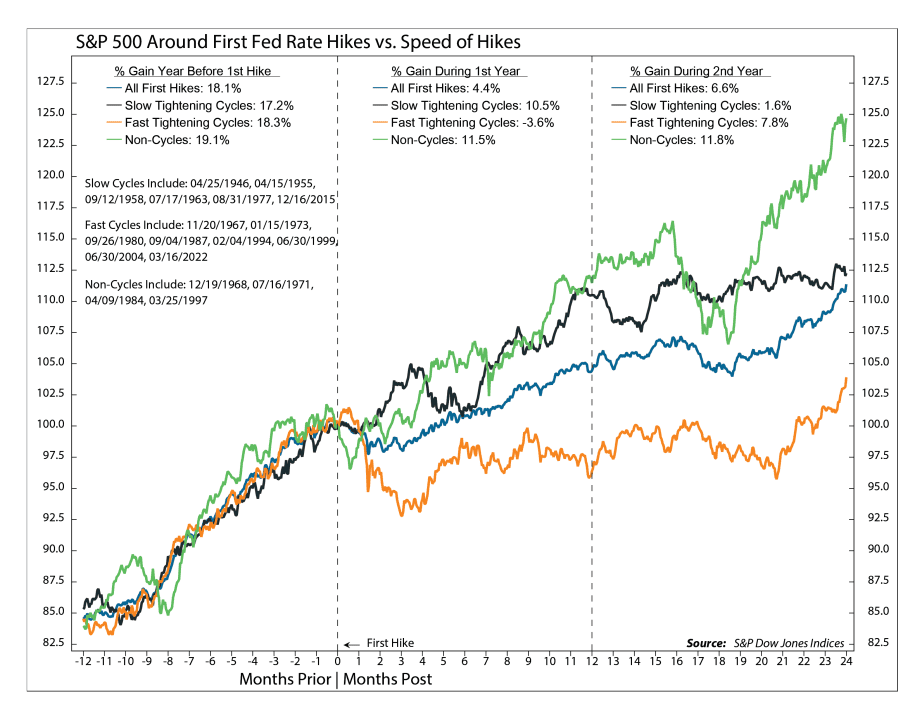
The reason is fairly intuitive: if the Fed only needs a couple of hikes before stepping aside, it’s often because the economy is strong enough to withstand modest tightening without requiring a prolonged battle against inflation.
So, if the Fed does decide to pump the brakes after just one or two hikes, it could actually become another sort of tailwind for stocks in the months ahead.
Of course, no single indicator rules the day, and risks remain. But taken together, the evidence still points toward an environment where the bull market remains intact, even if the path forward ends up being bumpier than what investors enjoyed during the first half of the year.
This is intended for informational purposes only and should not be used as the primary basis for an investment decision. Consult an advisor for your personal situation.
Indices mentioned are unmanaged, do not incur fees, and cannot be invested into directly.
Past performance does not guarantee future results.
The S&P 500 Index, or Standard & Poor’s 500 Index, is a market-capitalization-weighted index of 500 leading publicly traded companies in the U.S.
The Dow Jones Industrial Average (DJIA) is a price-weighted index composed of 30 widely traded blue-chip U.S. common stocks. The Nasdaq 100 Index is a basket of the 100 largest, most actively traded U.S. companies listed on the Nasdaq stock exchange. The index includes companies from various industries except for the financial industry, like commercial and investment banks. The Russell 3000 Index is a capitalization-weighted stock market index that seeks to be a benchmark of the entire U.S. stock market. The S&P MidCap 400 is designed to measure the performance of 400 mid-sized companies, reflecting the distinctive risk and return characteristics of this market segment. S&P 600 Index measures the small-cap segment of the U.S. equity market. The index is designed to track companies that meet specific inclusion criteria to ensure that they are liquid and financially viable. The S&P 100 index is a capitalization-weighted index based on 100 highly capitalized stocks for which options are listed on the CBOE (Chicago Board of Exchange). The MSCI EAFE Index is an equity index which captures large and mid cap representation across 21 Developed Markets countries* around the world, excluding the US and Canada.
The Bloomberg U.S. Corporate Bond Index measures the investment grade, fixed-rate, taxable corporate bond market. The Bloomberg U.S. Corporate High Yield Index is comprised of domestic and corporate bonds rated Ba and below with a minimum outstanding amount of $150 million. The Bloomberg U.S. Municipal Index covers the USD-denominated long-term tax exempt bond market. The index has four main sectors: state and local general obligation bonds, revenue bonds, insured bonds and prerefunded bonds.