OVERVIEW
Markets were mixed last week, with large-cap indexes treading water while mid-caps led the way. The S&P 500 dipped 0.15%, the Dow managed a slight 0.02% gain, and the NASDAQ rose 0.21%. Mid-caps outperformed, with the S&P 400 up 0.61%, while small-caps gained 0.20%. Growth stocks underperformed, with the Russell 3000 Growth index sliding 0.35%.
International stocks struggled. Developed markets (EAFE) fell 1.48%, while emerging markets were flat, down just 0.02%. The U.S. dollar bounced 0.85%, reversing last week’s slide.
Bond markets stayed firm across the curve. Short-, intermediate-, and long-term Treasuries all posted modest gains, up between 0.08% and 0.26%. Investment-grade corporates and high-yield bonds rose 0.28% and 0.29%, respectively, while municipals added 0.08%.
Commodities continued to shine. Oil surged 3.62%, pushing the broader commodity complex up 1.36%. TIPS gained 0.64%, but gold pulled back 1.94% after recent strength. Corn fell 0.70%, and real estate was flat on the week. MLPs dropped 0.88%.
KEY CONSIDERATIONS
The Big Picture – When we talk about modeling risk in the stock market, what we’re really talking about is looking at the big picture. We look at a lot of individual indicators throughout the week, but what we really want to know is: What is the overall message? What direction is the weight of the evidence leaning?
To do that, we combine more than 100 individual indicators into a single model. That model then tells us how the indicators are moving. Are they generally turning more positive? Or more negative?
To visualize that, we use something called the positive-to-negative ratio. It’s pretty simple: we take the number of indicators that are positive and divide it by the number that are negative. The result is shown in the chart below.
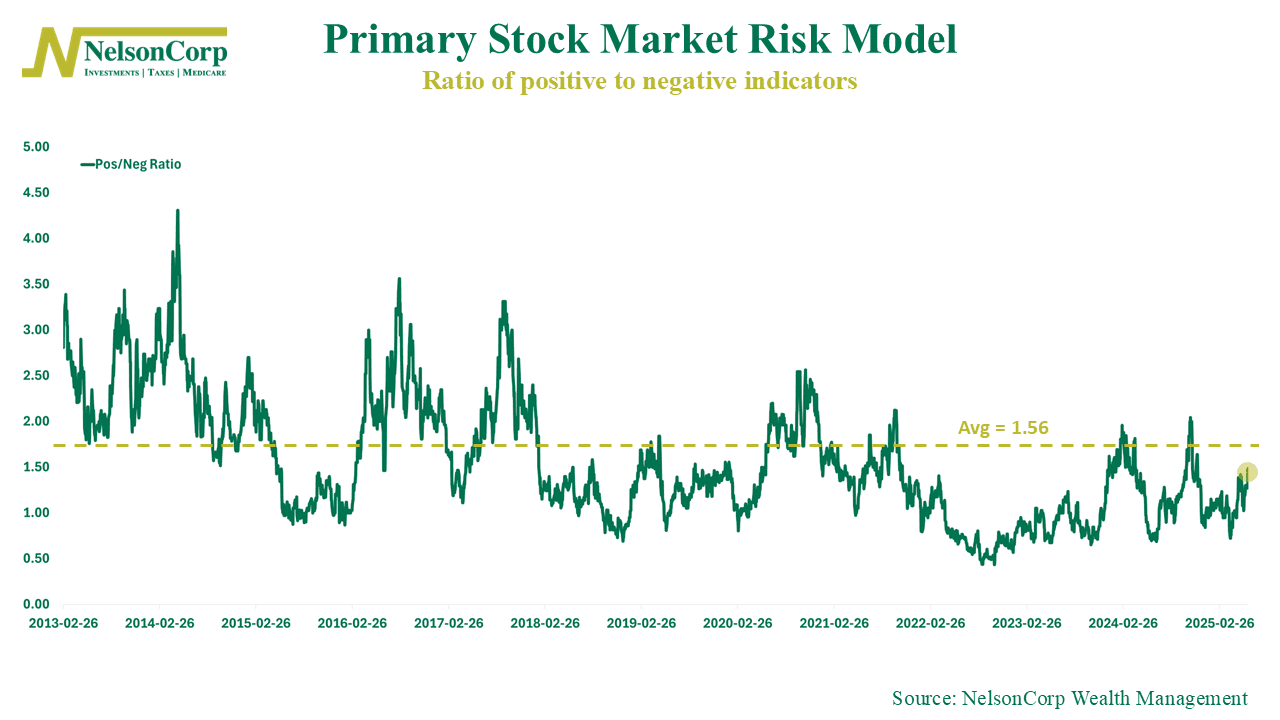
So what’s it telling us? Basically, when the line is moving higher, it means more and more indicators are flipping to positive compared to negative. In other words, the model is strengthening.
Historically, the average positive-to-negative ratio has been around 1.56, meaning for every negative indicator in the model, there are roughly 1 ½ positive ones. Right now, the ratio is 1.48, so we are pretty much near the historical average.
Is that good? Well, based on where we’re coming from, yes! Just a few months ago, that ratio was roughly 0.7. The market was really struggling to gain traction back then. But we’ve since seen a big surge in the number indicators turning positive, and that has coincided with a sustained rally in stock prices.
Here’s another way of looking at the same data. This next chart shows the number of indicators turning positive over the past three months, minus the number turning negative. As you can see, it’s now back into positive territory, further confirming that the weight of the indicator evidence in the model is, indeed, leaning positive.
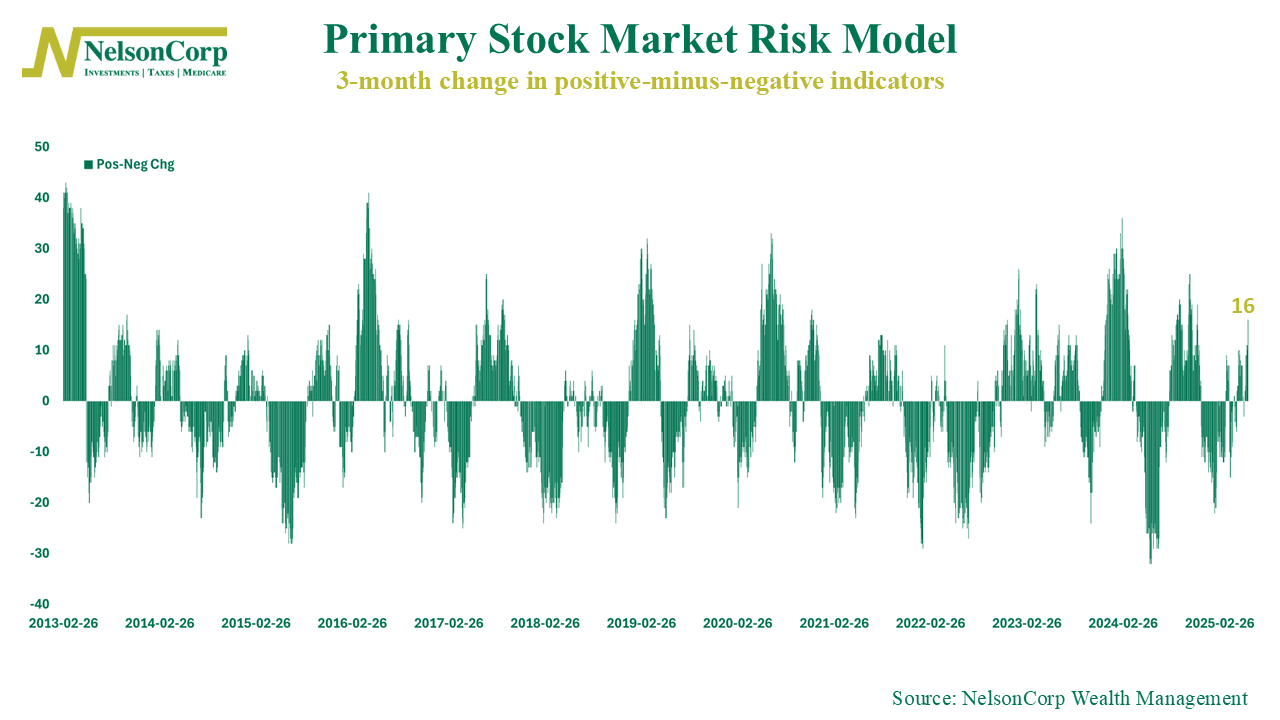
The interesting takeaway from both charts is that, historically, there’s still room for even more indicators to turn positive. So either we’ve got more upside ahead—or we’re already near peak optimism for this cycle. We don’t know that part yet.
But where things stand today, the model is right around its average bullish level—and for now, that’s a pretty good place to be.
This is intended for informational purposes only and should not be used as the primary basis for an investment decision. Consult an advisor for your personal situation.
Indices mentioned are unmanaged, do not incur fees, and cannot be invested into directly.
Past performance does not guarantee future results.
The S&P 500 Index, or Standard & Poor’s 500 Index, is a market-capitalization-weighted index of 500 leading publicly traded companies in the U.S.