OVERVIEW
Markets moved sharply higher last week, with gains across nearly every major equity index. The S&P 500 rose 3.73%, the Dow advanced 3.18%, and the NASDAQ jumped 4.91%. Broader U.S. equities also rallied, with the Russell 3000 up 3.91%. Growth stocks outperformed at 4.41%, while value names gained a solid 3.45%. Large caps were strong as the S&P 100 climbed 3.76%. Mid-caps (S&P 400) added 3.93%, and small caps (S&P 600) saw an even bigger move, rising 4.53%.
International stocks joined the rally. Developed markets (EAFE) gained 3.20%, and emerging markets rose 2.47%, extending what has been a strong year-to-date stretch for global equities.
Bonds posted modest but consistent gains. Short-term Treasuries were nearly flat at 0.05%, while intermediate-term Treasuries rose 0.42% and long-term Treasuries added 0.80%. Investment-grade bonds increased 0.68%, high yield climbed 0.80%, and municipal bonds ticked up 0.25%. TIPS gained 0.22%. Emerging-market debt also strengthened, with USD-denominated bonds up 0.60% and local-currency bonds up 0.96%.
Commodities had a strong week. Broad commodities gained 2.69%, oil rose 2.55%, and gold added 3.37%. Corn increased 2.34%. Real estate advanced 1.98%, and MLPs rose 2.05%. The U.S. dollar slipped 0.63%. Volatility collapsed, with the VIX dropping to 16.25.
KEY CONSIDERATIONS
The Case of the Missing Thrust – We hope everyone enjoyed a great Thanksgiving. The stock market certainly did, posting some pretty solid gains for the holiday-shortened week.
Think back to about a week ago. The S&P 500 sold off and experienced a 5% correction—it’s first since April. But, as you can see below, after last week’s gains, it’s now a hair’s breadth away from new all-time highs.
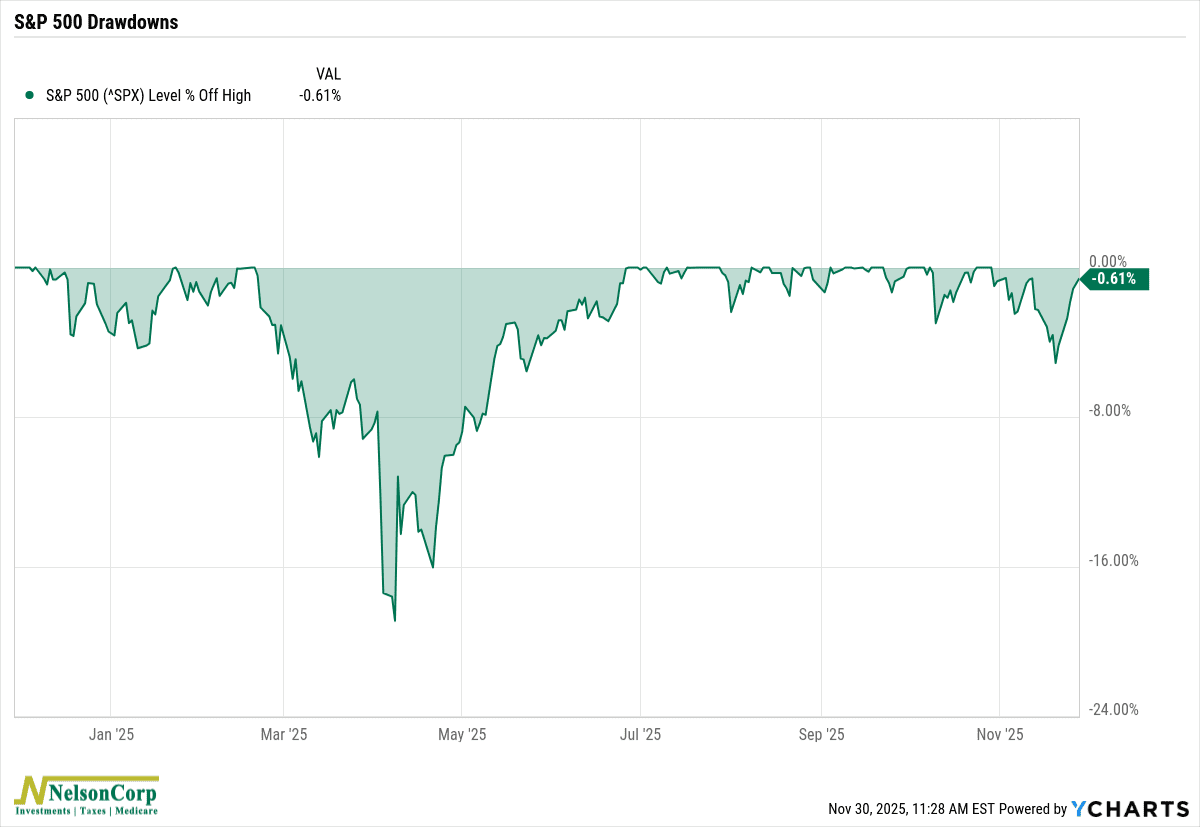
That’s good news. But here’s the thing: in recent years, many (but not all) 5% pullbacks have been followed by breadth thrusts.
What is a breadth thrust? It’s simply when a sudden surge of stocks start rising at the same time, signaling a strong wave of buying across the market.
There are a lot of different ways to measure this. One way to get the big picture view is to simply look at a composite of breadth thrust indicators that combine many of them into one signal. This is shown below. It plots the number of thrust indicators that have “fired” in the last 63 trading days. When it rises to 5 or above (the black dashed line), a positive “buy” signal is generated.
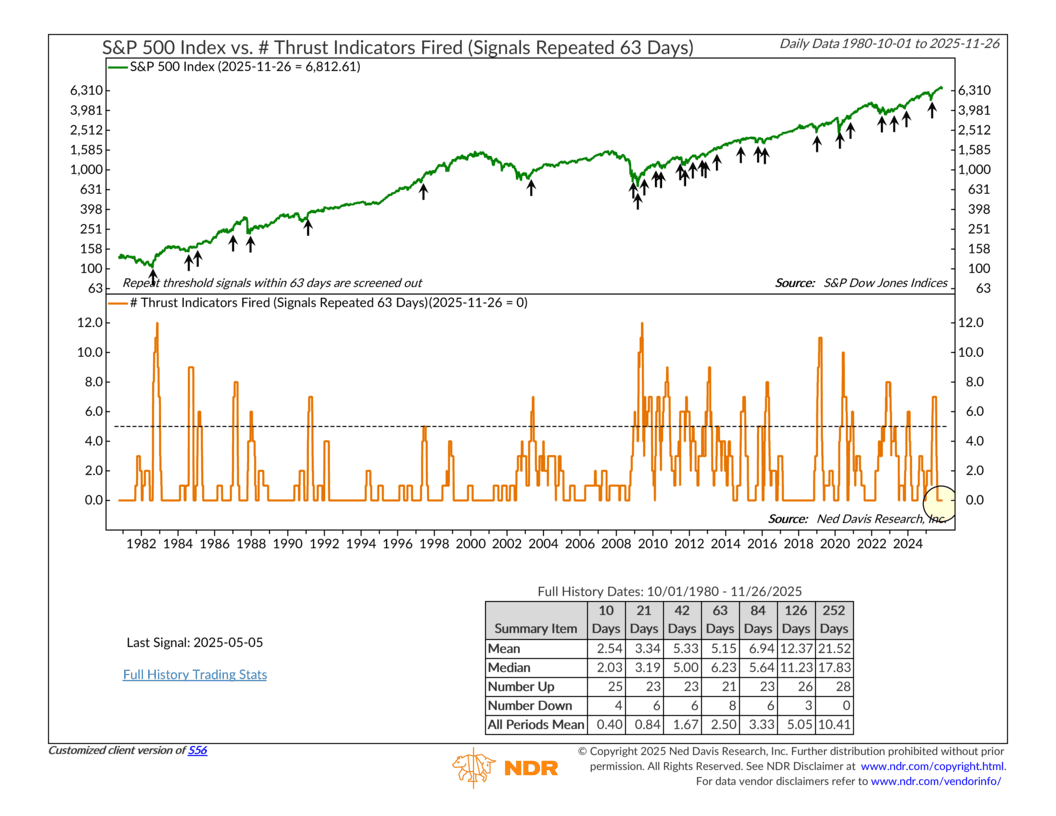
But do you see the problem? Yeah, the current reading is 0%. There have been no breadth thrusts recently, despite the market’s pullback. Does that mean the market can’t climb higher from here? Of course not. But it is a headwind to be aware of—as it could be a sign that a bigger topping process is forming in the market.
The bottom line? The stock market has had a pretty good run this year, on track to return roughly 2.5 times its historic annual average. But without much in the way of breadth thrusts and other positive indicators, the risk-to-reward ratio for going “all-in” on stocks right now is less than optimal.
This is intended for informational purposes only and should not be used as the primary basis for an investment decision. Consult an advisor for your personal situation.
Indices mentioned are unmanaged, do not incur fees, and cannot be invested into directly.
Past performance does not guarantee future results.
The S&P 500 Index, or Standard & Poor’s 500 Index, is a market-capitalization-weighted index of 500 leading publicly traded companies in the U.S.
The Dow Jones Industrial Average (DJIA) is a price-weighted index composed of 30 widely traded blue-chip U.S. common stocks. The Nasdaq 100 Index is a basket of the 100 largest, most actively traded U.S. companies listed on the Nasdaq stock exchange. The index includes companies from various industries except for the financial industry, like commercial and investment banks. The Russell 3000 Index is a capitalization-weighted stock market index that seeks to be a benchmark of the entire U.S. stock market. The S&P MidCap 400 is designed to measure the performance of 400 mid-sized companies, reflecting the distinctive risk and return characteristics of this market segment. S&P 600 Index measures the small-cap segment of the U.S. equity market. The index is designed to track companies that meet specific inclusion criteria to ensure that they are liquid and financially viable. The S&P 100 index is a capitalization-weighted index based on 100 highly capitalized stocks for which options are listed on the CBOE (Chicago Board of Exchange). The MSCI EAFE Index is an equity index which captures large and mid cap representation across 21 Developed Markets countries* around the world, excluding the US and Canada.
The Bloomberg U.S. Corporate Bond Index measures the investment grade, fixed-rate, taxable corporate bond market. The Bloomberg U.S. Corporate High Yield Index is comprised of domestic and corporate bonds rated Ba and below with a minimum outstanding amount of $150 million. The Bloomberg U.S. Municipal Index covers the USD-denominated long-term tax exempt bond market. The index has four main sectors: state and local general obligation bonds, revenue bonds, insured bonds and prerefunded bonds.