OVERVIEW
Markets finished broadly lower last week, with most major equity indexes declining. The S&P 500 fell 1.95%, the Dow slipped 1.91%, and the NASDAQ dropped 2.74%. Across the broader market, the Russell 3000 lost 1.85%, driven by a 2.74% pullback in growth stocks, while value held up better at -0.79%. Large caps also struggled, with the S&P 100 down 2.14%. Mid-caps (S&P 400) declined 0.67%, and small caps (S&P 600) fell 1.09%.
International stocks underperformed U.S. equities. Developed markets (EAFE) dropped 3.41%, and emerging markets slid 3.73%, giving back a portion of their strong year-to-date gains.
Bond markets were mixed. Short-term Treasuries rose 0.09%, intermediate-term Treasuries gained 0.50%, and long-term Treasuries added 0.67%. Investment-grade bonds increased 0.40%, high yield was essentially flat at 0.03%, and municipal bonds ticked up 0.18%. TIPS rose 0.24%. Emerging market bonds were split, with USD-denominated debt up 0.19% and local-currency bonds down 0.45%.
Commodities were soft. Broad commodities fell 1.44%, oil declined 2.91%, and corn slipped 1.46%. Gold dipped 0.33%. Real estate was nearly unchanged at -0.02%, and MLPs eased 0.29%. The U.S. dollar strengthened 1.00%. Volatility spiked sharply, with the VIX jumping 18.15%.
KEY CONSIDERATIONS
The Crowd is Fickle – Some of you may remember reading Shakespeare’s Julius Caesar in high school. If you’re like me, you probably didn’t pay all that much attention to it at the time. But I recently re-read it as an adult and was struck by one of the major themes of the play: how quickly public sentiment turns.
For example, in Act 3, Scene 2 (the funeral orations scene), the crowd goes from loving Caesar, to supporting Brutus, to siding with Antony, all within a few speeches. This reminded me of how public sentiment works today, particularly in the stock market. Investor mood swings widely on headlines, from rate-cute expectations to whatever random narrative dominates that week. The crowd is fickle, brother!
Case in point: check out the indicator below. This is the NDR Daily Trading Sentiment Composite, which combines a range of investor sentiment readings into one measure.
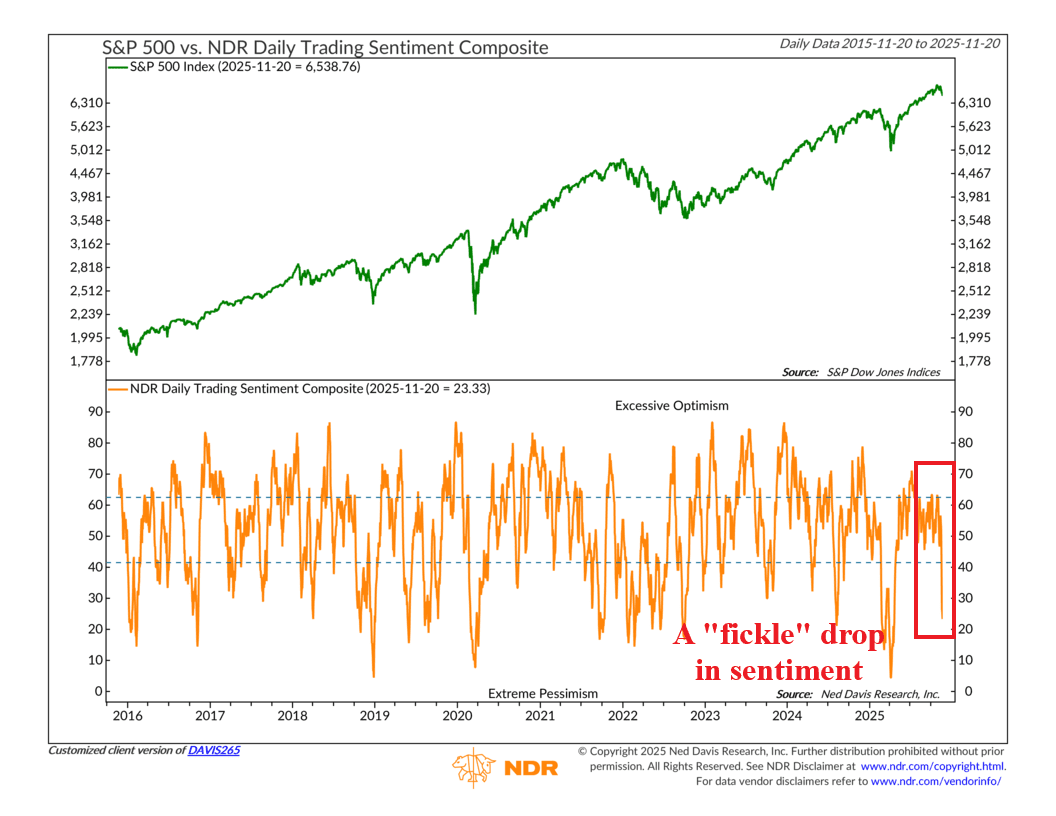
Yeah, you can see how that swings around quite a bit. Going from excessive optimism to extreme pessimism and back again, all in the blink of an eye. In fact, over just the past few weeks, it has dropped from a highly optimistic zone to deeply pessimistic, just like that.
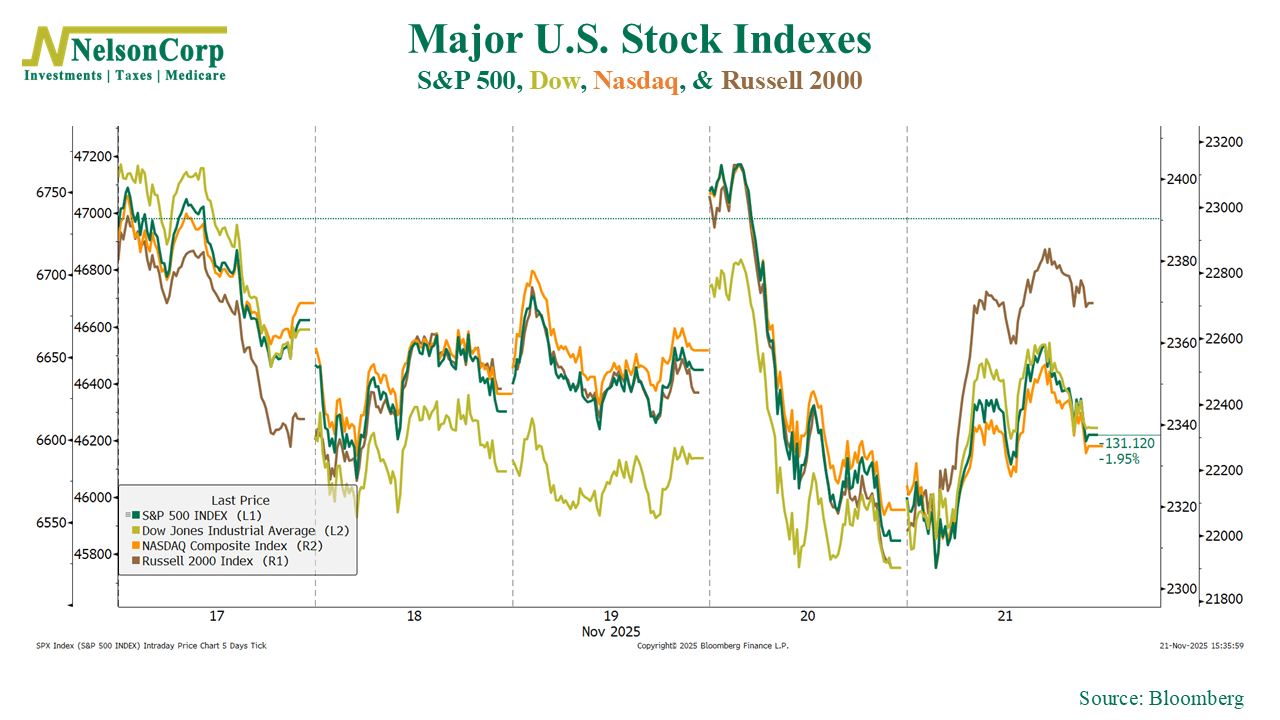
Swings in sentiment like this can and do spill over into the market’s price action. For example, the chart below shows how the major U.S. market indexes performed last week. What really stands out is Thursday’s returns. The market started the day out strong, but then… poof! Just like that, the gains were gone.
The thing is, the market has actually been exhibiting what we call “weak breadth” for some time now. In other words, fewer and fewer stocks participating in the rally. And when breadth is weak like this, large swings in the market become more likely because it means only a handful of stocks are driving the gains; if they crash, so does the market.
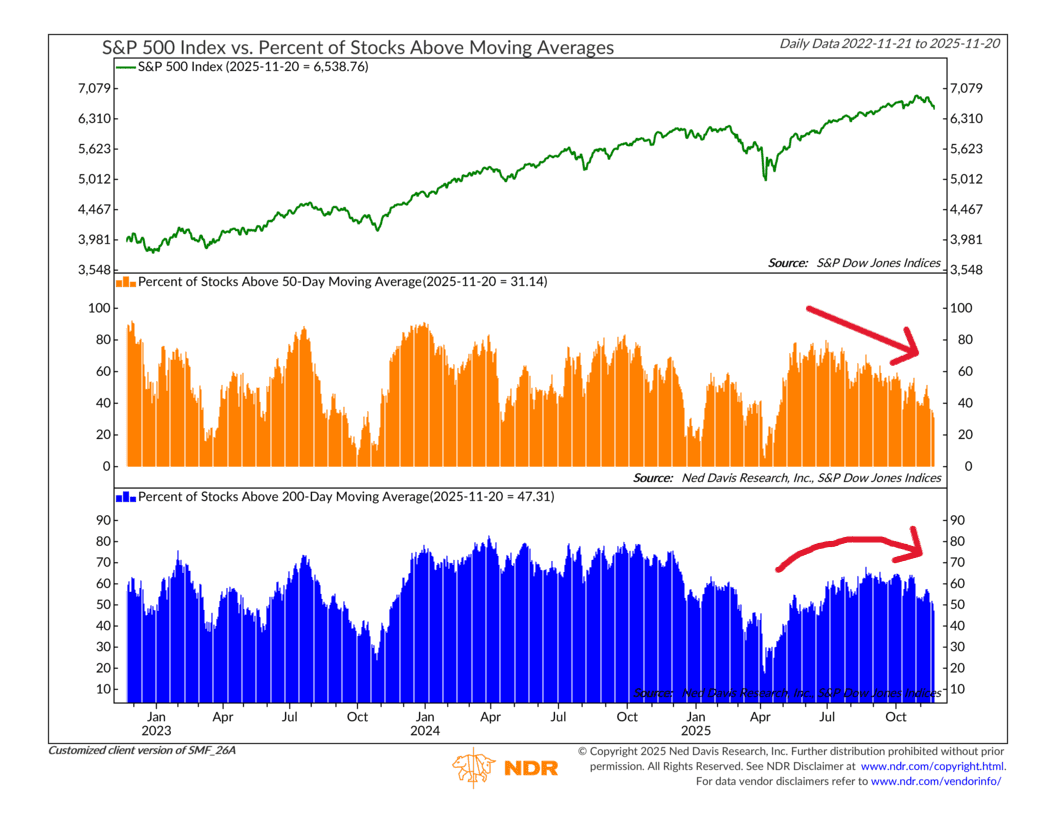
As shown below, the percentage of stocks within the broader S&P 500 Index that are trading above their respective 50-day average prices has dropped from nearly 80% this past summer to just 31% today. Using the longer-term moving average (200 days), the drop has been less severe, but it is rolling over too—which usually isn’t a good sign.
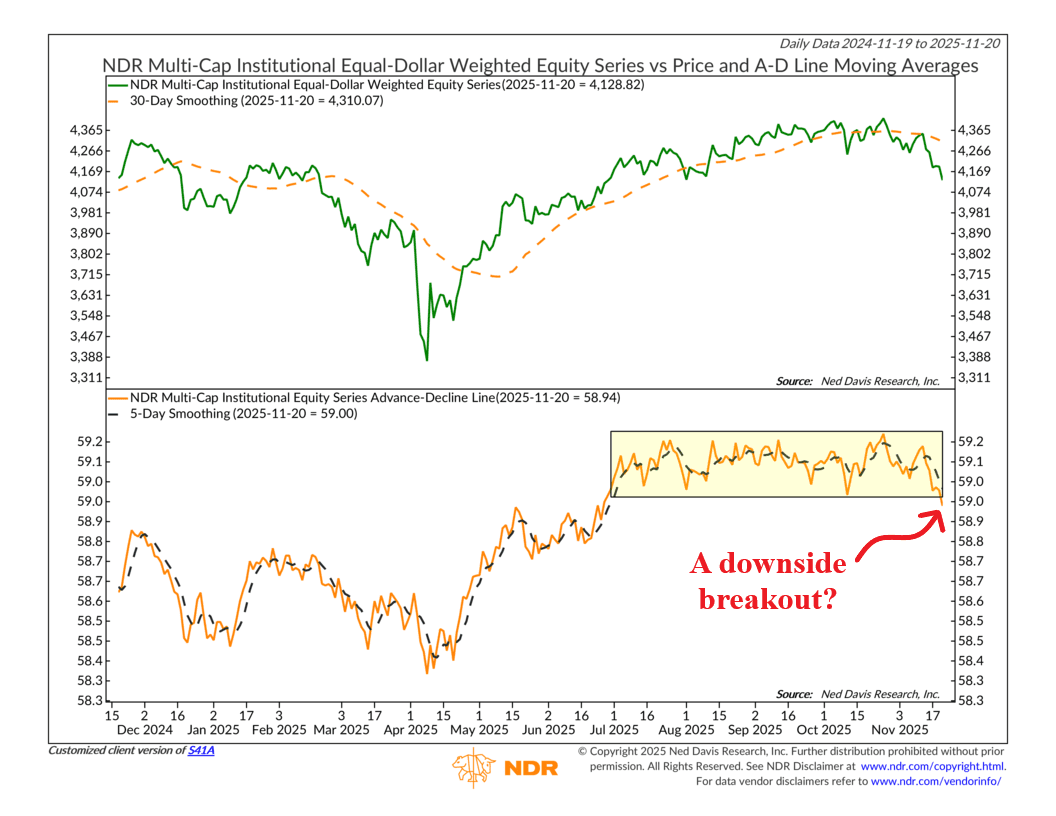
On top of that, this final chart shows that the market’s Advance-Decline line, another tool for measuring the market’s breadth—has been in a trading range for the past 4 months. The good news? It looks like it’s about to break out of that trading range. The bad news? The breakout is to the downside.
So, put it all together and we must say that the market’s intraday reversals and weakening participation look like a crowd that’s becoming more sensitive to downside catalysts. That doesn’t mean a major crash is imminent. But just as Shakespeare’s Romans turned quickly when the mood shifted, investors today seem ready to move at the first sign of trouble. And that suggests it’s wise to be proactive in protecting one’s money.
This is intended for informational purposes only and should not be used as the primary basis for an investment decision. Consult an advisor for your personal situation.
Indices mentioned are unmanaged, do not incur fees, and cannot be invested into directly.
Past performance does not guarantee future results.
The S&P 500 Index, or Standard & Poor’s 500 Index, is a market-capitalization-weighted index of 500 leading publicly traded companies in the U.S.
The Dow Jones Industrial Average (DJIA) is a price-weighted index composed of 30 widely traded blue-chip U.S. common stocks. The Nasdaq 100 Index is a basket of the 100 largest, most actively traded U.S. companies listed on the Nasdaq stock exchange. The index includes companies from various industries except for the financial industry, like commercial and investment banks. The Russell 3000 Index is a capitalization-weighted stock market index that seeks to be a benchmark of the entire U.S. stock market. The S&P MidCap 400 is designed to measure the performance of 400 mid-sized companies, reflecting the distinctive risk and return characteristics of this market segment. S&P 600 Index measures the small-cap segment of the U.S. equity market. The index is designed to track companies that meet specific inclusion criteria to ensure that they are liquid and financially viable. The S&P 100 index is a capitalization-weighted index based on 100 highly capitalized stocks for which options are listed on the CBOE (Chicago Board of Exchange). The MSCI EAFE Index is an equity index which captures large and mid cap representation across 21 Developed Markets countries* around the world, excluding the US and Canada.
The Bloomberg U.S. Corporate Bond Index measures the investment grade, fixed-rate, taxable corporate bond market. The Bloomberg U.S. Corporate High Yield Index is comprised of domestic and corporate bonds rated Ba and below with a minimum outstanding amount of $150 million. The Bloomberg U.S. Municipal Index covers the USD-denominated long-term tax exempt bond market. The index has four main sectors: state and local general obligation bonds, revenue bonds, insured bonds and prerefunded bonds.