OVERVIEW
KEY CONSIDERATIONS
The Heavy Lifting – There are a lot of reasons investors give for why stocks are climbing. AI. Interest rates. Sentiment. Pick your favorite.
But if I could only point to one thing, it would be earnings.
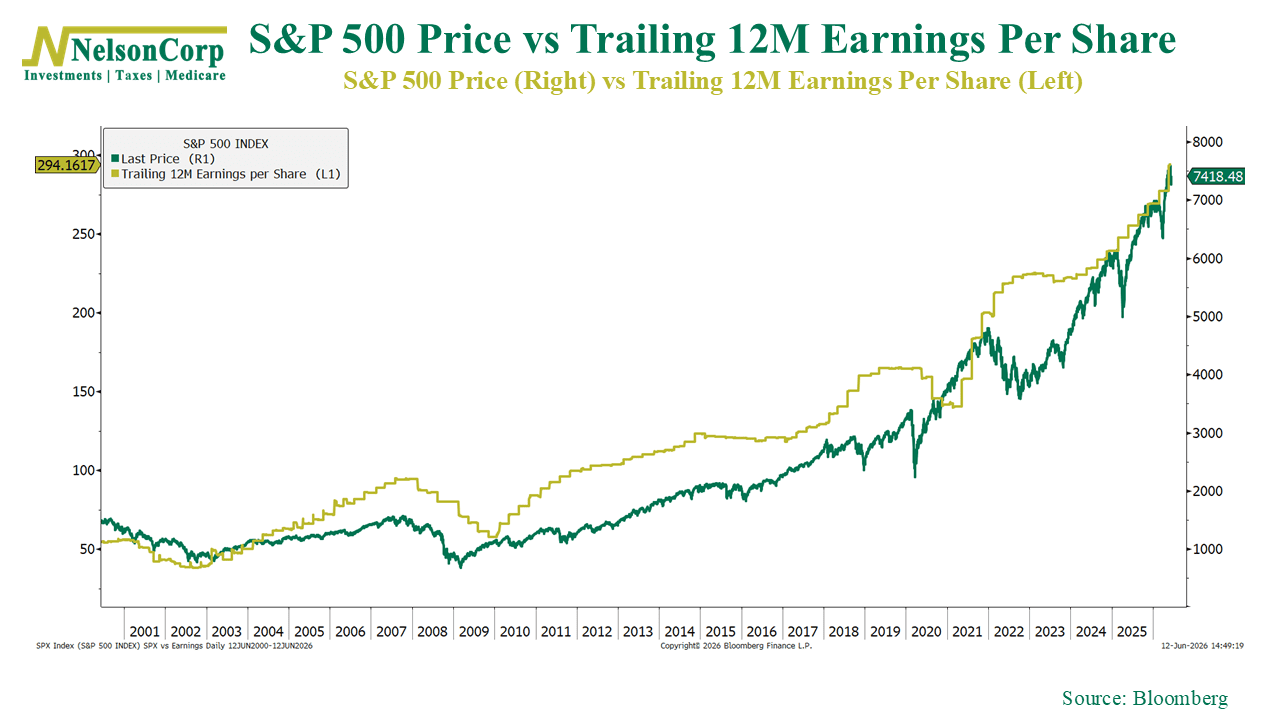
The chart above shows why. Since 2000, the S&P 500 has closely tracked the growth in corporate earnings. Sure, over shorter periods, stock prices can sometimes get ahead of (or behind) earnings. But over time, earnings are what clearly matter the most. You could say they do the heavy lifting.
And right now, earnings are looking strong.
What’s especially impressive is that profit growth hasn’t been limited to just a handful of mega-cap technology companies. While the AI spending boom has certainly helped, we’ve also seen strong earnings from areas like Financials, Health Care, Industrials, and Communication Services.
A lot of that has to do with the economic backdrop, which is helping too.
Our second chart shows the ISM Composite Index, which combines data from both the manufacturing and services sectors. Historically, when the ISM Composite is above 53.8, the S&P 500 has produced annualized returns of 9.4%. When it falls below 50.8, returns have averaged just 4.5%.
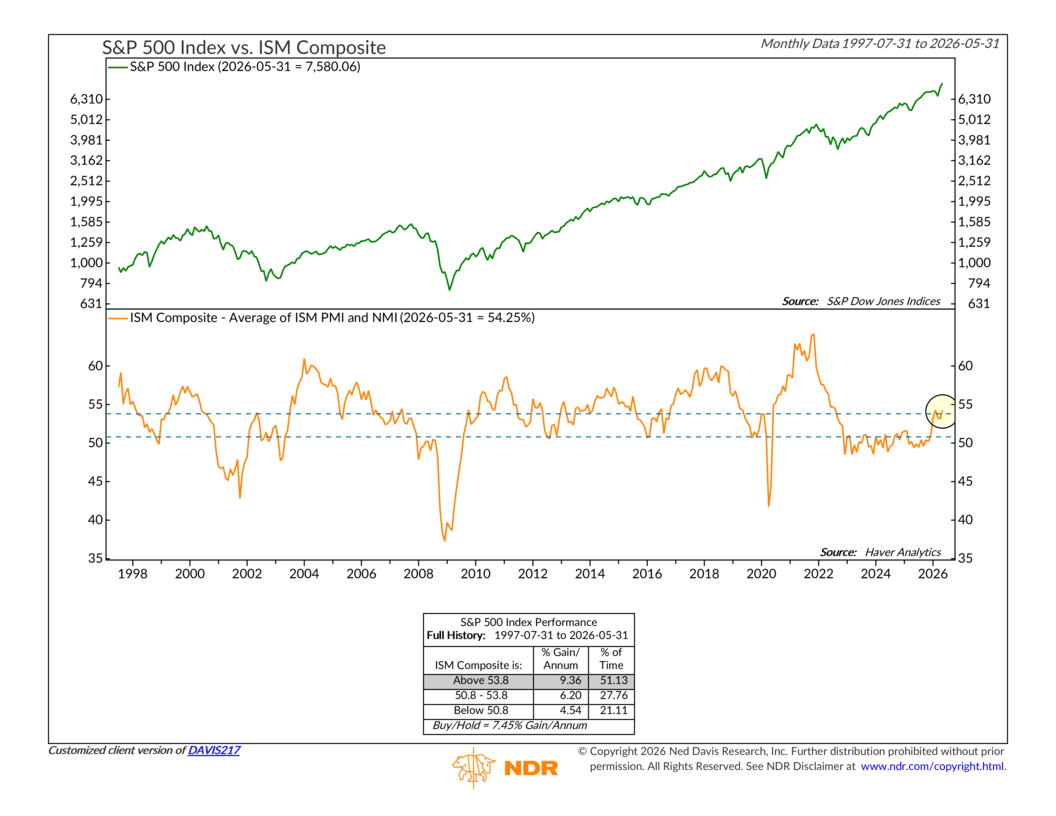
Today, the ISM Composite sits at 54.3, putting it firmly in the stronger-growth zone. In other words, the economy is still expanding, businesses are still generating profits, and investors are continuing to reward that growth.
Could we see pullbacks along the way? Sure, of course. We expect them. Markets never move in a straight line.
But as long as earnings keep growing and economic activity remains healthy, it’s hard to build a convincing bearish case.
Bottom line: The stock market’s gains are being driven by optimism (AI, in particular). But they’re also being supported by something much more important: rising profits and a growing economy. That’s still a pretty good combination for investors.
This is intended for informational purposes only and should not be used as the primary basis for an investment decision. Consult an advisor for your personal situation.
Indices mentioned are unmanaged, do not incur fees, and cannot be invested into directly.
Past performance does not guarantee future results.
The S&P 500 Index, or Standard & Poor’s 500 Index, is a market-capitalization-weighted index of 500 leading publicly traded companies in the U.S.
The Dow Jones Industrial Average (DJIA) is a price-weighted index composed of 30 widely traded blue-chip U.S. common stocks. The Nasdaq 100 Index is a basket of the 100 largest, most actively traded U.S. companies listed on the Nasdaq stock exchange. The index includes companies from various industries except for the financial industry, like commercial and investment banks. The Russell 3000 Index is a capitalization-weighted stock market index that seeks to be a benchmark of the entire U.S. stock market. The S&P MidCap 400 is designed to measure the performance of 400 mid-sized companies, reflecting the distinctive risk and return characteristics of this market segment. S&P 600 Index measures the small-cap segment of the U.S. equity market. The index is designed to track companies that meet specific inclusion criteria to ensure that they are liquid and financially viable. The S&P 100 index is a capitalization-weighted index based on 100 highly capitalized stocks for which options are listed on the CBOE (Chicago Board of Exchange). The MSCI EAFE Index is an equity index which captures large and mid cap representation across 21 Developed Markets countries* around the world, excluding the US and Canada.
The Bloomberg U.S. Corporate Bond Index measures the investment grade, fixed-rate, taxable corporate bond market. The Bloomberg U.S. Corporate High Yield Index is comprised of domestic and corporate bonds rated Ba and below with a minimum outstanding amount of $150 million. The Bloomberg U.S. Municipal Index covers the USD-denominated long-term tax exempt bond market. The index has four main sectors: state and local general obligation bonds, revenue bonds, insured bonds and prerefunded bonds.