
OVERVIEW
KEY CONSIDERATIONS
The Higher the Hurdle – The bond market took center stage this week.
Long-term Treasury yields pushed higher, with the 30-year yield reaching levels not seen in nearly two decades. That put some pressure on stocks. And it raised a question that investors have been asking a lot lately: how high can interest rates go before they finally become too much?
Well, there probably isn’t one magic number.
Higher interest rates can create problems for stocks in several ways. They increase borrowing costs for businesses and consumers, make bonds more competitive with stocks and put pressure on valuations. The higher yields go, the more investors can earn without taking on the additional risk that comes with owning stocks.
That means the hurdle for stocks gets higher too.
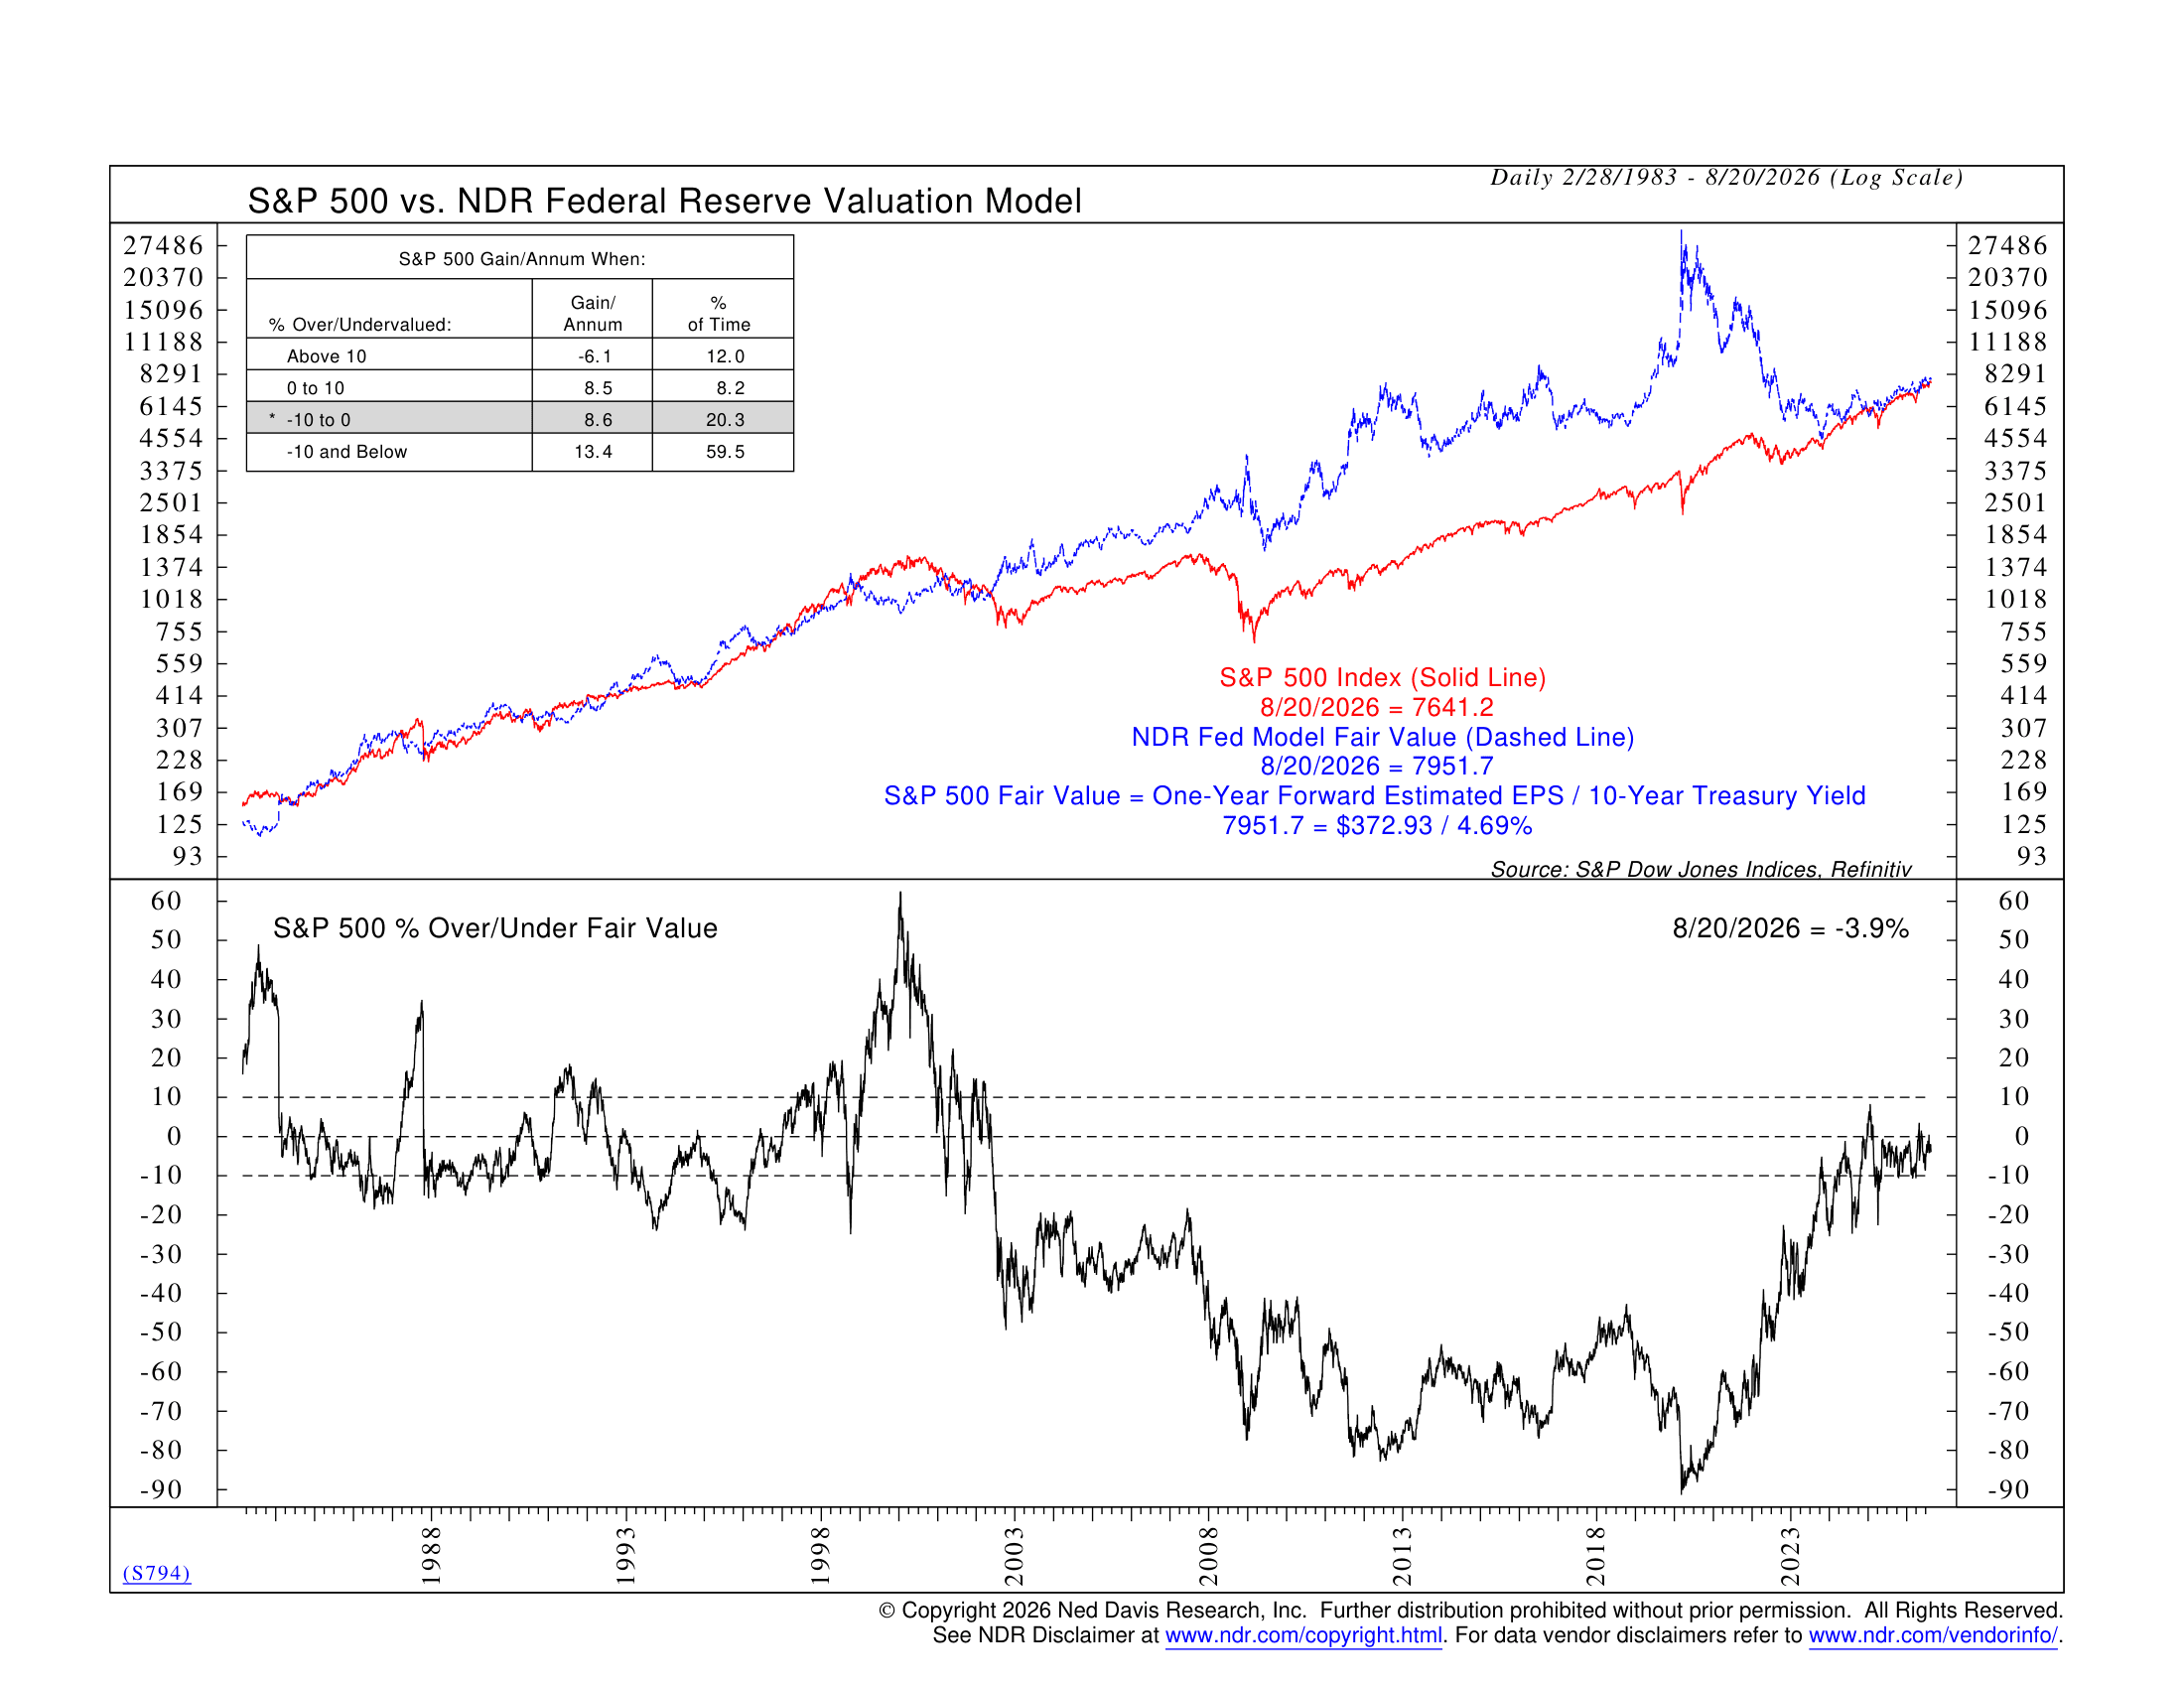
This first chart helps put that relationship into perspective. NDR’s Federal Reserve Valuation Model compares the earnings yield on stocks with the yield available on the 10-year Treasury.
With the 10-year Treasury yield recently around 4.7%, you might expect stocks to look expensive by comparison. Surprisingly, that isn’t what the model is showing.
Based on current interest rates and earnings, the model estimates fair value for the S&P 500 at roughly 7,900, which is above the index’s current level. In other words, despite higher bond yields and stocks trading near record highs, the market still looks roughly fairly valued by this measure.
A big reason for that can be found in the earnings picture.
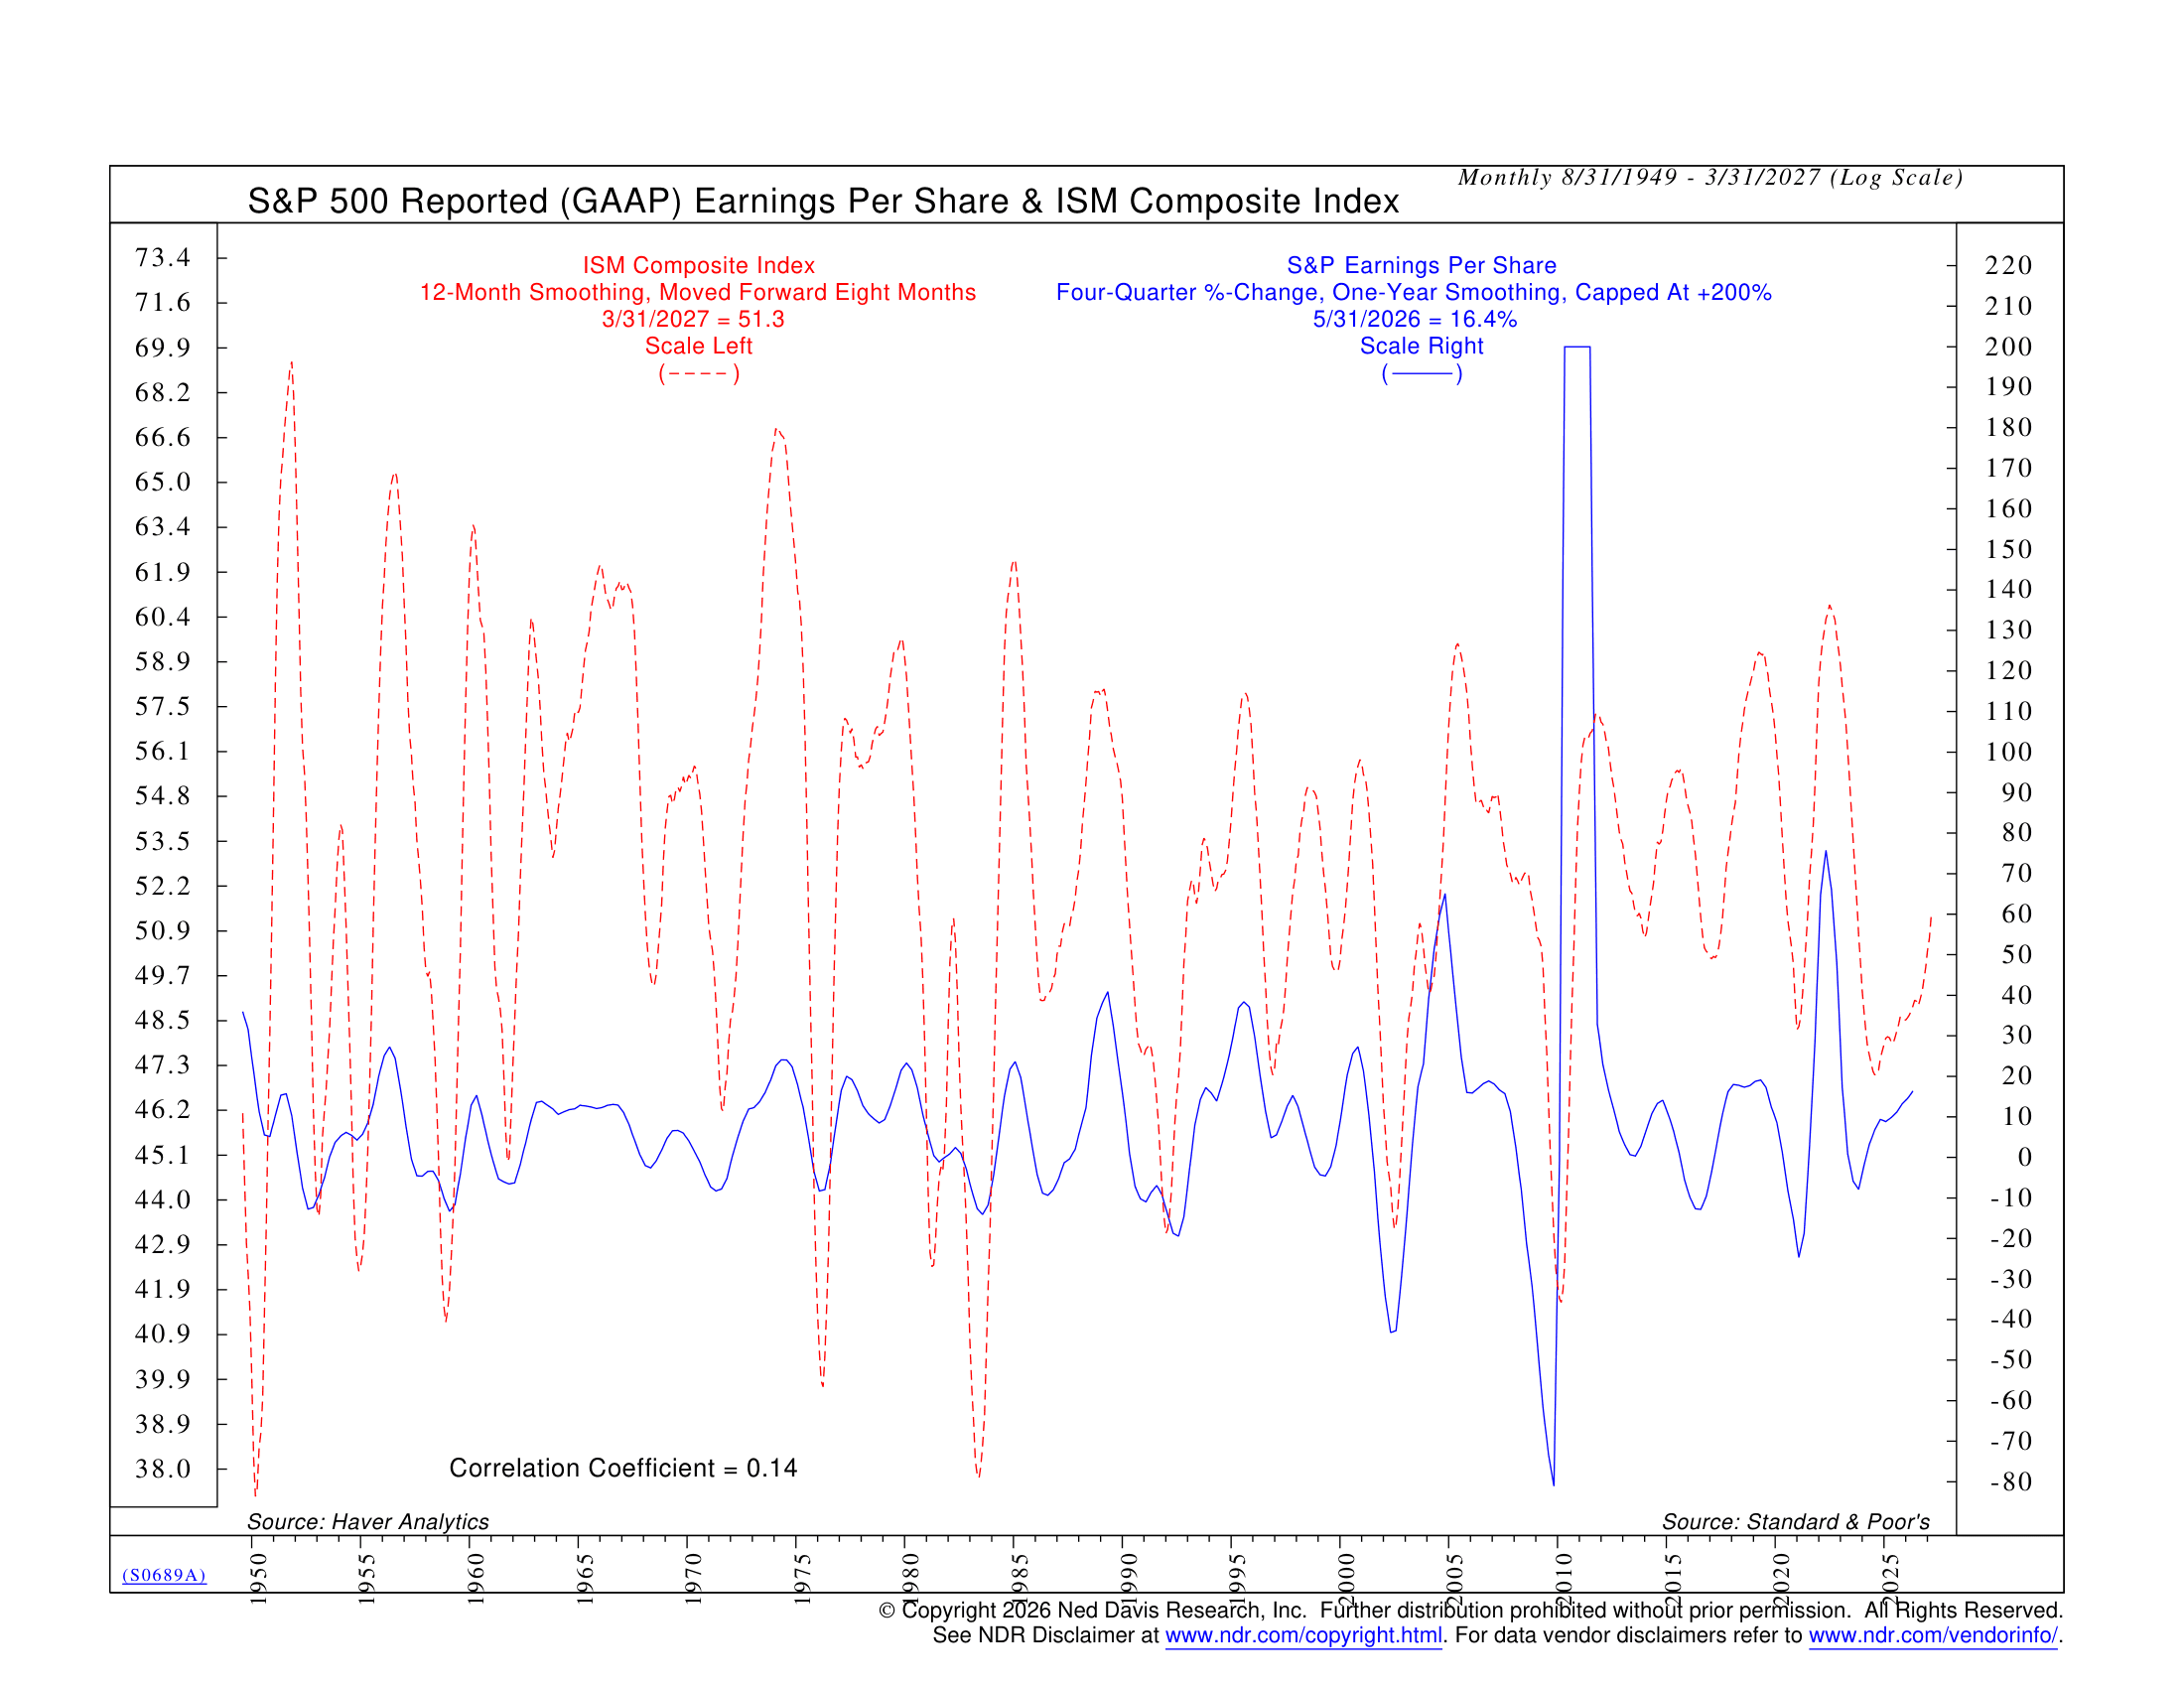
This second chart compares economic activity, measured by the ISM Composite Index, with year-over-year growth in S&P 500 reported earnings.
Corporate earnings are currently growing at a healthy pace, with reported S&P 500 earnings up 16.4% over the past year. Meanwhile, the smoothed ISM Composite remains above 50, the dividing line between economic expansion and contraction.
That combination helps explain why stocks have been able to withstand higher interest rates so far.
Higher yields are certainly a headwind. But interest rates are only one part of the valuation equation. If the economy continues to expand and corporate earnings continue to grow, stocks can absorb a higher level of rates than they otherwise could.
The risk would be if those two forces began moving in the wrong direction at the same time.
If long-term yields continue climbing while earnings growth begins to weaken, today’s valuation picture could change quickly. Stocks would face a higher hurdle from the bond market at the same time the fundamental support underneath them was fading.
For now, though, that isn’t what the evidence is showing.
The bond market deserves our attention, especially after this week’s jump in long-term yields. But higher rates alone don’t necessarily end a bull market. What matters is whether economic and earnings growth remain strong enough to offset them.
So far, they have.
But the higher yields go, the higher the hurdle becomes.
This is intended for informational purposes only and should not be used as the primary basis for an investment decision. Consult an advisor for your personal situation.
Indices mentioned are unmanaged, do not incur fees, and cannot be invested into directly.
Past performance does not guarantee future results.
The S&P 500 Index, or Standard & Poor’s 500 Index, is a market-capitalization-weighted index of 500 leading publicly traded companies in the U.S.
The Dow Jones Industrial Average (DJIA) is a price-weighted index composed of 30 widely traded blue-chip U.S. common stocks. The Nasdaq 100 Index is a basket of the 100 largest, most actively traded U.S. companies listed on the Nasdaq stock exchange. The index includes companies from various industries except for the financial industry, like commercial and investment banks. The Russell 3000 Index is a capitalization-weighted stock market index that seeks to be a benchmark of the entire U.S. stock market. The S&P MidCap 400 is designed to measure the performance of 400 mid-sized companies, reflecting the distinctive risk and return characteristics of this market segment. S&P 600 Index measures the small-cap segment of the U.S. equity market. The index is designed to track companies that meet specific inclusion criteria to ensure that they are liquid and financially viable. The S&P 100 index is a capitalization-weighted index based on 100 highly capitalized stocks for which options are listed on the CBOE (Chicago Board of Exchange). The MSCI EAFE Index is an equity index which captures large and mid cap representation across 21 Developed Markets countries* around the world, excluding the US and Canada.
The Bloomberg U.S. Corporate Bond Index measures the investment grade, fixed-rate, taxable corporate bond market. The Bloomberg U.S. Corporate High Yield Index is comprised of domestic and corporate bonds rated Ba and below with a minimum outstanding amount of $150 million. The Bloomberg U.S. Municipal Index covers the USD-denominated long-term tax exempt bond market. The index has four main sectors: state and local general obligation bonds, revenue bonds, insured bonds and prerefunded bonds.