OVERVIEW
KEY CONSIDERATIONS
The Waste Land – In the post–World War I backdrop of the poem The Waste Land, T. S. Eliot famously described April as the “cruelest month.” But in the financial world, April was anything but cruel for the stock market.
The S&P 500 index—our standard benchmark for large U.S. stocks—rose over 10% last month.
The tech-heavy Nasdaq-100 did even better, surging nearly 16%.
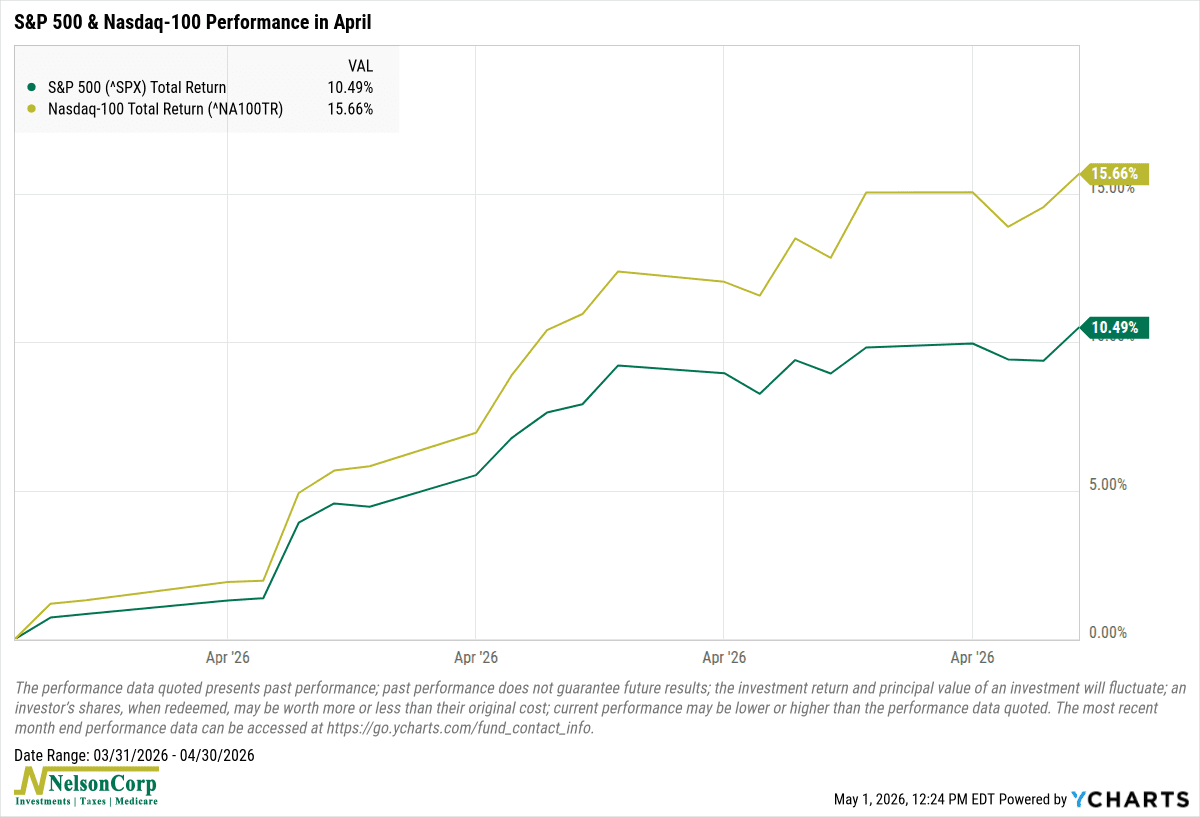
Taken together, that was the best monthly performance for the U.S. stock market since the post-covid rally in November 2020.
But of course, April was still cruel in other ways. Take “the wasteland” at the gas pump, for example. As you very well probably know, the average price of gasoline in the Midwest is around $3.90/gallon right now.
If we take that and divide it by average hourly earnings, we get the following chart, showing the ratio of the average price per gallon of gasoline to average hourly earnings. The higher the line, the more expensive gas is relative to wages.
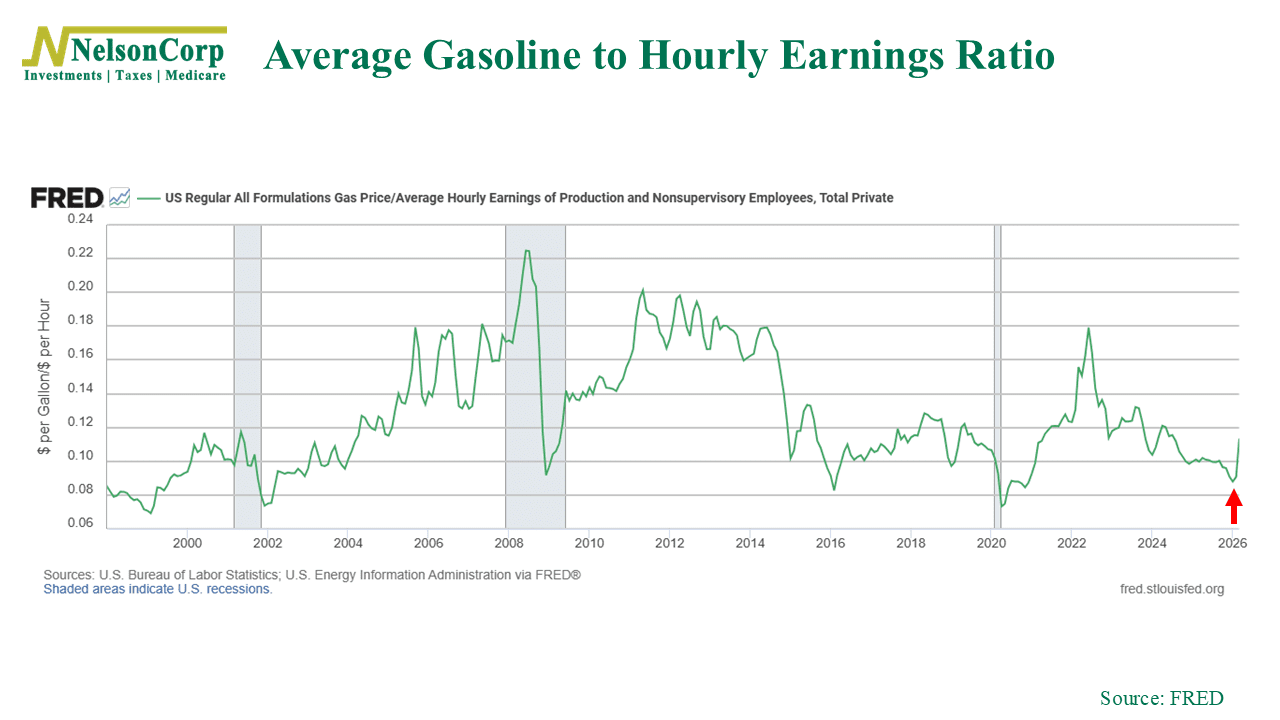
As you can see, it went straight up last month. Before the war, a middle-wage earner could get about 11 gallons of gas for an hour of work. Now, an hour of work gets them around 8 gallons.
That’s mildly annoying, to say the least. But what does that mean for inflation overall?
Well, according to our Inflation Composite, inflation is not necessarily a problem for the stock market—at this moment, at least. At a high level, a narrow majority of the indicators comprising the composite are still in bullish (low inflation) states.
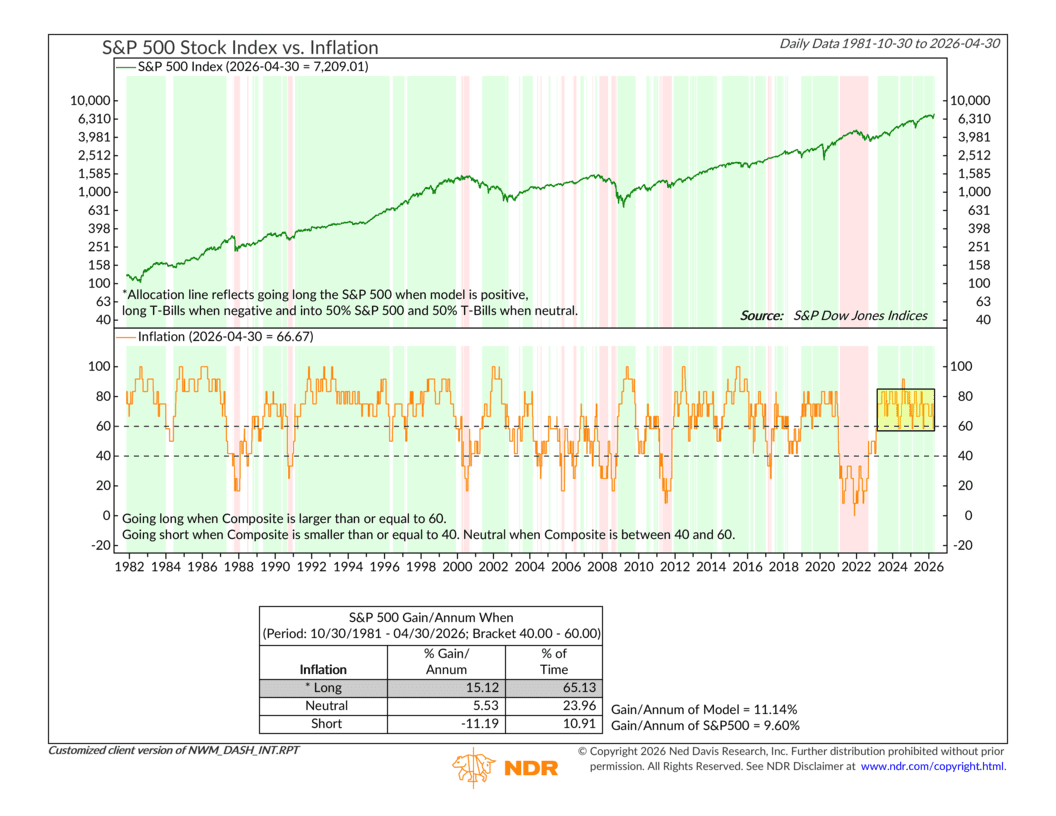
In fact, as you probably noticed, the inflation composite has been scooting along in the bullish zone since 2023—which helps explain why stock have done so well in recent years.
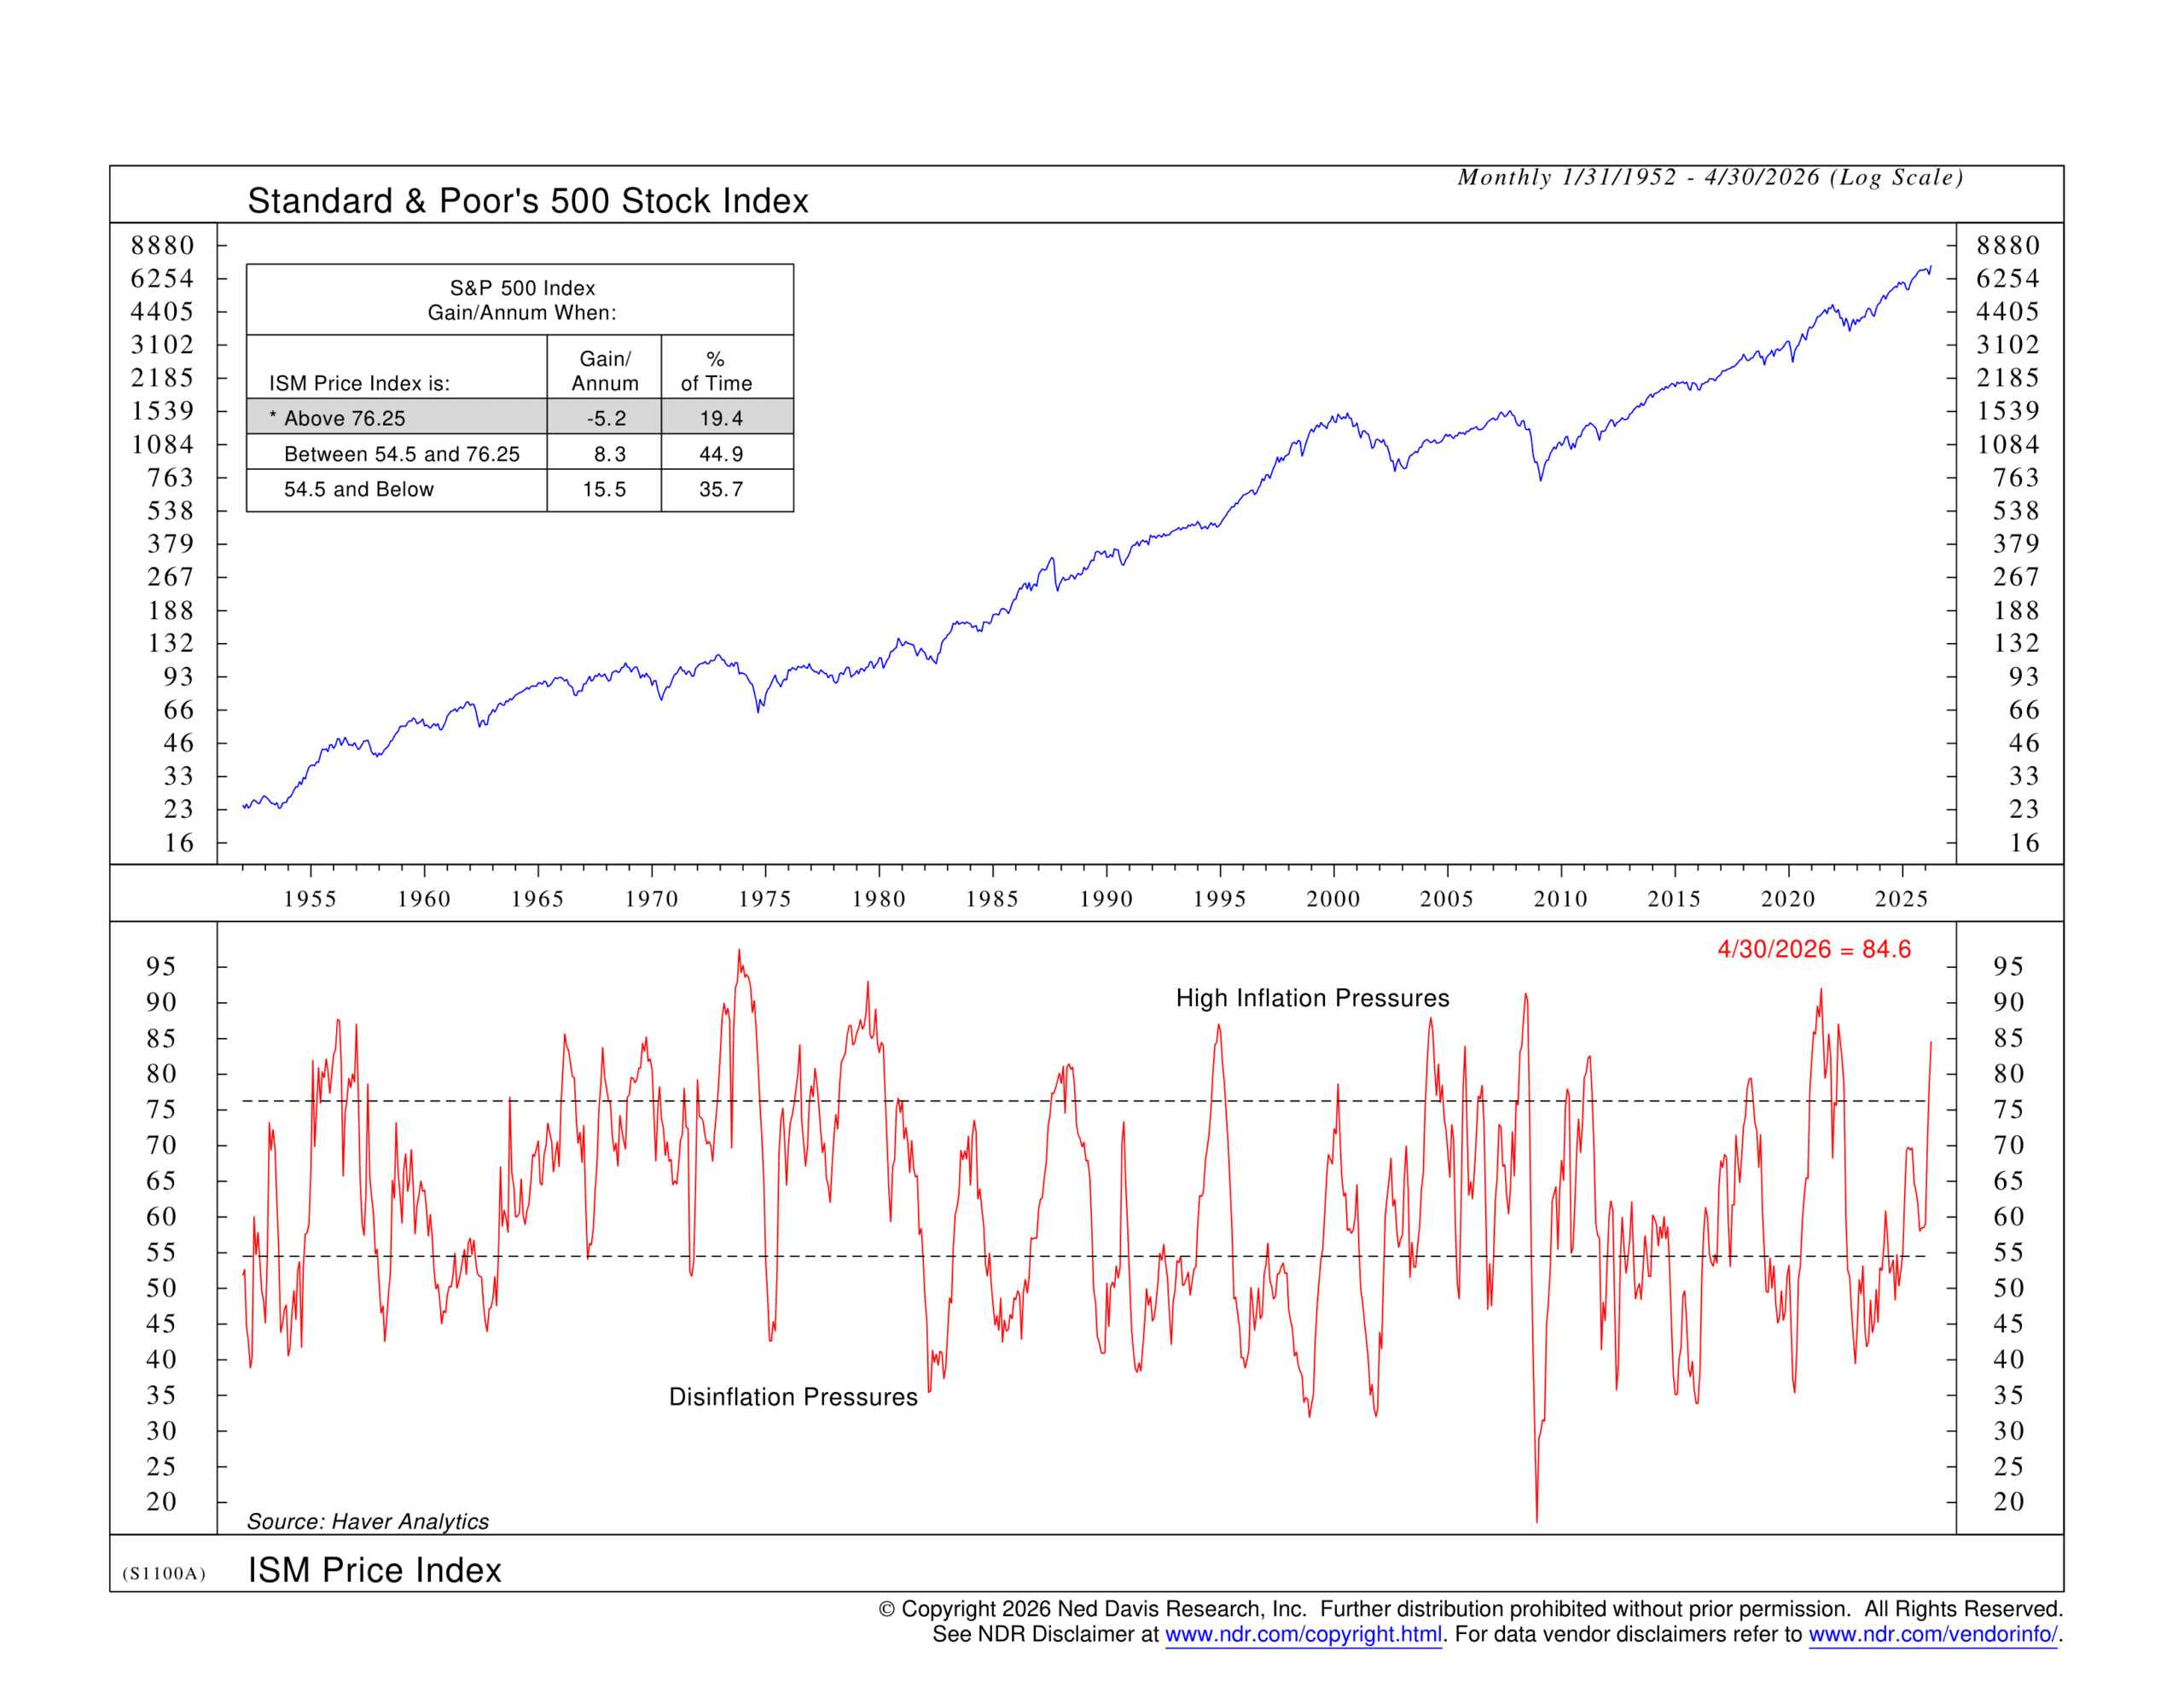
But… there are some areas to keep an eye on. The ISM Price Index—shown below—is one. It’s signaling very high inflation pressures right now. Manufactures are having to pay much higher prices for inputs—and that tends to filter through to the actual prices consumers end up paying.
Oh, and then there’s our “rate of inflation” indicator. This one tracks the year-over-year change in the Consumer Price Index (CPI) and then also takes a 6-month average of that. If the CPI increases more than 0.6 percentage points above the 6-month average, it triggers a sell signal for the stock market.
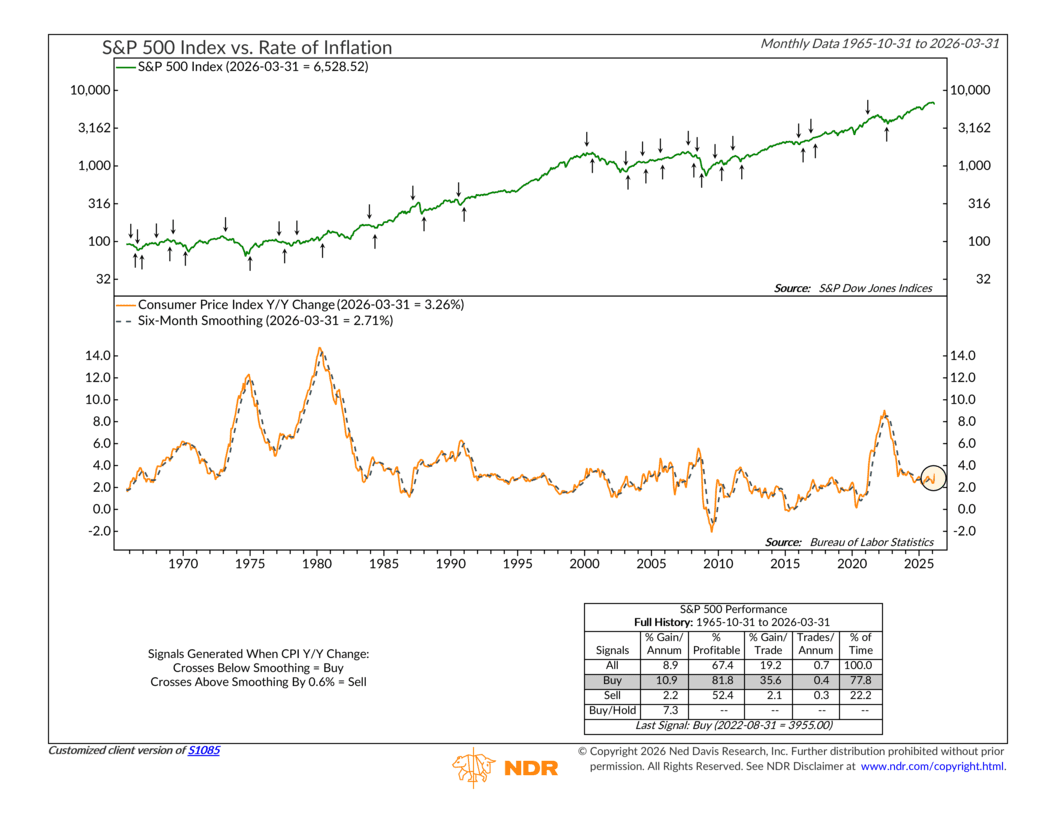
As you can see, last month, the spread was 0.55 percentage points. So yeah, it doesn’t get much closer than that.
So what’s the bottom line? Well, T.S. Eliot was writing about working through the wreckage of the past. That’s not a bad way to describe where we are. Stocks had a bad March, but then a genuinely strong April. At the same time, inflation looks OK but hasn’t necessarily been tamed either.
If the data continues to drift in the wrong direction, some of the tailwinds the market has been counting on could turn into headwinds faster than expected. But for now, the weight of the evidence still leans positive.
This is intended for informational purposes only and should not be used as the primary basis for an investment decision. Consult an advisor for your personal situation.
Indices mentioned are unmanaged, do not incur fees, and cannot be invested into directly.
Past performance does not guarantee future results.
The S&P 500 Index, or Standard & Poor’s 500 Index, is a market-capitalization-weighted index of 500 leading publicly traded companies in the U.S.
The Dow Jones Industrial Average (DJIA) is a price-weighted index composed of 30 widely traded blue-chip U.S. common stocks. The Nasdaq 100 Index is a basket of the 100 largest, most actively traded U.S. companies listed on the Nasdaq stock exchange. The index includes companies from various industries except for the financial industry, like commercial and investment banks. The Russell 3000 Index is a capitalization-weighted stock market index that seeks to be a benchmark of the entire U.S. stock market. The S&P MidCap 400 is designed to measure the performance of 400 mid-sized companies, reflecting the distinctive risk and return characteristics of this market segment. S&P 600 Index measures the small-cap segment of the U.S. equity market. The index is designed to track companies that meet specific inclusion criteria to ensure that they are liquid and financially viable. The S&P 100 index is a capitalization-weighted index based on 100 highly capitalized stocks for which options are listed on the CBOE (Chicago Board of Exchange). The MSCI EAFE Index is an equity index which captures large and mid cap representation across 21 Developed Markets countries* around the world, excluding the US and Canada.
The Bloomberg U.S. Corporate Bond Index measures the investment grade, fixed-rate, taxable corporate bond market. The Bloomberg U.S. Corporate High Yield Index is comprised of domestic and corporate bonds rated Ba and below with a minimum outstanding amount of $150 million. The Bloomberg U.S. Municipal Index covers the USD-denominated long-term tax exempt bond market. The index has four main sectors: state and local general obligation bonds, revenue bonds, insured bonds and prerefunded bonds.