OVERVIEW
The U.S. stock market rebounded aggressively last week. The S&P 500 gained 7.32%, the Dow rose 6.87%, and the tech-heavy Nasdaq surged a whopping 9.01%.
The rally once again centered around large-cap growth stocks; in other words, the big tech companies.
Volatility came down dramatically, as the VIX index cratered from 38.02 to 24.86 in five days.
International stocks did similarly well, as both developed and emerging market stocks rallied north of 7% for the week.
The 10-year Treasury bond yield went on a roller coaster ride as the election results trickled in during the week. After reaching nearly 0.94% at one point, the yield fell and settled around 0.77%. Government bond prices rose as a result, and corporate bonds did well, too.
Commodities did well overall; gold, oil, and corn prices all rose by large amounts.
And finally, the U.S. dollar weakened by more than 1% against the world’s major currencies.
KEY CONSIDERATIONS
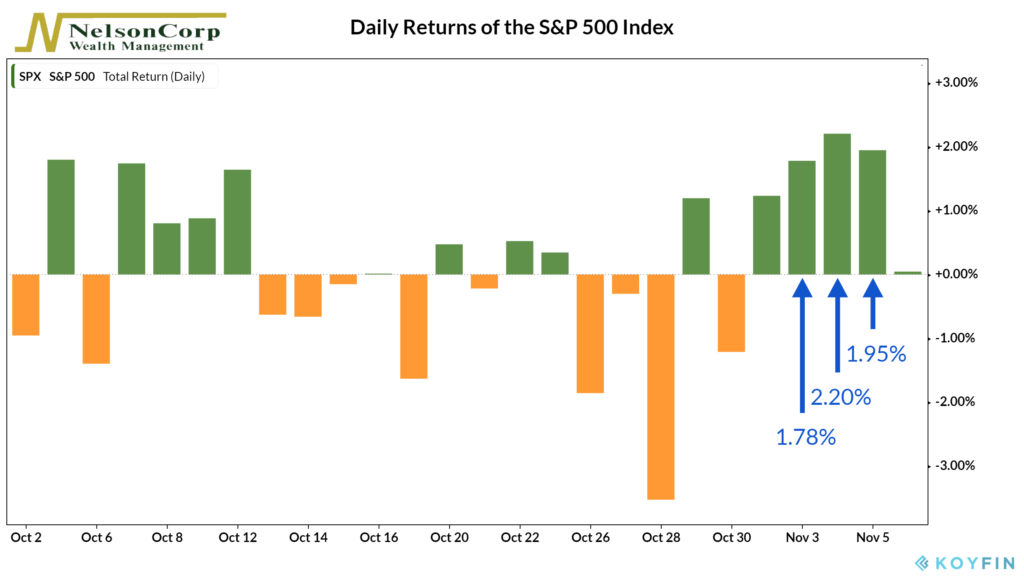
Three’s Company – The S&P 500 stock index did something rare last week. On three straight days, it rose by 1.5% or more. The three-day return sequence for the stock index was 1.78%, 2.20%, and 1.95%.

We call this bullish price action a three-day thrust. A thrust, in this sense, means an unusual demand for stocks. A three-day thrust of this magnitude has only occurred about a dozen times since 1970. And every one of those instances resulted in a positive return for the market one year later. On average, the subsequent one-year return was around 20%.
These types of thrust signals are relatively reliable, but they are rare. Small sample sizes can skew results. For that reason, we like to focus on the weight of evidence using a whole basket of indicators. That way, we aren’t reliant on just one signal or indicator.
We deem the weight of that evidence to be mostly positive still. We did see signs of an overbought market in the past few months. And sentiment reached levels of fairly high optimism (bearish) in mid-October. However, after the double-dip decline in stock prices recently, sentiment has come down to more neutral levels.
More importantly, the longer-term trend has held up. And after the recent downturn in momentum, there are signs that it is picking up again.
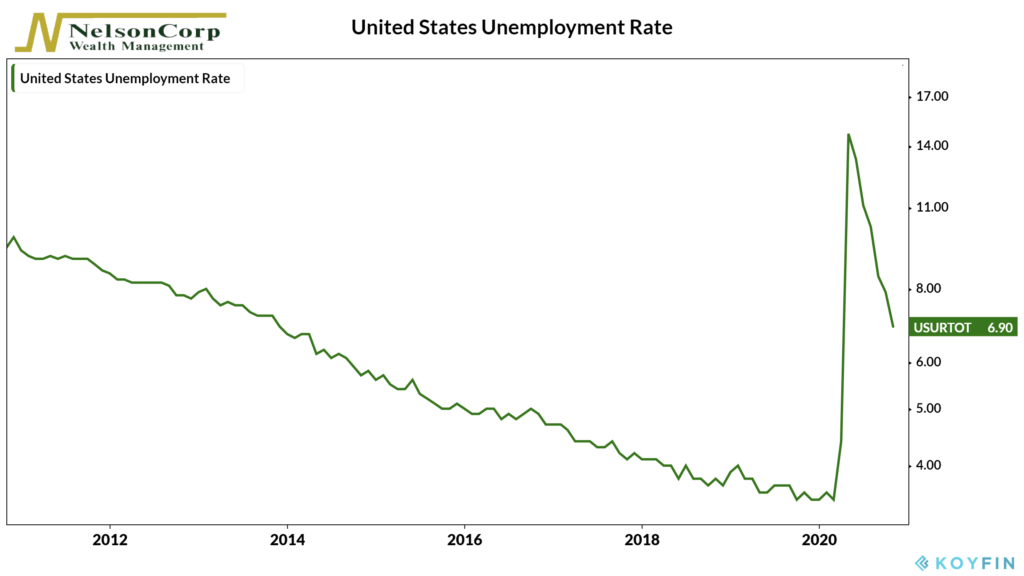
Economy Check-in – On the economic front, things are improving. The unemployment rate fell a full percentage point in October, to 6.9%. And employers added 638,000 jobs last month, a sixth straight month of gains.

While this is good news, there are some concerns. The labor market data is becoming more consistent with a so-called “K” shape recovery, where some industries and workers are doing well while others get worse.
There are a total of about 3.6 million workers who are now considered long-term unemployed (without a job for at least 27 weeks), an increase of one million from the previous month.
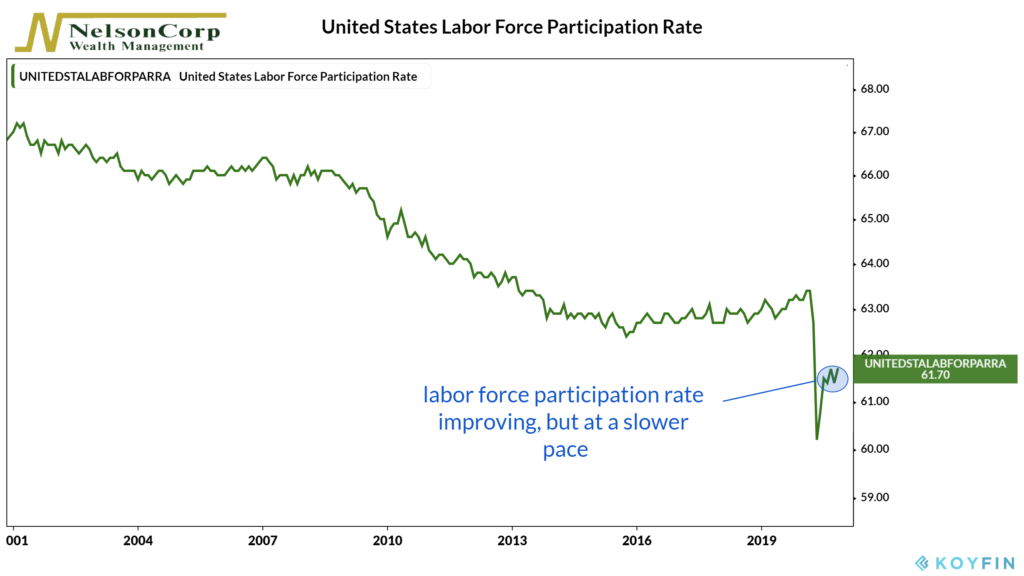
Plus, the labor force participation rate, a measure of the nation’s active workforce, has stalled out in the 61% range.

So it appears that there is still more work to be done before the labor force is back to its fullest potential.
This is intended for informational purposes only and should not be used as the primary basis for an investment decision. Consult an advisor for your personal situation.
Indices mentioned are unmanaged, do not incur fees, and cannot be invested into directly.
Past performance does not guarantee future results.
