OVERVIEW
Markets were mixed last week. Large-cap growth struggled, pulling the S&P 500 down 0.63% and the NASDAQ lower by 1.62%. The S&P 100 also declined 1.00%, highlighting some pressure in the biggest names. In contrast, more cyclical and value-oriented areas held up better. The Dow Jones Industrial Average gained 1.05%, while small- and mid-cap stocks posted solid gains, with the S&P 400 up 0.93% and the S&P 600 rising 2.02%.
International stocks continued to outperform. Developed markets rose 0.85% on the week, while emerging markets added 0.33%, extending what has been a strong year-to-date run for non-U.S. equities. Value also outpaced growth globally, consistent with the broader rotation seen in recent weeks.
Bonds were modestly weaker overall. Short-term Treasuries edged higher, but intermediate- and long-term Treasuries declined, with long bonds down 0.91%. Investment-grade and high-yield bonds were slightly negative, while municipal bonds were nearly flat. Inflation-protected securities also dipped for the week.
Commodities were a notable drag. Broad commodities fell 2.70%, led by a sharp 4.32% drop in oil. Gold was a bright spot, rising 2.01% and continuing its strong year. The U.S. dollar slipped 0.46% on the week.
Volatility picked up modestly, with the VIX ending the week at 15.74, still well below levels typically associated with broader market stress.
KEY CONSIDERATIONS
Took vs. Baggins – Took vs. Baggins. That’s a strange title for an investment piece, isn’t it? But bear with me. If you’ve ever read (or watched) the Hobbit (or the Lord of the Rings), then you might remember that one of the main protagonists—Bilbo Baggins—came from two families: his mother was a Took, and his father was a Baggins.
This is important because one of Tolkien’s more subtle themes in the book is that Bilbo is often pulled in two directions. On the one side, there’s his Baggins nature. It values comfort, routine, and safety most of all. But on the other, there’s his Took side. It’s more restless, curious, and willing to take risks. The Baggins side keeps him grounded, and gives him endurance, but the Took side gives him courage—it pushes him out the door.
Markets often wrestle with that same tension. Investors are constantly deciding whether to lean toward safety or embrace risk.
Now, it might seem obvious, but when investors are willing to take risks, the stock market tends to do better. And when they’re more cautious, stocks tend to struggle.
For example, here’s a chart that sums it up nicely. It compares stocks to bonds and layers in the relative strength of the SHUT index. The SHUT index is an equal-weighted composite of the ACWI Consumer Staples, Health Care, Utilities, and Telecommunications sectors. In other words, it’s a defensive index—the Baggins index—if you will.
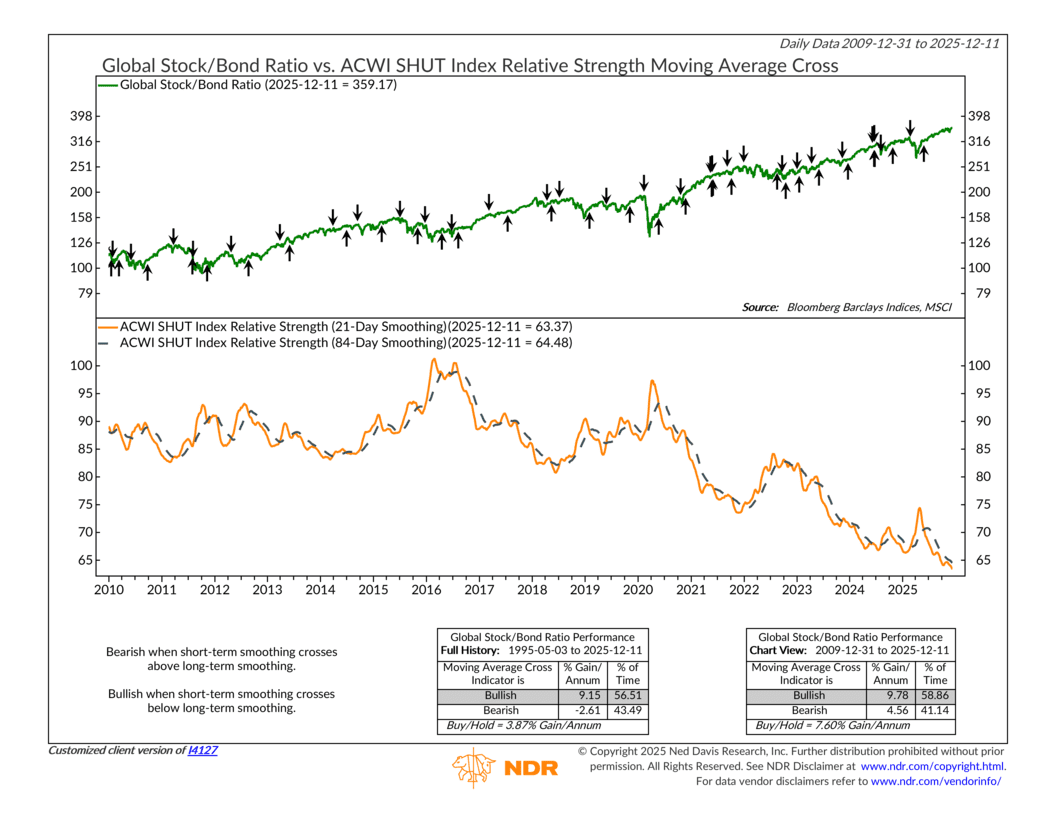
The indicator shows that when the SHUT index (smoothed by 21-days) falls below its longer-term 84-day average, it triggers a “buy” signal for global stocks. This is when the Took side of the market is taking over—investors are embracing risk. And on the other hand, when the SHUT index rises above its average, it triggers a “sell” signal, meaning risk-aversion—the Baggins side—is taking over.
So who’s winning right now? Well, as you can see, the indicator remains on its bullish “buy” signal from May—and the SHUT index continues to plumb new lows. In other words, the Took side is winning, and investors are stepping out the door, ready for adventure.
Now, that doesn’t mean the path forward will be smooth. Even Bilbo’s adventure had its setbacks. And if we look at our models, we see that there is just a tad bit more work to do before we can feel comfortable fully embracing risk. But for the most part, the indicators seem to be moving in that direction.
This is intended for informational purposes only and should not be used as the primary basis for an investment decision. Consult an advisor for your personal situation.
Indices mentioned are unmanaged, do not incur fees, and cannot be invested into directly.
Past performance does not guarantee future results.
The S&P 500 Index, or Standard & Poor’s 500 Index, is a market-capitalization-weighted index of 500 leading publicly traded companies in the U.S.
The Dow Jones Industrial Average (DJIA) is a price-weighted index composed of 30 widely traded blue-chip U.S. common stocks. The Nasdaq 100 Index is a basket of the 100 largest, most actively traded U.S. companies listed on the Nasdaq stock exchange. The index includes companies from various industries except for the financial industry, like commercial and investment banks. The Russell 3000 Index is a capitalization-weighted stock market index that seeks to be a benchmark of the entire U.S. stock market. The S&P MidCap 400 is designed to measure the performance of 400 mid-sized companies, reflecting the distinctive risk and return characteristics of this market segment. S&P 600 Index measures the small-cap segment of the U.S. equity market. The index is designed to track companies that meet specific inclusion criteria to ensure that they are liquid and financially viable. The S&P 100 index is a capitalization-weighted index based on 100 highly capitalized stocks for which options are listed on the CBOE (Chicago Board of Exchange). The MSCI EAFE Index is an equity index which captures large and mid cap representation across 21 Developed Markets countries* around the world, excluding the US and Canada.
The Bloomberg U.S. Corporate Bond Index measures the investment grade, fixed-rate, taxable corporate bond market. The Bloomberg U.S. Corporate High Yield Index is comprised of domestic and corporate bonds rated Ba and below with a minimum outstanding amount of $150 million. The Bloomberg U.S. Municipal Index covers the USD-denominated long-term tax exempt bond market. The index has four main sectors: state and local general obligation bonds, revenue bonds, insured bonds and prerefunded bonds.