
OVERVIEW
KEY CONSIDERATIONS
Trends Matter Most – Federal Reserve Chairman Kevin Warsh offered an interesting piece of advice at Jackson Hole this week: “Nor should we rely on isolated data points. Trends matter most.”
I couldn’t agree more. It’s a useful way to think about the current market environment, because there are plenty of individual data points that look concerning. Inflation is still too high. Interest rates remain elevated. Economic growth has cooled from the pace seen earlier in the cycle.
But when we look beyond any one number and focus on the broader trends, the picture is more encouraging.
Start with inflation.
The Fed’s preferred inflation measure, the Personal Consumption Expenditures Price Index, rose 3.7% over the past year through July, while the core measure, which excludes food and energy, increased 3.3%. Both remain well above the Fed’s 2% target. Warsh acknowledged as much on Friday, saying inflation remains too high and that the Fed needs to be confident inflation is moving toward its objective at a sufficient pace.
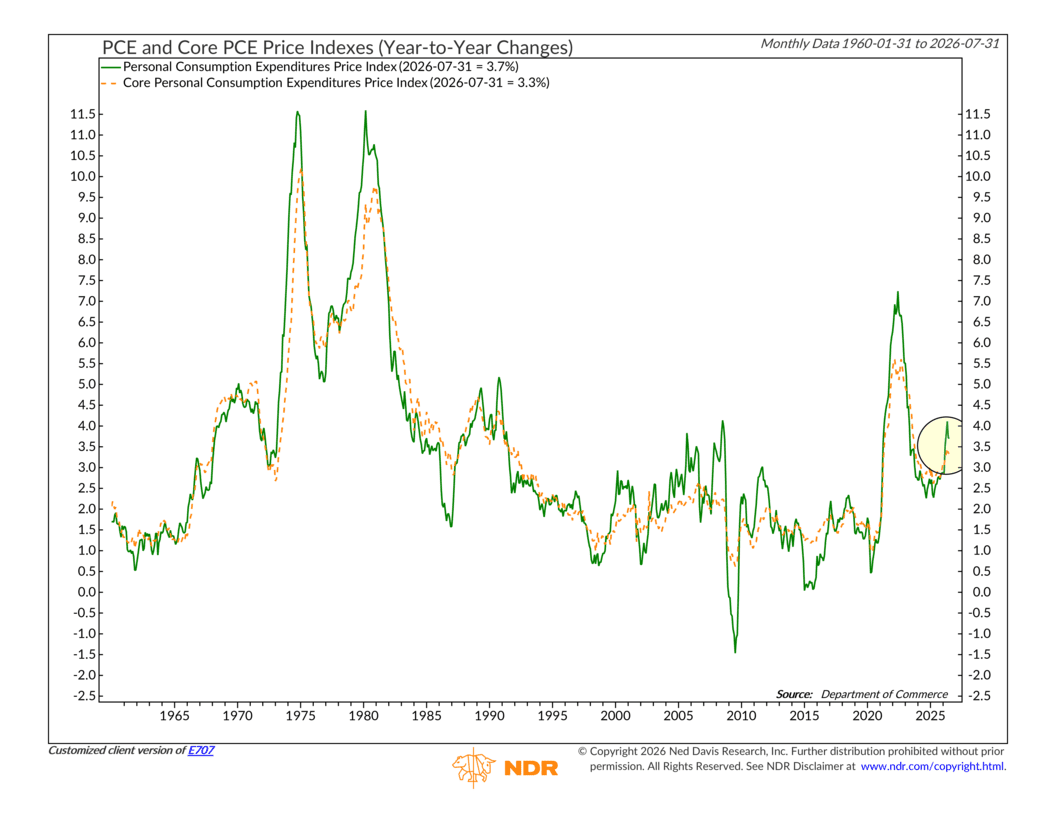
So, there is no question that inflation remains a problem. But the direction (trend) of inflation matters too.
The chart below looks at the year-over-year change in the Consumer Price Index relative to its six-month smoothed trend. When inflation falls below that trend, the indicator generates a positive signal for stocks. When inflation accelerates far enough above it, the signal turns negative.
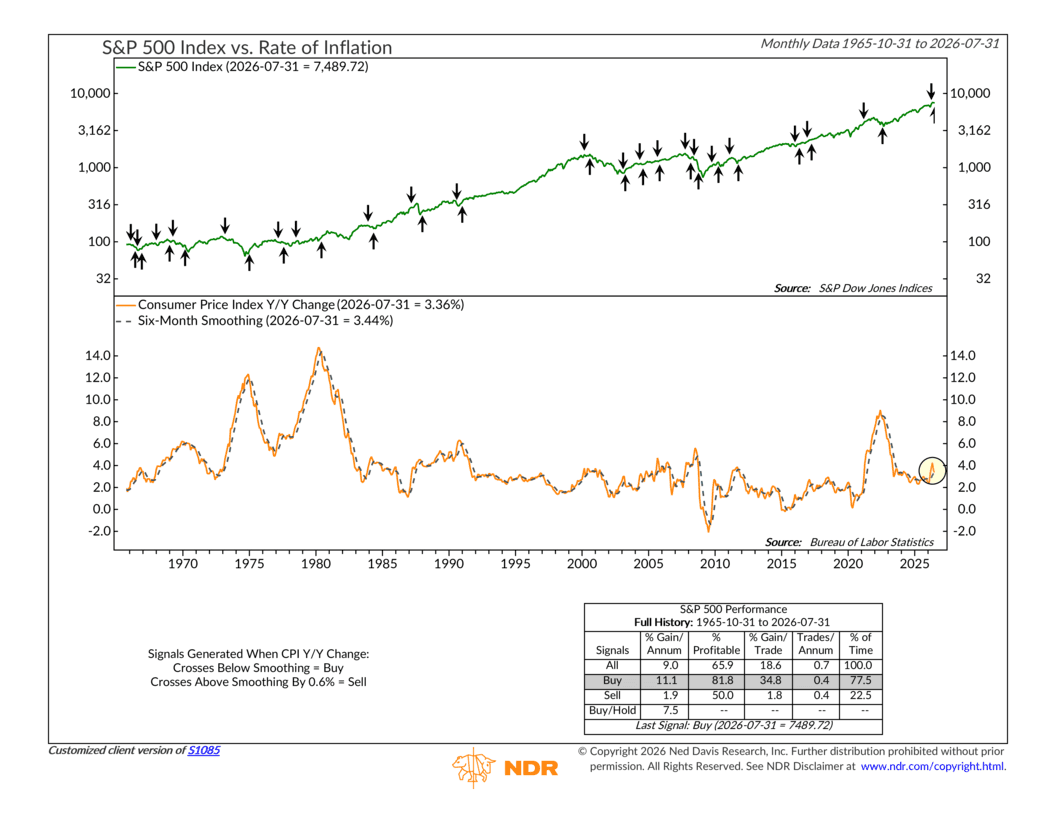
As you can see, the latest reading moved back into the positive camp. CPI inflation is running at 3.36%, slightly below its six-month smoothing of 3.44%.
Historically, that’s been a pretty big deal. Since 1965, the S&P 500 has gained at an 11.1% annualized rate while this indicator has been on a buy signal, compared with just 1.9% during sell signals.
The message here is not that 3%-plus inflation is comfortable. It isn’t. Rather, markets have historically responded favorably when the inflation trend begins moving in the right direction. The level matters, sure, but so does momentum.
Now, there is another part of the inflation story that deserves attention as well: financial conditions.
We highlighted this in our Chart of the Week. I won’t get too deep into it here, but the bottom line from that piece is that interest rates are only one piece of the broader financial-conditions puzzle.
To add a little more context, the chart below pairs financial conditions with the year-over-year growth rate of U.S. industrial production. Industrial production is currently up about 1.1% from a year ago, meaning the real economy continues to expand.
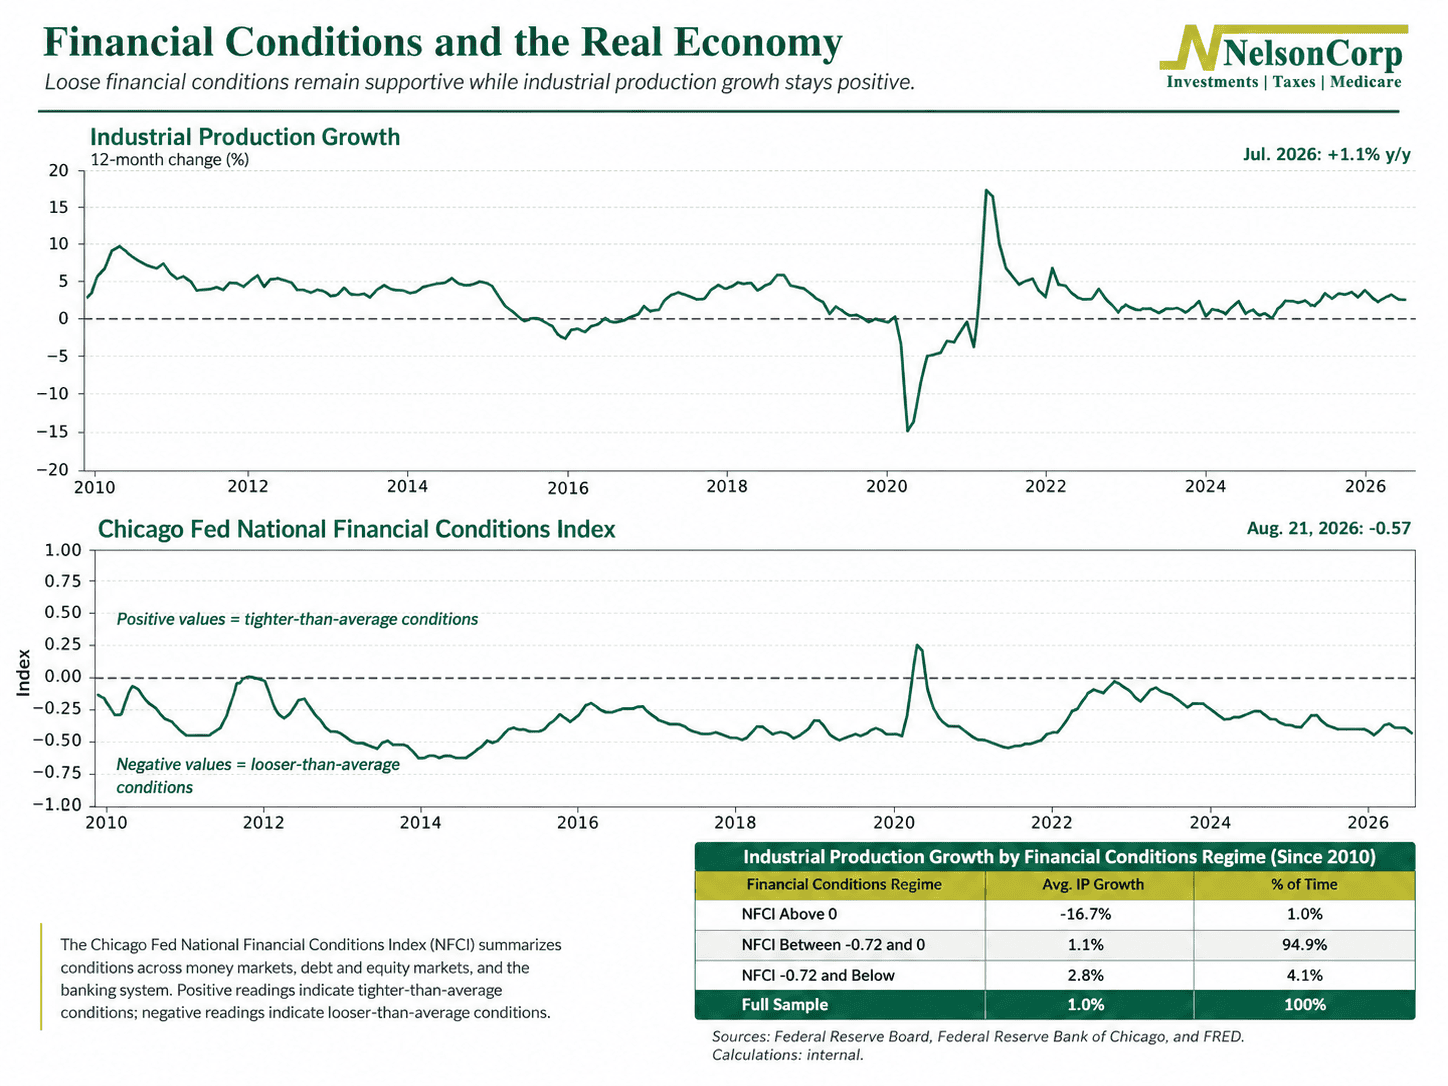
When the NFCI has been between -0.72 and zero—which includes the current reading—industrial production growth has averaged roughly 1.1%. During the loosest financial-condition environments, with the NFCI below -0.72, growth has averaged closer to 2.8%.
The takeaway? Loose financial conditions don’t guarantee strong economic growth, but they certainly provide a more supportive backdrop.
Oh, and by the way, the stock market generally likes that backdrop too.
That brings us to the final chart, which tracks the S&P 500’s intermediate-term trend using its 63-day moving average relative to its longer-term 252-day moving average. The trend bent during the market weakness this spring, but it never deteriorated enough to generate a bearish signal.
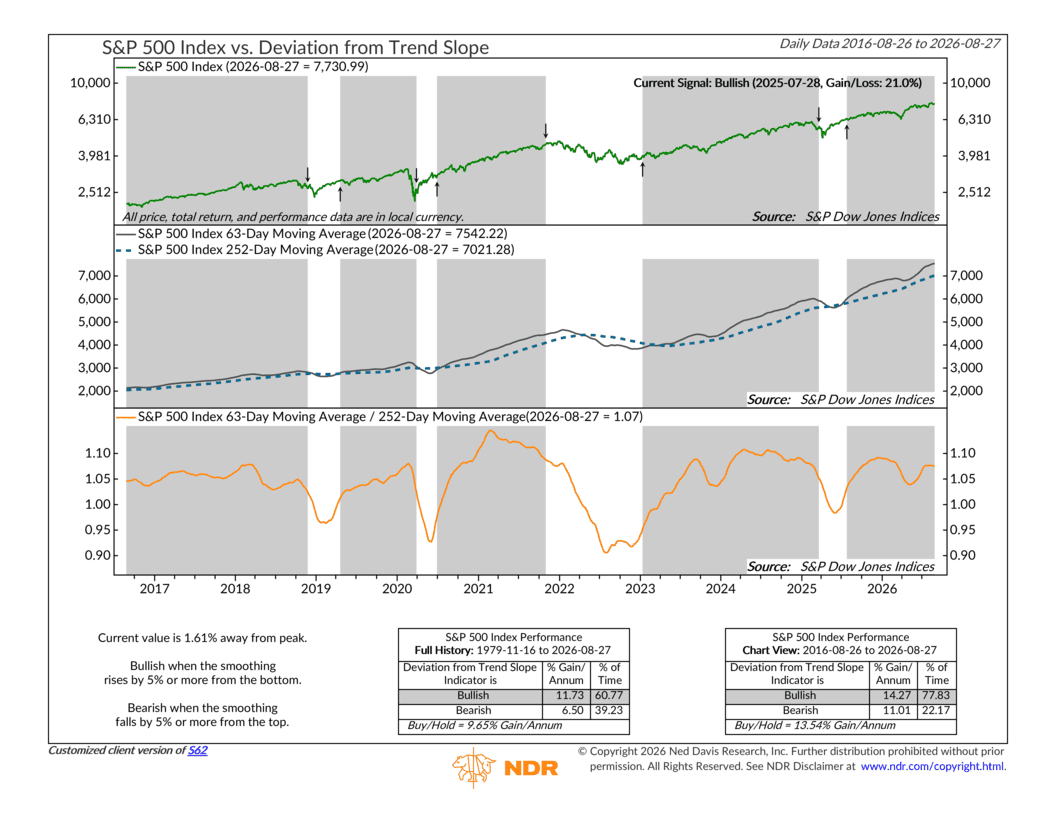
Since then, it has strengthened again.
Now, none of this means investors should ignore inflation, the Fed, or the risks that come with higher interest rates. In fact, sticky inflation remains one of the biggest reasons to stay alert. If inflation begins accelerating again, the Fed may have little choice but to respond.
But that is not what the weight of the evidence is telling us today.
Inflation is high, but its recent trend has improved enough to generate a positive market signal. Financial conditions remain loose. Industrial activity continues to expand. And the primary market trend remains bullish.
There will always be individual data points that give investors something to worry about.
For now, the broader trends still look constructive.
This is intended for informational purposes only and should not be used as the primary basis for an investment decision. Consult an advisor for your personal situation.
Indices mentioned are unmanaged, do not incur fees, and cannot be invested into directly.
Past performance does not guarantee future results.
The S&P 500 Index, or Standard & Poor’s 500 Index, is a market-capitalization-weighted index of 500 leading publicly traded companies in the U.S.
The Dow Jones Industrial Average (DJIA) is a price-weighted index composed of 30 widely traded blue-chip U.S. common stocks. The Nasdaq 100 Index is a basket of the 100 largest, most actively traded U.S. companies listed on the Nasdaq stock exchange. The index includes companies from various industries except for the financial industry, like commercial and investment banks. The Russell 3000 Index is a capitalization-weighted stock market index that seeks to be a benchmark of the entire U.S. stock market. The S&P MidCap 400 is designed to measure the performance of 400 mid-sized companies, reflecting the distinctive risk and return characteristics of this market segment. S&P 600 Index measures the small-cap segment of the U.S. equity market. The index is designed to track companies that meet specific inclusion criteria to ensure that they are liquid and financially viable. The S&P 100 index is a capitalization-weighted index based on 100 highly capitalized stocks for which options are listed on the CBOE (Chicago Board of Exchange). The MSCI EAFE Index is an equity index which captures large and mid cap representation across 21 Developed Markets countries* around the world, excluding the US and Canada.
The Bloomberg U.S. Corporate Bond Index measures the investment grade, fixed-rate, taxable corporate bond market. The Bloomberg U.S. Corporate High Yield Index is comprised of domestic and corporate bonds rated Ba and below with a minimum outstanding amount of $150 million. The Bloomberg U.S. Municipal Index covers the USD-denominated long-term tax exempt bond market. The index has four main sectors: state and local general obligation bonds, revenue bonds, insured bonds and prerefunded bonds.