OVERVIEW
KEY CONSIDERATIONS
What Rates? – There are a couple of general investing rules we like to follow here at NelsonCorp.
One is “Don’t fight the tape,” meaning we like to respect the market’s current trend and momentum instead of betting against what prices are clearly doing.
Here’s what that “trend” or tape looks like visually. Currently, all of the S&P 500 stock index’s moving averages, technical measures of trend, are pointing higher.
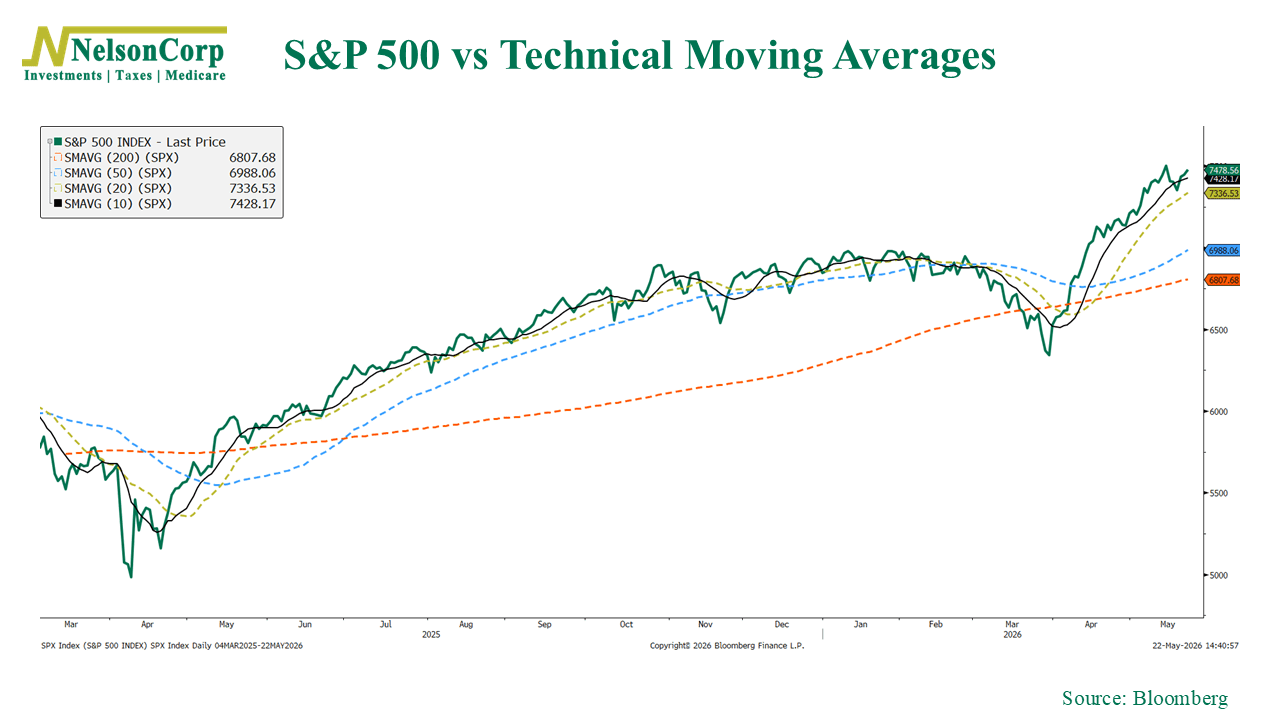
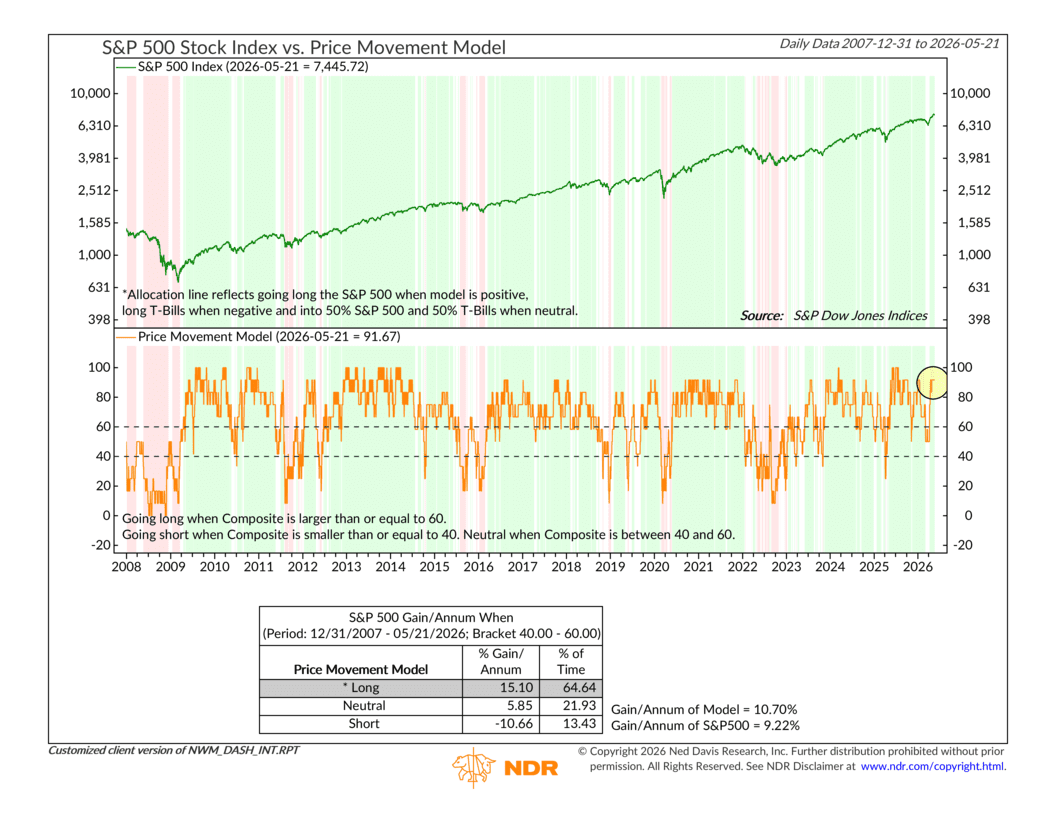
That’s what we call bullish price action. And it’s showing up clearly in our Price Movement Model, shown below.
But there’s another rule we like to follow as well: “Don’t fight the Fed.” Basically, this means don’t fight the monetary environment, which includes things like interest rates.
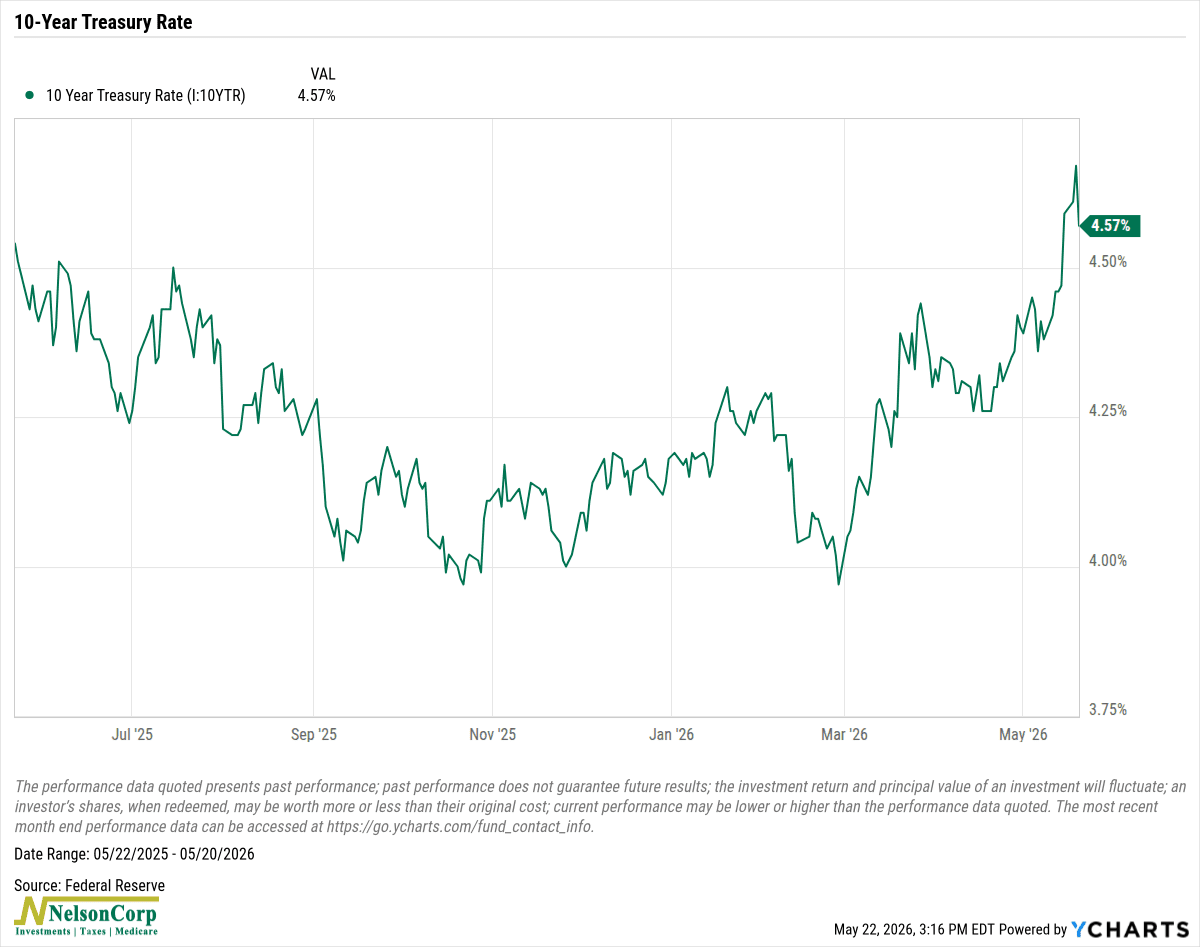
Now, interest rates had been heading lower before the Iran conflict. The 10-year Treasury yield got to as low as 3.97% on February 27th. But fast forward to today, and we see rates are currently hovering around 4.57%. Yikes!
This creates a tough setup because rising rates have historically been bearish for stocks. Higher rates can increase borrowing costs, make bonds more attractive relative to stocks, and slow economic activity.
Here’s the perfect indicator to drive home the point. This specific metric compares 10-year Treasury yields to a 70-week trendline to determine how “out of whack” rates have become. As you can see, yields are well above trend, suggesting rates are high enough that they’ve historically coincided with negative, yes, negative, stock market returns.
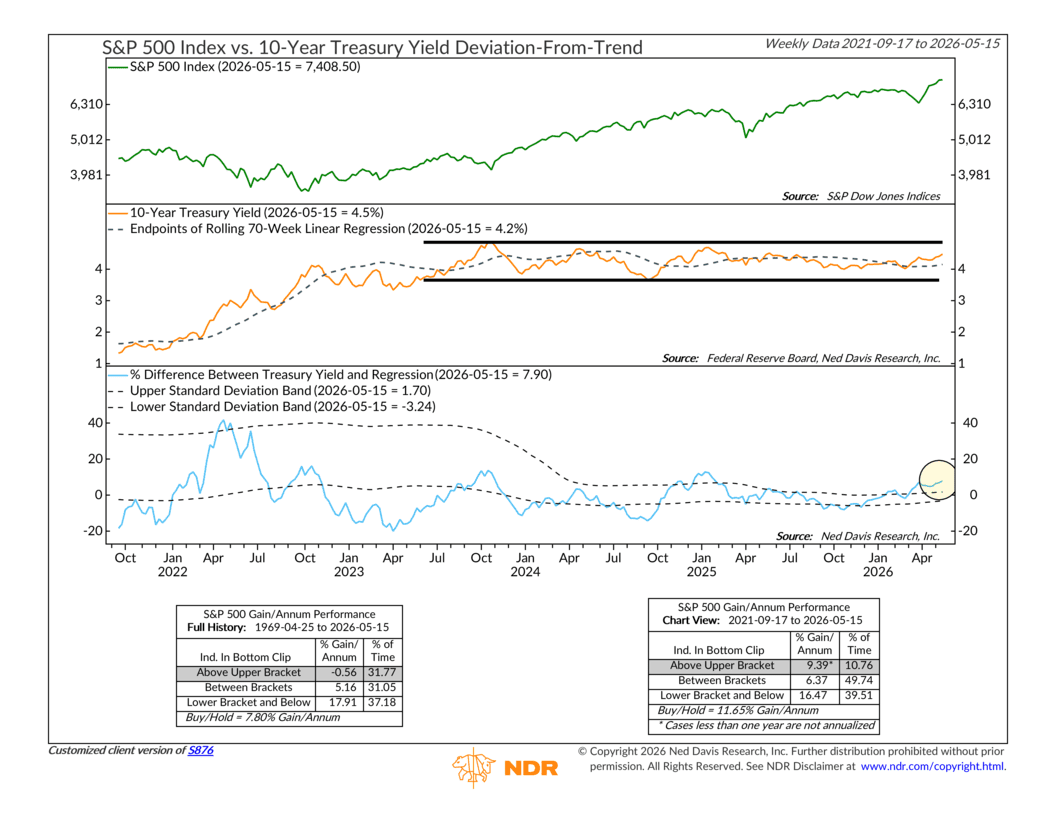
According to the indicator, 10-year rates would have to fall by at least 30-40 basis points to even get back to neutral territory.
Ok, but you’re probably asking, why are rates rising so much? Well, rates usually rise in response to inflation and anticipated Fed action. And one great way to measure inflation pressure is through commodity prices.
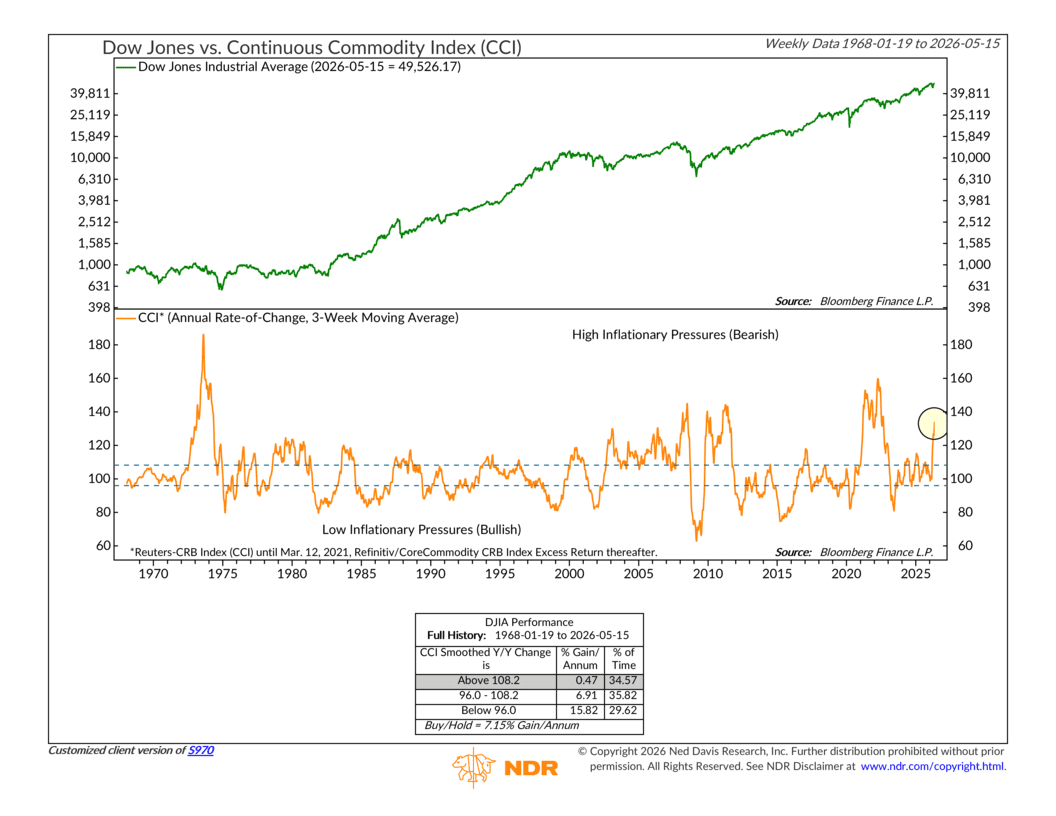
Well, commodity prices are still rising. The following indicator shows the annual rate-of-change of the Continuous Commodity Index (CCI). It’s up about 134% over the past year alone. In the past, when commodities have risen this high and this fast, it has often occurred near major stock market tops. In other words, this is a very bearish indicator.
But, with all that said, the stock market continues to climb higher. It appears to be saying, “What Rates?” and instead is focusing on the bullish earnings news and economic growth holding up (which we highlighted in this week’s Chart of the Week post).
One side of the market is clearly flashing caution, while the other keeps pushing to new highs, and that’s creating a fascinating tension in the financial world right now.
This is intended for informational purposes only and should not be used as the primary basis for an investment decision. Consult an advisor for your personal situation.
Indices mentioned are unmanaged, do not incur fees, and cannot be invested into directly.
Past performance does not guarantee future results.
The S&P 500 Index, or Standard & Poor’s 500 Index, is a market-capitalization-weighted index of 500 leading publicly traded companies in the U.S.
The Dow Jones Industrial Average (DJIA) is a price-weighted index composed of 30 widely traded blue-chip U.S. common stocks. The Nasdaq 100 Index is a basket of the 100 largest, most actively traded U.S. companies listed on the Nasdaq stock exchange. The index includes companies from various industries except for the financial industry, like commercial and investment banks. The Russell 3000 Index is a capitalization-weighted stock market index that seeks to be a benchmark of the entire U.S. stock market. The S&P MidCap 400 is designed to measure the performance of 400 mid-sized companies, reflecting the distinctive risk and return characteristics of this market segment. S&P 600 Index measures the small-cap segment of the U.S. equity market. The index is designed to track companies that meet specific inclusion criteria to ensure that they are liquid and financially viable. The S&P 100 index is a capitalization-weighted index based on 100 highly capitalized stocks for which options are listed on the CBOE (Chicago Board of Exchange). The MSCI EAFE Index is an equity index which captures large and mid cap representation across 21 Developed Markets countries* around the world, excluding the US and Canada.
The Bloomberg U.S. Corporate Bond Index measures the investment grade, fixed-rate, taxable corporate bond market. The Bloomberg U.S. Corporate High Yield Index is comprised of domestic and corporate bonds rated Ba and below with a minimum outstanding amount of $150 million. The Bloomberg U.S. Municipal Index covers the USD-denominated long-term tax exempt bond market. The index has four main sectors: state and local general obligation bonds, revenue bonds, insured bonds and prerefunded bonds.